Pluck Chart: New York Islanders
Introduction
On January 1, 2017, the Minnesota Wild sat comfortably in 2nd place in the Western Conference with 50 standings points and just nine losses. Their starting goalie, Devan Dubnyk, had posted a save percentage (SV%) of 0.941 and goals against average (GAA) of 1.75. These numbers had Dubnyk on pace as the frontrunner for the Vezina Trophy. Two days later, we would strongly recommend (Episode 61 of the LWL Podcast) that Dubnyk owners trade him immediately. There would be no Vezina Trophy for Devan Dubnyk.
Managers who ignored this advice, or were otherwise unable to trade Dubnyk, suffered greatly in fantasy hockey. For the remainder of the season (January through April), Dubnyk posted a SV% of 0.908 and a GAA of 2.69. These are the kind of goalie numbers that cost you victories week after week in fantasy hockey. If you had simply traded Dubnyk for an average NHL goalie, your fantasy team would have performed better than if you had held him (but obviously your return in a Dubnyk trade would have been much better).
Possession and Luck Chart
The primary tool we used to predict Dubnyk's collapse in 2017 was the Left Wing Lock Possession and Luck Chart, or Pluck Chart for short. This chart is published at the Left Wing Lock website and is updated each morning.
Briefly, the Pluck Chart is a quick way to determine whether a team's performance is being driven by puck possession or by luck; and if luck is the driving factor, which type of luck (SV% or SH%) is responsible. A full explanation of how to use the chart is available at the Pluck Chart page
In the case of the 2017-2018 Minnesota Wild, their first-half success was largely driven by luck (with unsustainably high team save percentages and shooting percentages). In fact, the team was consistently outshot night after night. When the percentages turned out of favor for Minnesota, there were no strong puck possession numbers to drive team success. The St. Louis Blues made quick work of them in the first round of the playoffs.
The 2018-2019 New York Islanders
The New York Islanders are currently posting numbers not unlike the 2016-2017 Minnesota Wild. Entering tonight's game against the Montreal Canadiens, their SHSV% (formerly known as PDO) is 1053 (the highest current value in the NHL). No team has ever finished an NHL season with an SHSV% higher than 1030. The Islanders have a team even-strength shooting percentage (EVSH%) of 10.6% and a team even-strength save percentage (EVSV%) of 0.947. There is only instance of a team finishing a season with an EVSH% above 10% and no team has ever finished a season with an EVSV% greater than 0.940.
Listing these values is only helpful to a point. We created Pluck Charts for a reason and that was to have an efficient means to determine whether a team's performance was primarily dictated by puck possession or by luck. Figure 1 reveals that the performance, to date, of the 2018-2019 New York Islanders has been heavily influenced by luck.

Locate the Islanders' bubble in the upper-left quadrant of Figure 1 (coordinates: 42.7, 1053). The fact that the bubble is located so far to the left of the chart indicates that the team is being consistently (and heavily) outshot by their opponents. That the bubble is located at the vertical position of 1053 indicates that the team performance is being propped up by luck (and lots of it - recall that the highest season-long value for SHSV% ever is 1030). But what kind of luck are the Islanders experiencing? Their bubble size (compare it to some standard bubbles along the top of the chart) reveals an EVSH% of 10.6%, while their bubble color (compare it to the scale along the right side of the chart) reveals an EVSV% of 0.947. The EVSH% is the 2nd highest in the league while the EVSV% is the 4th highest in the league.
The Pluck Chart is packed with information. Once you teach yourself how to properly read it, you can better understand the dynamic of an NHL team. The Islanders currently sit in 1st place in the Metropolitan Division. Some might want to credit that result to newly hired Barry Trotz and his director of goaltending, Mitch Korn (both of 2018 Stanley Cup champion fame). But the Pluck Chart suggests otherwise: the Islanders are a weak puck possession team riding historically high percentages on both the offensive and defensive sides of the rink. It is very unlikely that the team will be able to maintain and build upon their early success.
Fantasy Hockey Applications
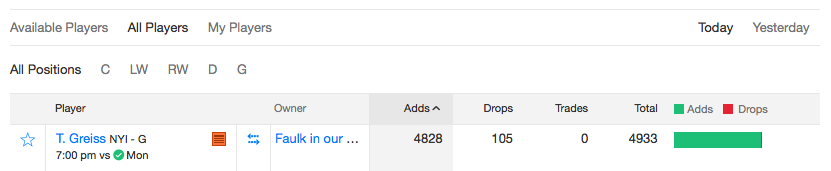
Earlier today, the fantasy hockey team at NHL.com made their weekly suggestions for players to add to your rosters. On this list was Islander goalie Thomas Greiss. Perhaps as a result of the article, Greiss was the most added player in the Yahoo system for today (with nearly 5,000 adds at the time of publication; see Figure 2). We offer exactly the opposite advice: if you own Greiss (he's owned in 38% of all Yahoo leagues at the time of publication), you should spend the next four weeks finding a manager in your league willing to take him in a trade. The Islanders may ride these percentages for a while longer (Minnesota/Dubnyk sustained rather high percentages through December of 2017), but eventually, that large orange bubble in the Pluck Chart is going to drop at least 20 more points. And as it does, Greiss' SV% (and his ability to earn Wins) is going to drop significantly.
Comments (0)
Leave a comment
In order to leave a comment, you must be a registered user at our website and logged in.