BRIAN BOYLE
Explore projections, stats, news, player usage charts, and line combinations for members of the Pittsburgh Penguins
-
Center Leaders
2023 - 2024
Name G A Pts Nathan
MacKinnon51 89 140 Connor McDavid 32 100 132 Auston Matthews 69 38 107 Leon Draisaitl 41 65 106 J.T. Miller 37 66 103 Sam Reinhart 57 37 94 Sidney Crosby 42 52 94 Brayden Point 46 44 90 Sebastian Aho 36 53 89 Elias Pettersson 34 55 89 Robert Thomas 26 60 86 Steven Stamkos 40 41 81 -
Player Card
-
Pittsburgh Penguins Leaders
2023 - 2024
Name PPG PPA PPP Sidney
Crosby10 13 23 Michael Bunting 7 14 21 Evgeni Malkin 6 12 18 Erik Karlsson 2 15 17 Bryan Rust 3 6 9 Reilly Smith 1 7 8 Rickard Rakell 4 2 6 Emil Bemstrom 4 1 5 Lars Eller 4 1 5 Kris Letang 0 5 5 Jeff Carter 4 0 4 Valtteri Puustinen 0 2 2

News
-
Brian Boyle
Is considered week-to-week with a lower-body injury.
May 15, 2022 - 11:51 am -
Brian Boyle
Is expected to be in the lineup for today's game.
Apr 24, 2022 - 3:33 pm -
Brian Boyle
Is expected to be in the lineup for today's game.
Jan 23, 2022 - 12:38 pm -
Brian Boyle
Is not expected to be in the lineup for today's game.
Jan 21, 2022 - 6:41 pm
Feature
-
Trending
Buy-Low and Sell-High: Skaters
Replies 0
Basic Stats
| Season | Team | GP | G | A | P | +/- | PIM | S | S/GP | SH% | PPP | H | BS | FW | FO% | TOI | EVTOI | PPTOI | PKTOI |
|---|---|---|---|---|---|---|---|---|---|---|---|---|---|---|---|---|---|---|---|
| 21-22 | PIT | 66 | 11 | 10 | 21 | 6 | 27 | 87 | 1.3 | 12.6 | 0 | 95 | 39 | 165 | 45.2 | 10.79 | 8.82 | 0.08 | 1.89 |
| 19-20 | FLA | 39 | 6 | 9 | 15 | -5 | 17 | 56 | 1.4 | 10.7 | 1 | 65 | 34 | 197 | 52.4 | 12.38 | 10.97 | 0.89 | 0.52 |
Enhanced Stats (5-on-5 unless denoted with *)
| Season | G/60 | A/60 | P/60 | IPP | ΔPEN/60 | 1A | 2A | EVS/60* | PPS/60* | SATF | SAT% | tEVSH% | tEVSV% | SHSV | ZS% |
|---|---|---|---|---|---|---|---|---|---|---|---|---|---|---|---|
| 21-22 | 1.05 | 0.95 | 2.00 | 84 | 0.00 | 4 | 5 | 8.4 | 23.4 | 505 | 49.6 | 7.6 | 0.928 | 1004 | 30.8 |
| 19-20 | 0.73 | 1.17 | 1.89 | 78 | -0.50 | 3 | 5 | 7.1 | 6.9 | 328 | 42.9 | 9.8 | 0.899 | 997 | 44.1 |
Regression Meter
This meter measures whether or not a player's point production is being influenced by luck. Orange indicates the player has been lucky. Dark grey indicates the player has been unlucky.
2A/60
tEVSH%
SH%
IPP
PPSH%
Positional Data
| Season | Team | Left | Center | Right |
|---|---|---|---|---|
| 21-22 | PIT | 27 | 73 | 0 |
| 19-20 | FLA | 19 | 78 | 3 |
Most Common Linemates and Line Production
See also: Pittsburgh Penguins Line Combo Tool | Line Production Tool
| Team | F1 | F2 | F3 | GF | GA | GF% | SATF | SATA | SAT% | USATF | USATA | USAT% | SH% | SV% | SHSV | ZS% |
|---|
Most Recent 10 Games
| OPP | G | A | P | +/- | PIM | SOG | SH% | H | BS | FW | FL | FO% | TOI | EVTOI | PPTOI | PKTOI | ID |
|---|
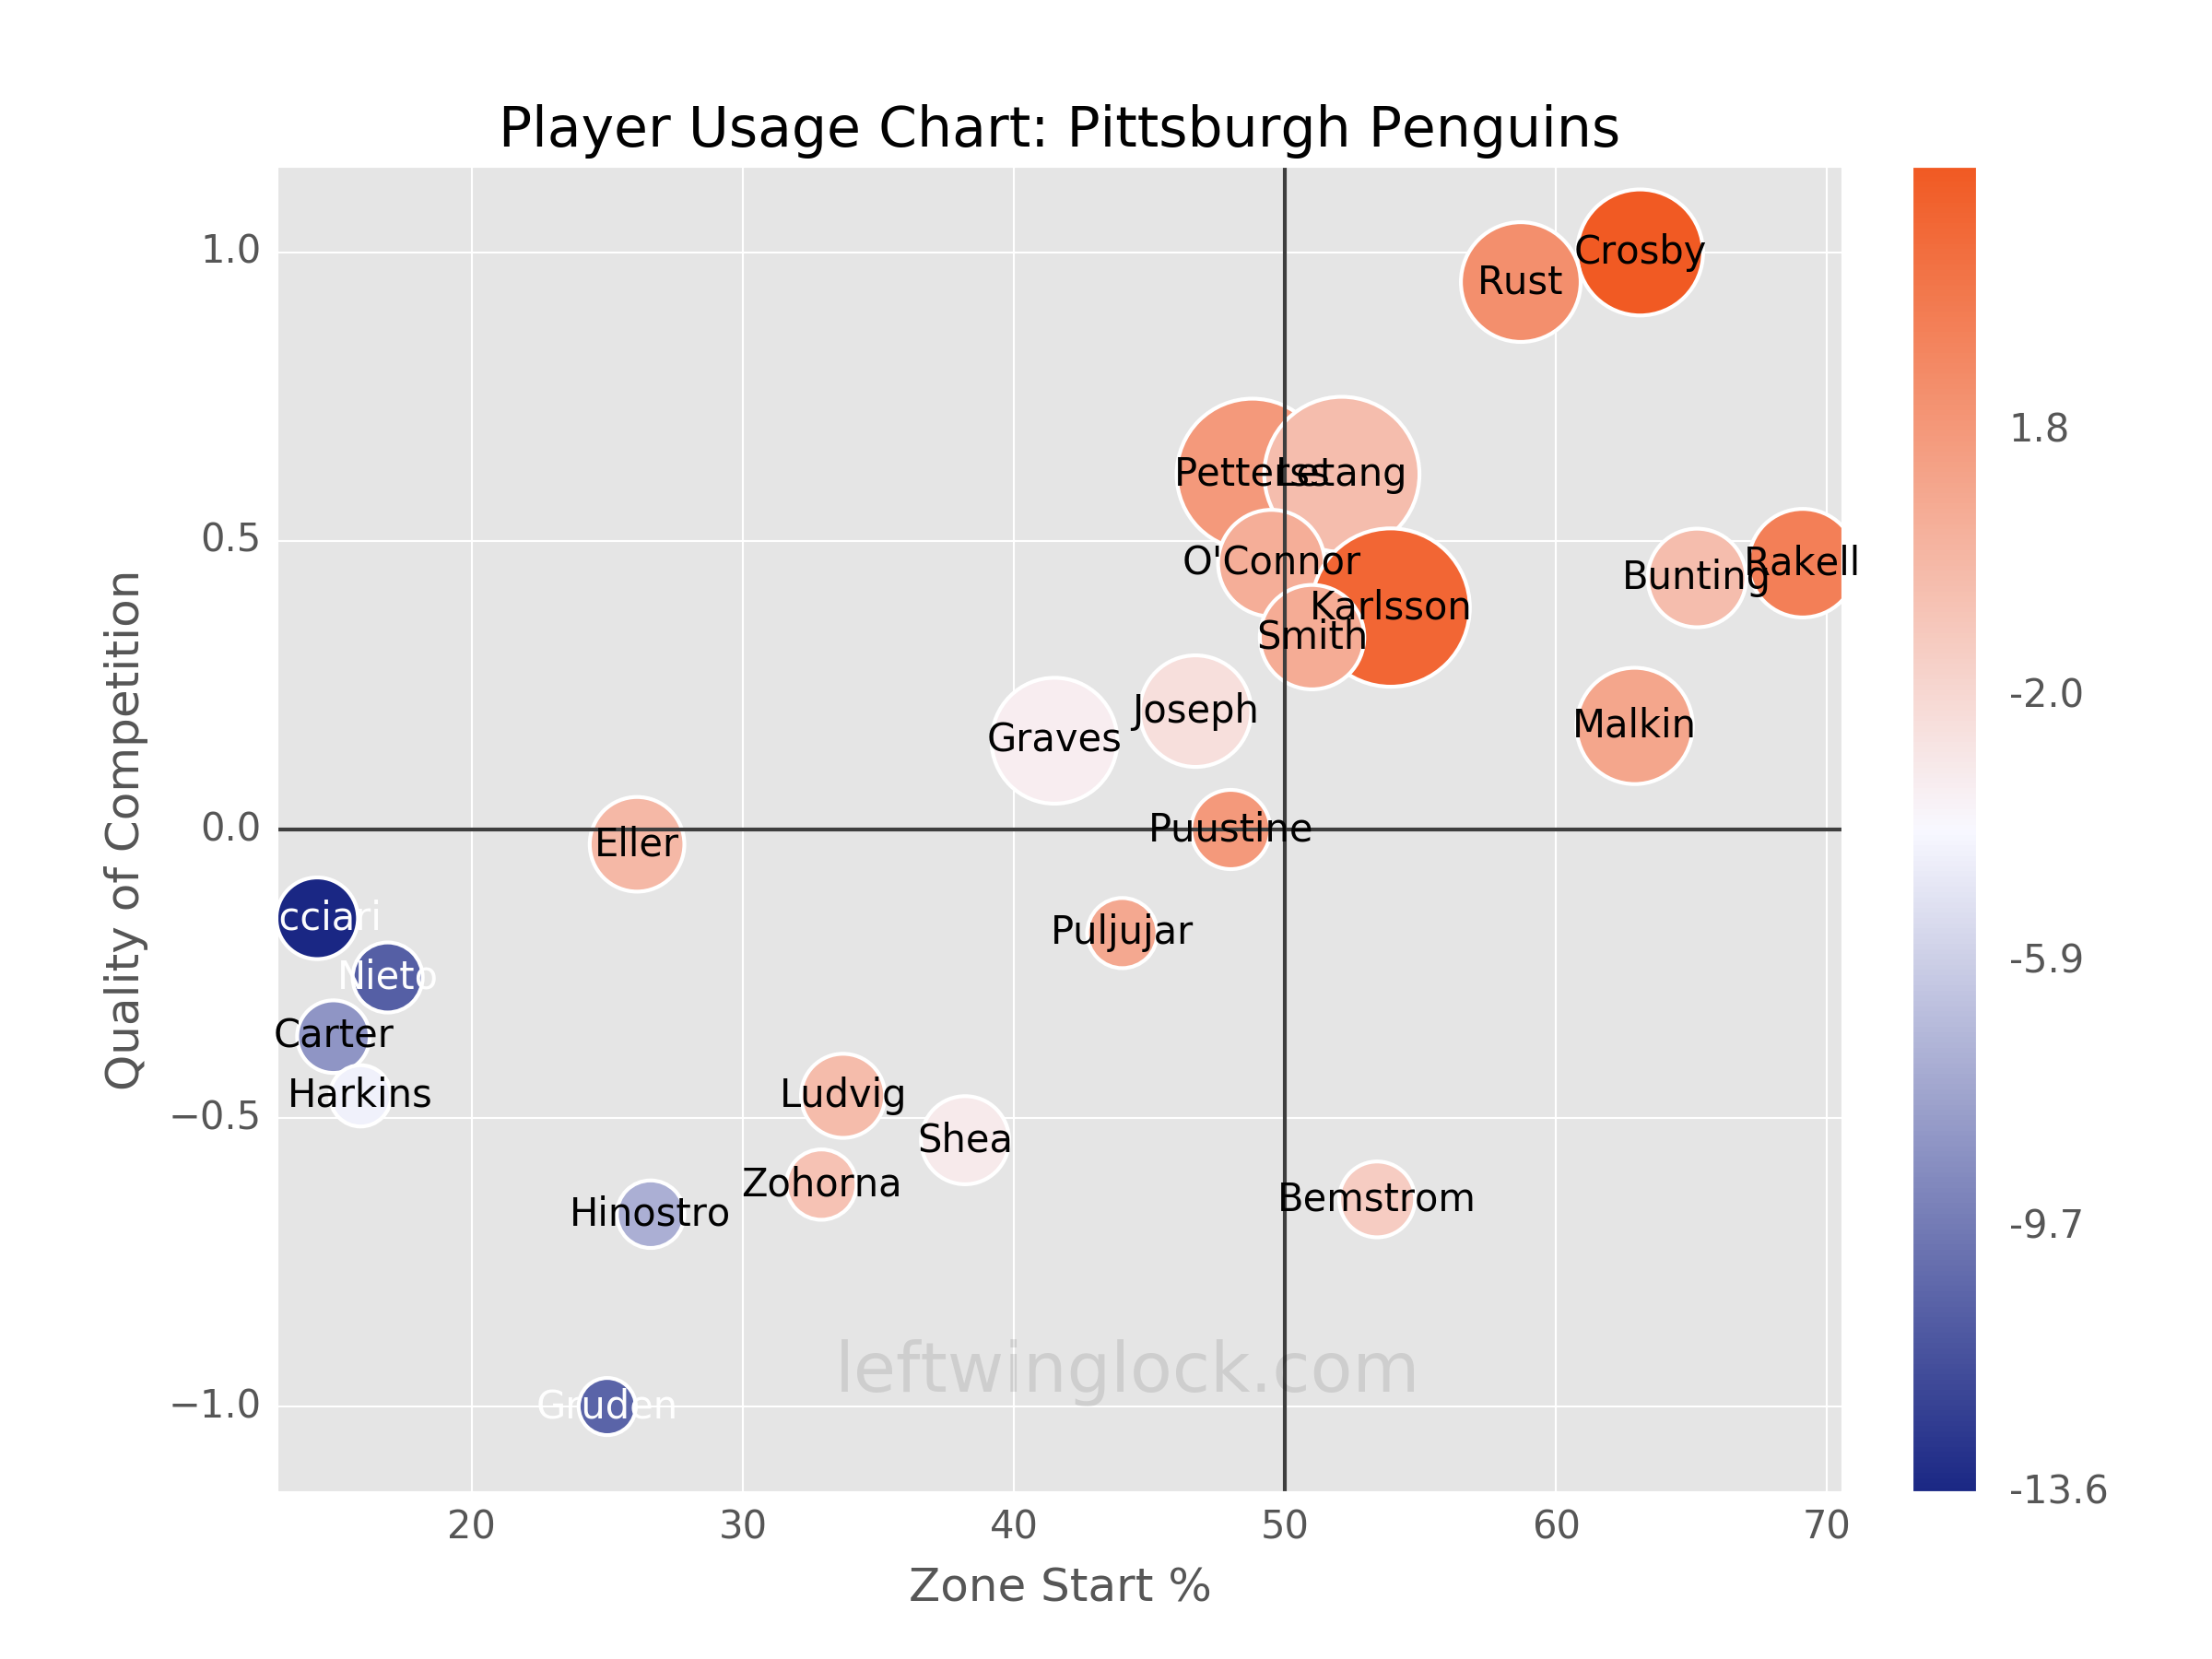
Player Usage Chart / Possession and Luck Chart