CALEB JONES
Explore projections, stats, news, player usage charts, and line combinations for members of the Colorado Avalanche
-
Defenseman Leaders
2023 - 2024
Name G A Pts Quinn
Hughes17 75 92 Cale Makar 21 69 90 Roman Josi 23 62 85 Evan Bouchard 18 64 82 Victor Hedman 13 63 76 Adam Fox 17 56 73 Noah Dobson 10 60 70 Josh Morrissey 10 59 69 Mike Matheson 11 51 62 Rasmus Dahlin 20 39 59 Morgan Rielly 7 51 58 Zach Werenski 11 46 57 -
Player Card
-
Colorado Avalanche Leaders
2023 - 2024
Name G A Pts Nathan
MacKinnon51 89 140 Mikko Rantanen 42 62 104 Cale Makar 21 69 90 Casey Mittelstadt 18 39 57 Jonathan Drouin 19 37 56 Valeri Nichushkin 28 25 53 Devon Toews 12 38 50 Ross Colton 17 23 40 Artturi Lehkonen 16 18 34 Sean Walker 10 19 29 Miles Wood 9 17 26 Logan O'Connor 13 12 25
News
-
Caleb Jones
Has been reassigned to the AHL.
Nov 2, 2023 - 10:34 am -
Caleb Jones
Has been recalled from the AHL.
Oct 31, 2023 - 10:37 am -
Caleb Jones
Has been traded to the Colorado Avalanche in exchange for Callahan Burke.
Oct 10, 2023 - 12:54 pm -
Caleb Jones
Has signed a one-year contract with the Carolina Hurricanes.
Aug 10, 2023 - 6:44 pm
Feature
-
Trending
No articles available
Replies 0
Basic Stats
| Season | Team | GP | G | A | P | +/- | PIM | S | S/GP | SH% | PPP | H | BS | FW | FO% | TOI | EVTOI | PPTOI | PKTOI |
|---|---|---|---|---|---|---|---|---|---|---|---|---|---|---|---|---|---|---|---|
| 23-24 | COL | 25 | 0 | 5 | 5 | 4 | 8 | 19 | 0.8 | 0.0 | 0 | 34 | 26 | 0 | 0.0 | 12.21 | 11.98 | 0.03 | 0.20 |
| 22-23 | CHI | 73 | 4 | 12 | 16 | -19 | 40 | 86 | 1.2 | 4.7 | 4 | 116 | 118 | 0 | 0.0 | 19.21 | 17.09 | 1.55 | 0.57 |
| 21-22 | CHI | 51 | 5 | 10 | 15 | -3 | 18 | 57 | 1.1 | 8.8 | 1 | 77 | 58 | 0 | 0.0 | 16.72 | 16.01 | 0.34 | 0.38 |
| 20-21 | EDM | 33 | 0 | 4 | 4 | -7 | 6 | 23 | 0.7 | 0.0 | 0 | 27 | 35 | 0 | 0.0 | 13.61 | 12.99 | 0.04 | 0.57 |
| 19-20 | EDM | 43 | 4 | 5 | 9 | -1 | 10 | 38 | 0.9 | 10.5 | 1 | 33 | 46 | 0 | 0.0 | 14.13 | 13.99 | 0.09 | 0.04 |
Enhanced Stats (5-on-5 unless denoted with *)
| Season | G/60 | A/60 | P/60 | IPP | ΔPEN/60 | 1A | 2A | EVS/60* | PPS/60* | SATF | SAT% | tEVSH% | tEVSV% | SHSV | ZS% |
|---|---|---|---|---|---|---|---|---|---|---|---|---|---|---|---|
| 23-24 | 0.00 | 1.02 | 1.02 | 39 | -0.59 | 3 | 2 | 3.9 | 0.0 | 268 | 48.7 | 9.7 | 0.929 | 1026 | 36.2 |
| 22-23 | 0.10 | 0.45 | 0.55 | 36 | -0.51 | 4 | 5 | 3.5 | 5.3 | 1030 | 47.2 | 7.9 | 0.897 | 976 | 51.3 |
| 21-22 | 0.30 | 0.46 | 0.76 | 49 | -0.07 | 3 | 3 | 3.9 | 13.8 | 639 | 45.6 | 8.1 | 0.917 | 998 | 43.0 |
| 20-21 | 0.00 | 0.56 | 0.56 | 36 | 0.27 | 3 | 1 | 3.2 | 0.0 | 336 | 49.1 | 6.0 | 0.898 | 958 | 54.6 |
| 19-20 | 0.42 | 0.42 | 0.83 | 30 | 0.20 | 4 | 0 | 3.9 | 0.0 | 512 | 48.9 | 9.2 | 0.912 | 1004 | 48.8 |
Regression Meter
This meter measures whether or not a player's point production is being influenced by luck. Orange indicates the player has been lucky. Dark grey indicates the player has been unlucky.
2A/60
tEVSH%
SH%
IPP
PPSH%
Positional Data
| Season | Team | Left | Center | Right |
|---|---|---|---|---|
| 23-24 | COL | 19 | 0 | 81 |
| 22-23 | CHI | 54 | 0 | 46 |
| 21-22 | CHI | 63 | 0 | 37 |
| 20-21 | EDM | 100 | 0 | 0 |
| 19-20 | EDM | 53 | 0 | 47 |
Most Common Pairings and Pair Production
See also: Colorado Avalanche Line Combos | Line Production Tool
| Team | D1 | D2 | GF | GA | GF% | SATF | SATA | SAT% | USATF | USATA | USAT% | SH% | SV% | SHSV | ZS% |
|---|---|---|---|---|---|---|---|---|---|---|---|---|---|---|---|
| COL | JACK JOHNSON | CALEB JONES | 5 | 3 | 62.5 | 155 | 156 | 49.8 | 107 | 109 | 49.5 | 6.5 | 0.960 | 1025 | 35.1 |
| COL | SAM MALINSKI | CALEB JONES | 2 | 1 | 66.7 | 47 | 31 | 60.3 | 33 | 20 | 62.3 | 10.5 | 0.923 | 1028 | 57.1 |
| COL | DEVON TOEWS | CALEB JONES | 0 | 0 | 24 | 19 | 55.8 | 18 | 12 | 60.0 | 0.0 | 1.000 | 1000 | 100.0 |
Next Opponent (With Line Matching)
Winnipeg Jets on April 26, 2024 | See also: Line Matching Tool
*** You are seeing no results because these teams have not played yet this season or CALEB JONES was likely ill, injured, or scratched for the previous matchup. ***| FORWARD 1 | FORWARD 2 | FORWARD 3 | Frequency |
|---|
Most Recent 10 Games
| OPP | G | A | P | +/- | PIM | SOG | SH% | H | BS | FW | FL | FO% | TOI | EVTOI | PPTOI | PKTOI | ID |
|---|---|---|---|---|---|---|---|---|---|---|---|---|---|---|---|---|---|
| WPG | 0 | 0 | 0 | 0 | 2 | 0 | 0 | 0 | 1 | 0 | 0 | 0 | 09:52 | 09:44 | 00:08 | 00:00 | 30162 |
| WPG | 0 | 0 | 0 | 0 | 0 | 0 | 0 | 2 | 0 | 0 | 0 | 0 | 11:57 | 11:57 | 00:00 | 00:00 | 30161 |
| EDM | 0 | 0 | 0 | 1 | 0 | 0 | 0 | 1 | 1 | 0 | 0 | 0 | 16:19 | 15:12 | 00:00 | 01:07 | 21310 |
| VGK | 0 | 0 | 0 | -1 | 0 | 1 | 0 | 1 | 0 | 0 | 0 | 0 | 16:08 | 15:37 | 00:00 | 00:31 | 21284 |
| VAN | 0 | 0 | 0 | -1 | 0 | 0 | 0 | 1 | 0 | 0 | 0 | 0 | 05:17 | 05:17 | 00:00 | 00:00 | 21044 |
| DET | 0 | 0 | 0 | -1 | 0 | 1 | 0 | 1 | 1 | 0 | 0 | 0 | 12:20 | 12:14 | 00:06 | 00:00 | 20991 |
| CHI | 0 | 1 | 1 | 1 | 0 | 1 | 0 | 0 | 0 | 0 | 0 | 0 | 15:43 | 15:43 | 00:00 | 00:00 | 20979 |
| MTL | 0 | 0 | 0 | 0 | 0 | 0 | 0 | 0 | 0 | 0 | 0 | 0 | 05:23 | 05:23 | 00:00 | 00:00 | 20678 |
| TOR | 0 | 0 | 0 | -2 | 0 | 0 | 0 | 0 | 1 | 0 | 0 | 0 | 07:21 | 07:21 | 00:00 | 00:00 | 20662 |
| VGK | 0 | 1 | 1 | 1 | 0 | 2 | 0 | 1 | 1 | 0 | 0 | 0 | 11:34 | 10:24 | 00:07 | 01:03 | 20637 |
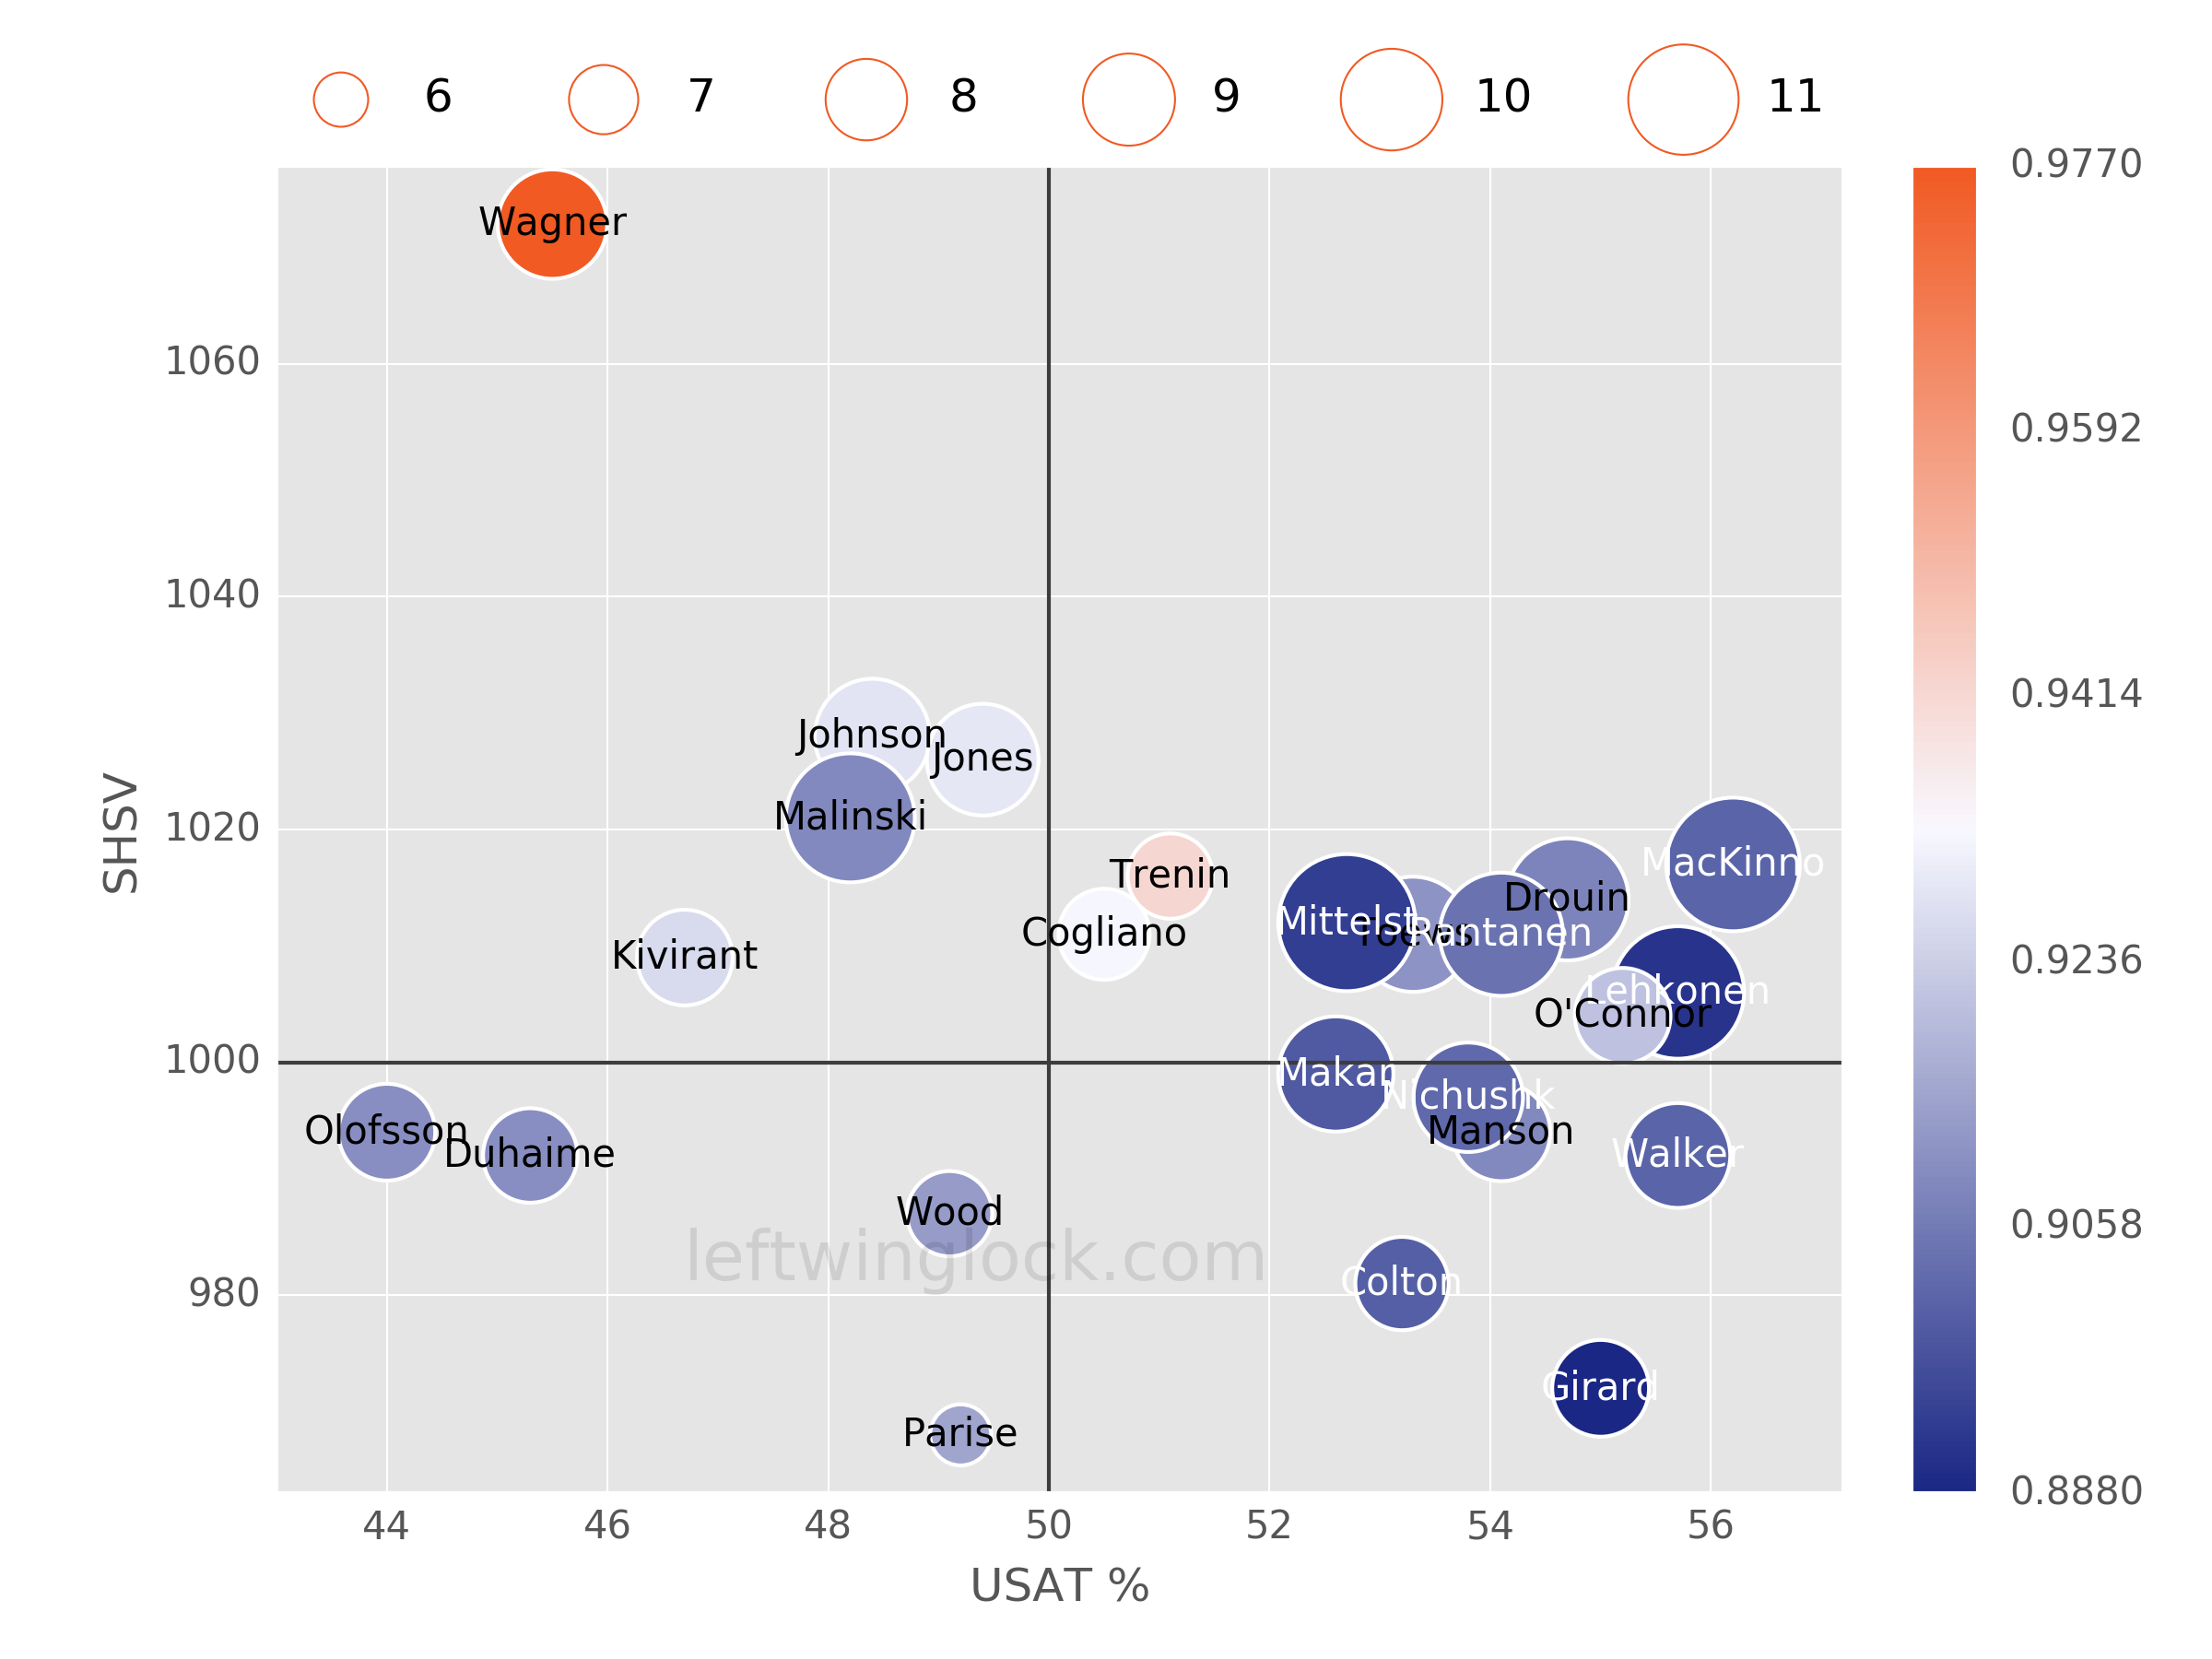
Player Usage Chart / Possession and Luck Chart