CHRIS TIERNEY
Explore projections, stats, news, player usage charts, and line combinations for members of the New Jersey Devils
-
Center Leaders
2023 - 2024
Name G A Pts Nathan
MacKinnon51 89 140 Connor McDavid 32 100 132 Auston Matthews 69 38 107 Leon Draisaitl 41 65 106 J.T. Miller 37 66 103 Sam Reinhart 57 37 94 Sidney Crosby 42 52 94 Brayden Point 46 44 90 Sebastian Aho 36 53 89 Elias Pettersson 34 55 89 Robert Thomas 26 60 86 Steven Stamkos 40 41 81 -
Player Card

CHRIS TIERNEY
New Jersey Devils2023 - 2024- G 4
- A 8
- PTS 12
- +/- 3
- PIM 21
- PPP 0
- SH% 15.4
- L 20%
- C 80%
- R 0%
-
New Jersey Devils Leaders
2023 - 2024
Name G A Pts Jesper
Bratt27 56 83 Jack Hughes 27 47 74 Nico Hischier 27 40 67 Timo Meier 28 24 52 Luke Hughes 9 38 47 Erik Haula 16 19 35 Dawson Mercer 20 13 33 Ondrej Palat 11 20 31 Alexander Holtz 16 12 28 Curtis Lazar 7 18 25 John Marino 4 21 25 Michael McLeod 10 9 19
News
-
Chris Tierney
Is expected to be in the lineup for today's game.
Feb 24, 2024 - 1:43 pm -
Chris Tierney
Is not expected to be in the lineup for today's game.
Nov 16, 2023 - 6:39 pm -
Chris Tierney
Has signed a one-year contract with the New Jersey Devils.
Jul 14, 2023 - 10:17 am -
Chris Tierney
Is not expected to be in the lineup for today's game.
Mar 28, 2023 - 5:16 pm
Feature
-
Trending
No articles available
Replies 0
Basic Stats
| Season | Team | GP | G | A | P | +/- | PIM | S | S/GP | SH% | PPP | H | BS | FW | FO% | TOI | EVTOI | PPTOI | PKTOI |
|---|---|---|---|---|---|---|---|---|---|---|---|---|---|---|---|---|---|---|---|
| 23-24 | NJD | 52 | 4 | 8 | 12 | 3 | 21 | 26 | 0.5 | 15.4 | 0 | 20 | 12 | 111 | 57.2 | 9.03 | 8.31 | 0.03 | 0.68 |
| 22-23 | MTL | 36 | 3 | 7 | 10 | -8 | 6 | 19 | 0.5 | 15.8 | 0 | 15 | 21 | 111 | 47.0 | 10.86 | 9.54 | 0.11 | 1.21 |
| 21-22 | OTT | 70 | 6 | 12 | 18 | -12 | 14 | 72 | 1 | 8.3 | 5 | 42 | 30 | 264 | 49.7 | 12.41 | 10.85 | 1.36 | 0.21 |
| 20-21 | OTT | 55 | 6 | 13 | 19 | -12 | 8 | 53 | 1 | 11.3 | 0 | 23 | 32 | 269 | 45.6 | 14.99 | 12.85 | 0.13 | 2.01 |
| 19-20 | OTT | 71 | 11 | 26 | 37 | -6 | 20 | 102 | 1.4 | 10.8 | 2 | 44 | 37 | 521 | 51.2 | 17.19 | 13.92 | 0.94 | 2.32 |
Enhanced Stats (5-on-5 unless denoted with *)
| Season | G/60 | A/60 | P/60 | IPP | ΔPEN/60 | 1A | 2A | EVS/60* | PPS/60* | SATF | SAT% | tEVSH% | tEVSV% | SHSV | ZS% |
|---|---|---|---|---|---|---|---|---|---|---|---|---|---|---|---|
| 23-24 | 0.42 | 1.12 | 1.55 | 65 | -0.26 | 3 | 5 | 3.0 | 0.0 | 320 | 45.2 | 11.0 | 0.909 | 1019 | 47.3 |
| 22-23 | 0.53 | 1.06 | 1.59 | 55 | -0.31 | 3 | 3 | 3.4 | 0.0 | 253 | 41.5 | 11.0 | 0.868 | 978 | 45.6 |
| 21-22 | 0.24 | 0.80 | 1.04 | 59 | -0.28 | 1 | 9 | 4.6 | 6.9 | 661 | 47.5 | 6.1 | 0.921 | 982 | 39.1 |
| 20-21 | 0.35 | 0.96 | 1.31 | 63 | 0.07 | 7 | 4 | 3.8 | 0.0 | 603 | 48.3 | 8.1 | 0.890 | 971 | 33.5 |
| 19-20 | 0.38 | 1.21 | 1.60 | 70 | 0.20 | 12 | 7 | 5.1 | 6.3 | 851 | 47.7 | 8.4 | 0.906 | 990 | 41.9 |
Regression Meter
This meter measures whether or not a player's point production is being influenced by luck. Orange indicates the player has been lucky. Dark grey indicates the player has been unlucky.
2A/60
tEVSH%
SH%
IPP
PPSH%
Positional Data
| Season | Team | Left | Center | Right |
|---|---|---|---|---|
| 23-24 | NJD | 20 | 80 | 0 |
| 22-23 | MTL | 0 | 100 | 0 |
| 21-22 | OTT | 21 | 79 | 0 |
| 20-21 | OTT | 2 | 98 | 0 |
| 19-20 | OTT | 0 | 100 | 0 |
Most Common Linemates and Line Production
See also: New Jersey Devils Line Combo Tool | Line Production Tool
| Team | F1 | F2 | F3 | GF | GA | GF% | SATF | SATA | SAT% | USATF | USATA | USAT% | SH% | SV% | SHSV | ZS% |
|---|---|---|---|---|---|---|---|---|---|---|---|---|---|---|---|---|
| NJD | BASTIAN | TIERNEY | HOLTZ | 1 | 3 | 25.0 | 29 | 33 | 46.8 | 18 | 22 | 45.0 | 7.7 | 0.750 | 827 | 50.0 |
| NJD | HOLTZ | TIERNEY | WILLMAN | 1 | 2 | 33.3 | 28 | 44 | 38.9 | 23 | 29 | 44.2 | 5.0 | 0.900 | 950 | 28.6 |
| NJD | HOLTZ | TIERNEY | LAZAR | 1 | 2 | 33.3 | 23 | 29 | 44.2 | 17 | 25 | 40.5 | 9.1 | 0.846 | 937 | 50.0 |
Most Recent 10 Games
| OPP | G | A | P | +/- | PIM | SOG | SH% | H | BS | FW | FL | FO% | TOI | EVTOI | PPTOI | PKTOI | ID |
|---|---|---|---|---|---|---|---|---|---|---|---|---|---|---|---|---|---|
| NYI | 0 | 0 | 0 | 0 | 2 | 0 | 0 | 0 | 1 | 4 | 0 | 100 | 07:36 | 07:27 | 00:09 | 00:00 | 21288 |
| PHI | 0 | 0 | 0 | 0 | 0 | 0 | 0 | 1 | 0 | 4 | 2 | 67 | 10:36 | 09:47 | 00:00 | 00:49 | 21274 |
| TOR | 0 | 0 | 0 | 0 | 0 | 1 | 0 | 0 | 1 | 2 | 5 | 29 | 11:49 | 11:31 | 00:00 | 00:18 | 21260 |
| TOR | 0 | 0 | 0 | 0 | 2 | 1 | 0 | 0 | 0 | 6 | 1 | 86 | 07:53 | 07:53 | 00:00 | 00:00 | 21243 |
| NSH | 1 | 0 | 1 | 1 | 0 | 1 | 100 | 1 | 0 | 3 | 5 | 38 | 08:04 | 08:04 | 00:00 | 00:00 | 21233 |
| OTT | 0 | 0 | 0 | -1 | 0 | 0 | 0 | 0 | 1 | 4 | 0 | 100 | 08:44 | 08:44 | 00:00 | 00:00 | 21224 |
| NYR | 0 | 0 | 0 | 0 | 15 | 0 | 0 | 0 | 0 | 1 | 0 | 100 | 00:02 | 00:02 | 00:00 | 00:00 | 21198 |
| PIT | 0 | 0 | 0 | 0 | 0 | 0 | 0 | 1 | 0 | 1 | 1 | 50 | 08:43 | 08:37 | 00:00 | 00:06 | 21191 |
| BUF | 0 | 1 | 1 | 1 | 0 | 0 | 0 | 1 | 0 | 1 | 1 | 50 | 07:48 | 07:48 | 00:00 | 00:00 | 21164 |
| TOR | 0 | 1 | 1 | 0 | 0 | 0 | 0 | 0 | 0 | 0 | 2 | 0 | 05:46 | 05:46 | 00:00 | 00:00 | 21139 |
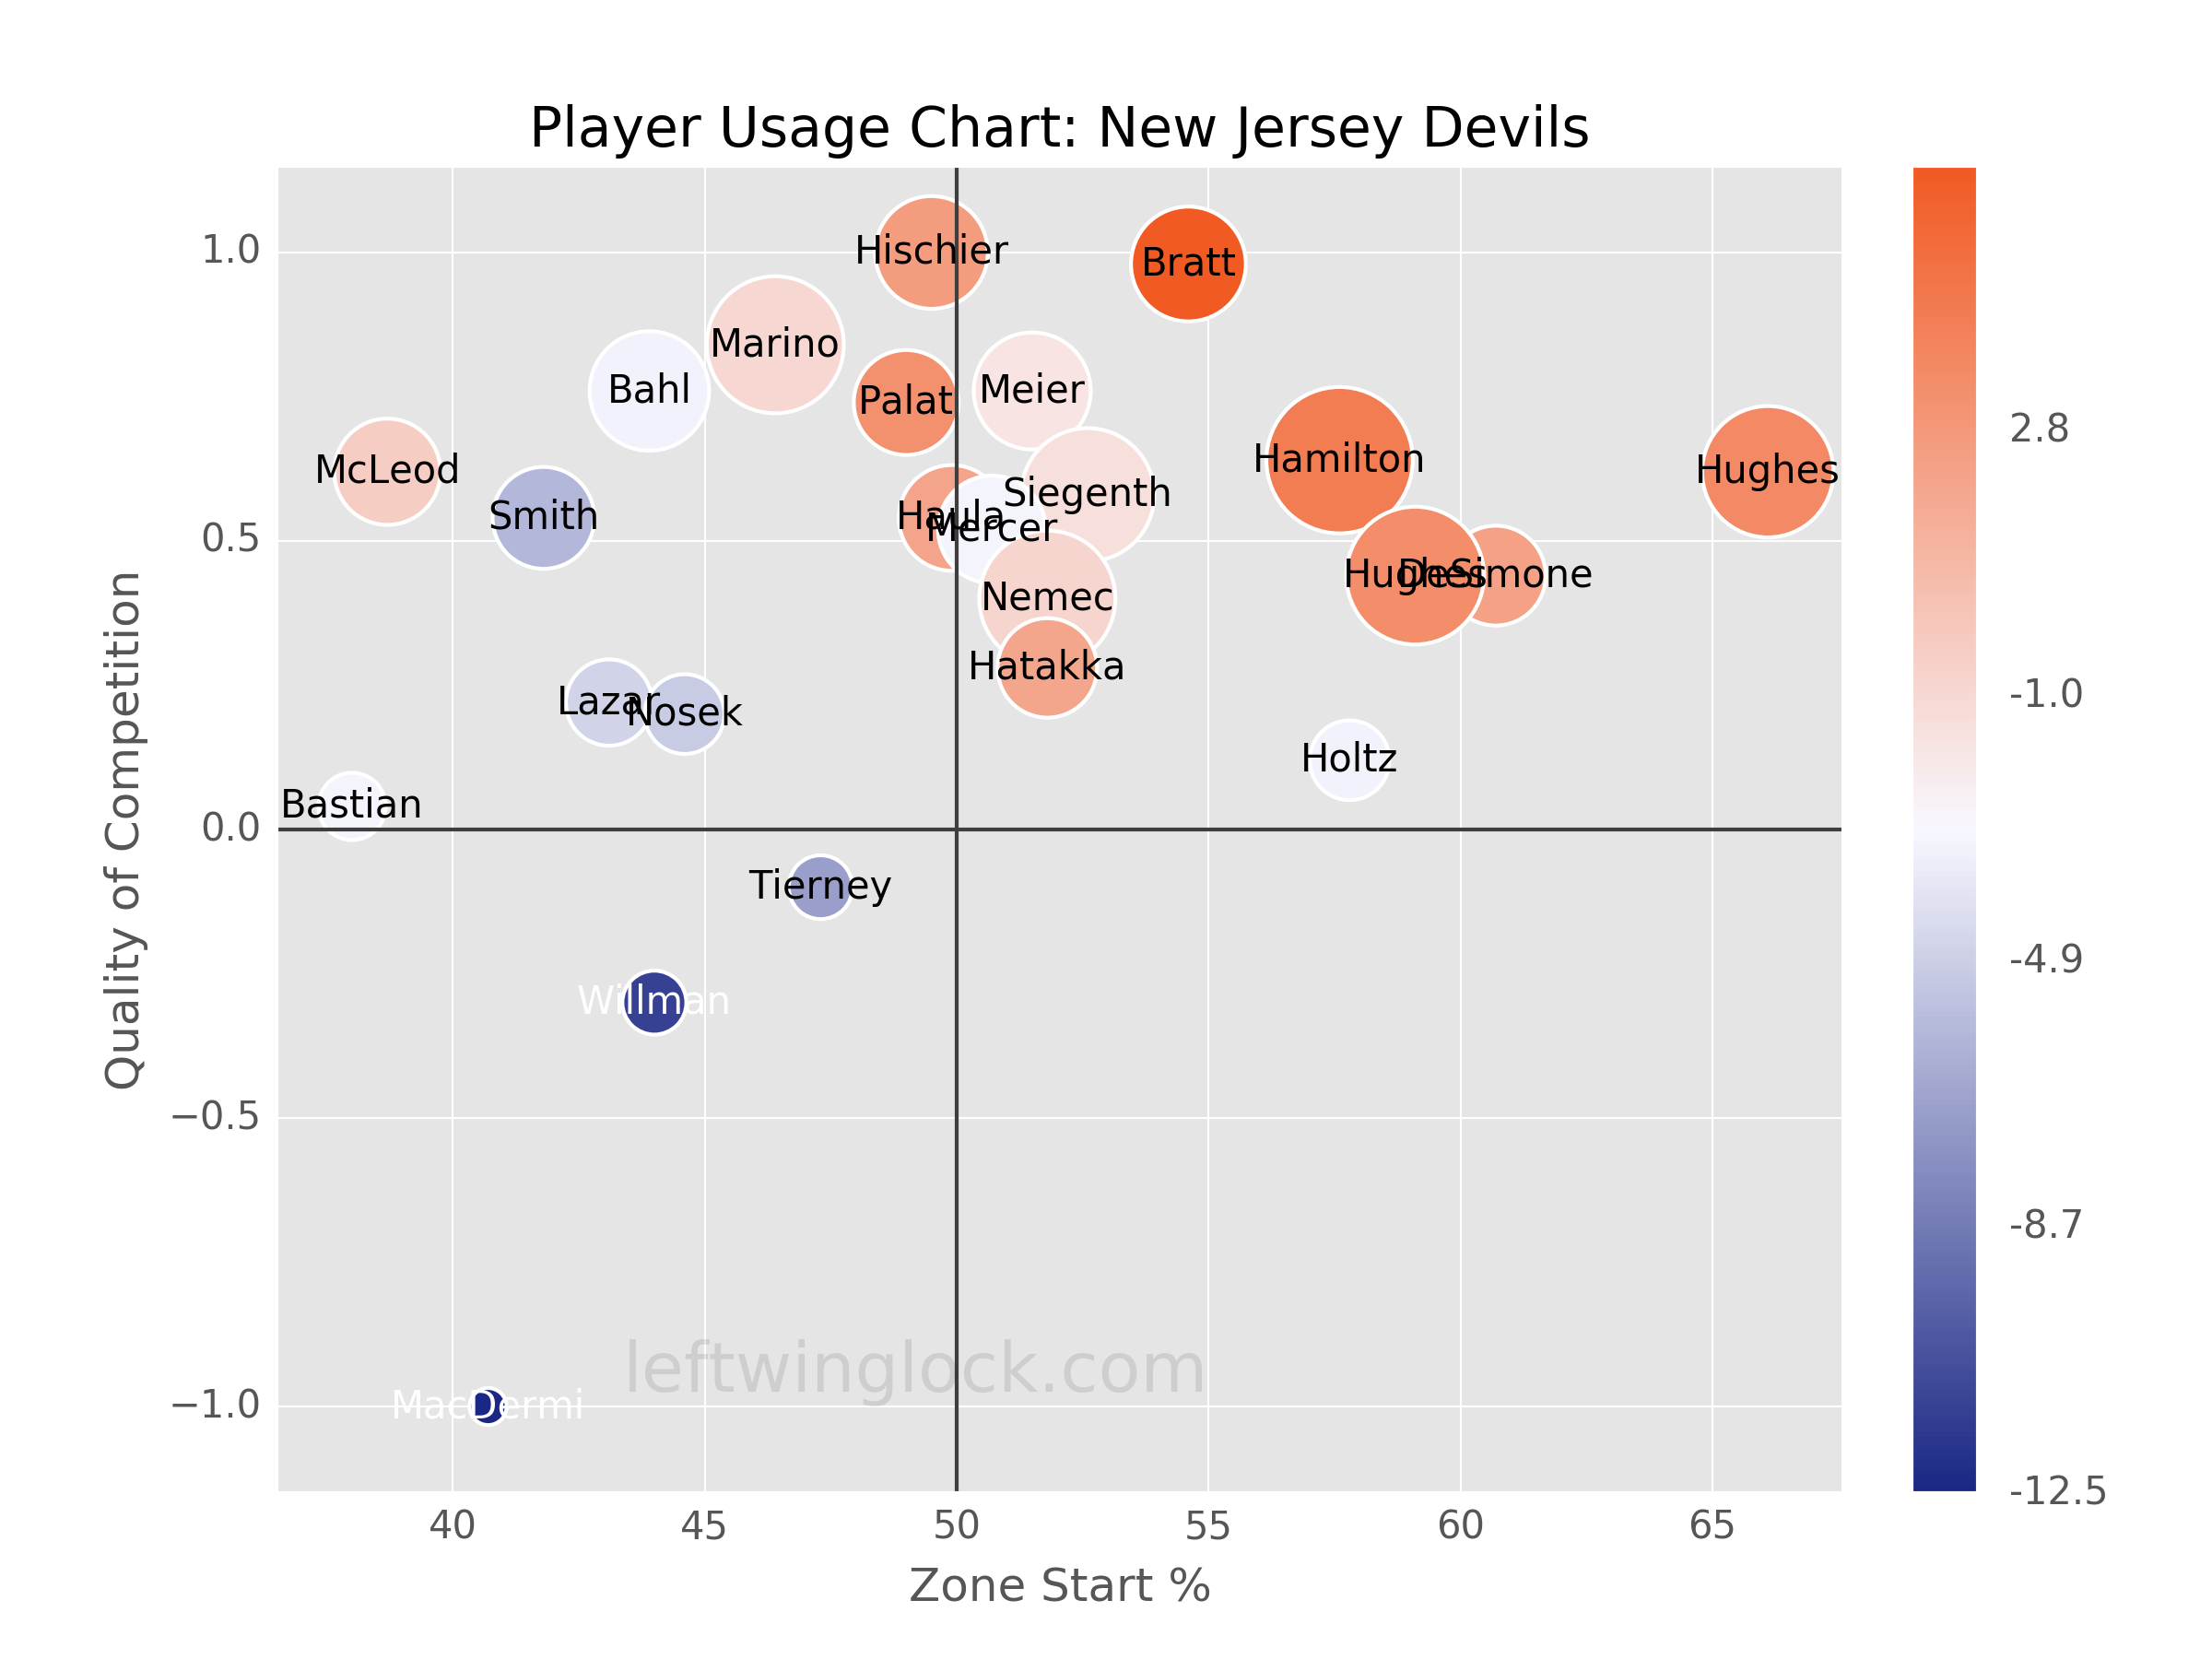
Player Usage Chart / Possession and Luck Chart