CHRIS TIERNEY
Explore projections, stats, news, player usage charts, and line combinations for members of the New Jersey Devils
-
Center Leaders
2023 - 2024
Name PPG PPA PPP Nathan
MacKinnon10 37 47 Connor McDavid 7 37 44 J.T. Miller 10 30 40 Leon Draisaitl 21 18 39 Steven Stamkos 19 20 39 Sam Reinhart 27 7 34 Sebastian Aho 11 21 32 Brayden Point 14 17 31 Elias Pettersson 13 18 31 Mika Zibanejad 12 19 31 Nick Suzuki 12 19 31 Jack Hughes 9 22 31 -
Player Card

CHRIS TIERNEY
New Jersey Devils2023 - 2024- G 4
- A 8
- PTS 12
- +/- 3
- PIM 21
- PPP 0
- SH% 15.4
- L 20%
- C 80%
- R 0%
-
New Jersey Devils Leaders
2023 - 2024
Name G A Pts Jesper
Bratt27 56 83 Jack Hughes 27 47 74 Nico Hischier 27 40 67 Timo Meier 28 24 52 Luke Hughes 9 38 47 Erik Haula 16 19 35 Dawson Mercer 20 13 33 Ondrej Palat 11 20 31 Alexander Holtz 16 12 28 Curtis Lazar 7 18 25 John Marino 4 21 25 Michael McLeod 10 9 19
News
-
Chris Tierney
Is expected to be in the lineup for today's game.
Feb 24, 2024 - 1:43 pm -
Chris Tierney
Is not expected to be in the lineup for today's game.
Nov 16, 2023 - 6:39 pm -
Chris Tierney
Has signed a one-year contract with the New Jersey Devils.
Jul 14, 2023 - 10:17 am -
Chris Tierney
Is not expected to be in the lineup for today's game.
Mar 28, 2023 - 5:16 pm
Feature
-
Trending
No articles available
Replies 0
Basic Stats
| Season | Team | GP | G | A | P | +/- | PIM | S | S/GP | SH% | PPP | H | BS | FW | FO% | TOI | EVTOI | PPTOI | PKTOI |
|---|---|---|---|---|---|---|---|---|---|---|---|---|---|---|---|---|---|---|---|
| 23-24 | NJD | 52 | 4 | 8 | 12 | 3 | 21 | 26 | 0.5 | 15.4 | 0 | 20 | 12 | 111 | 57.2 | 9.03 | 8.31 | 0.03 | 0.68 |
| 22-23 | MTL | 36 | 3 | 7 | 10 | -8 | 6 | 19 | 0.5 | 15.8 | 0 | 15 | 21 | 111 | 47.0 | 10.86 | 9.54 | 0.11 | 1.21 |
| 21-22 | OTT | 70 | 6 | 12 | 18 | -12 | 14 | 72 | 1 | 8.3 | 5 | 42 | 30 | 264 | 49.7 | 12.41 | 10.85 | 1.36 | 0.21 |
| 20-21 | OTT | 55 | 6 | 13 | 19 | -12 | 8 | 53 | 1 | 11.3 | 0 | 23 | 32 | 269 | 45.6 | 14.99 | 12.85 | 0.13 | 2.01 |
| 19-20 | OTT | 71 | 11 | 26 | 37 | -6 | 20 | 102 | 1.4 | 10.8 | 2 | 44 | 37 | 521 | 51.2 | 17.19 | 13.92 | 0.94 | 2.32 |
Enhanced Stats (5-on-5 unless denoted with *)
| Season | G/60 | A/60 | P/60 | IPP | ΔPEN/60 | 1A | 2A | EVS/60* | PPS/60* | SATF | SAT% | tEVSH% | tEVSV% | SHSV | ZS% |
|---|---|---|---|---|---|---|---|---|---|---|---|---|---|---|---|
| 23-24 | 0.42 | 1.12 | 1.55 | 65 | -0.26 | 3 | 5 | 3.0 | 0.0 | 320 | 45.2 | 11.0 | 0.909 | 1019 | 47.3 |
| 22-23 | 0.53 | 1.06 | 1.59 | 55 | -0.31 | 3 | 3 | 3.4 | 0.0 | 253 | 41.5 | 11.0 | 0.868 | 978 | 45.6 |
| 21-22 | 0.24 | 0.80 | 1.04 | 59 | -0.28 | 1 | 9 | 4.6 | 6.9 | 661 | 47.5 | 6.1 | 0.921 | 982 | 39.1 |
| 20-21 | 0.35 | 0.96 | 1.31 | 63 | 0.07 | 7 | 4 | 3.8 | 0.0 | 603 | 48.3 | 8.1 | 0.890 | 971 | 33.5 |
| 19-20 | 0.38 | 1.21 | 1.60 | 70 | 0.20 | 12 | 7 | 5.1 | 6.3 | 851 | 47.7 | 8.4 | 0.906 | 990 | 41.9 |
Regression Meter
This meter measures whether or not a player's point production is being influenced by luck. Orange indicates the player has been lucky. Dark grey indicates the player has been unlucky.
2A/60
tEVSH%
SH%
IPP
PPSH%
Positional Data
| Season | Team | Left | Center | Right |
|---|---|---|---|---|
| 23-24 | NJD | 20 | 80 | 0 |
| 22-23 | MTL | 0 | 100 | 0 |
| 21-22 | OTT | 21 | 79 | 0 |
| 20-21 | OTT | 2 | 98 | 0 |
| 19-20 | OTT | 0 | 100 | 0 |
Most Common Linemates and Line Production
See also: New Jersey Devils Line Combo Tool | Line Production Tool
| Team | F1 | F2 | F3 | GF | GA | GF% | SATF | SATA | SAT% | USATF | USATA | USAT% | SH% | SV% | SHSV | ZS% |
|---|---|---|---|---|---|---|---|---|---|---|---|---|---|---|---|---|
| NJD | BASTIAN | TIERNEY | HOLTZ | 1 | 3 | 25.0 | 29 | 33 | 46.8 | 18 | 22 | 45.0 | 7.7 | 0.750 | 827 | 50.0 |
| NJD | HOLTZ | TIERNEY | WILLMAN | 1 | 2 | 33.3 | 28 | 44 | 38.9 | 23 | 29 | 44.2 | 5.0 | 0.900 | 950 | 28.6 |
| NJD | HOLTZ | TIERNEY | LAZAR | 1 | 2 | 33.3 | 23 | 29 | 44.2 | 17 | 25 | 40.5 | 9.1 | 0.846 | 937 | 50.0 |
Most Recent 10 Games
| OPP | G | A | P | +/- | PIM | SOG | SH% | H | BS | FW | FL | FO% | TOI | EVTOI | PPTOI | PKTOI | ID |
|---|---|---|---|---|---|---|---|---|---|---|---|---|---|---|---|---|---|
| NYI | 0 | 0 | 0 | 0 | 2 | 0 | 0 | 0 | 1 | 4 | 0 | 100 | 07:36 | 07:27 | 00:09 | 00:00 | 21288 |
| PHI | 0 | 0 | 0 | 0 | 0 | 0 | 0 | 1 | 0 | 4 | 2 | 67 | 10:36 | 09:47 | 00:00 | 00:49 | 21274 |
| TOR | 0 | 0 | 0 | 0 | 0 | 1 | 0 | 0 | 1 | 2 | 5 | 29 | 11:49 | 11:31 | 00:00 | 00:18 | 21260 |
| TOR | 0 | 0 | 0 | 0 | 2 | 1 | 0 | 0 | 0 | 6 | 1 | 86 | 07:53 | 07:53 | 00:00 | 00:00 | 21243 |
| NSH | 1 | 0 | 1 | 1 | 0 | 1 | 100 | 1 | 0 | 3 | 5 | 38 | 08:04 | 08:04 | 00:00 | 00:00 | 21233 |
| OTT | 0 | 0 | 0 | -1 | 0 | 0 | 0 | 0 | 1 | 4 | 0 | 100 | 08:44 | 08:44 | 00:00 | 00:00 | 21224 |
| NYR | 0 | 0 | 0 | 0 | 15 | 0 | 0 | 0 | 0 | 1 | 0 | 100 | 00:02 | 00:02 | 00:00 | 00:00 | 21198 |
| PIT | 0 | 0 | 0 | 0 | 0 | 0 | 0 | 1 | 0 | 1 | 1 | 50 | 08:43 | 08:37 | 00:00 | 00:06 | 21191 |
| BUF | 0 | 1 | 1 | 1 | 0 | 0 | 0 | 1 | 0 | 1 | 1 | 50 | 07:48 | 07:48 | 00:00 | 00:00 | 21164 |
| TOR | 0 | 1 | 1 | 0 | 0 | 0 | 0 | 0 | 0 | 0 | 2 | 0 | 05:46 | 05:46 | 00:00 | 00:00 | 21139 |
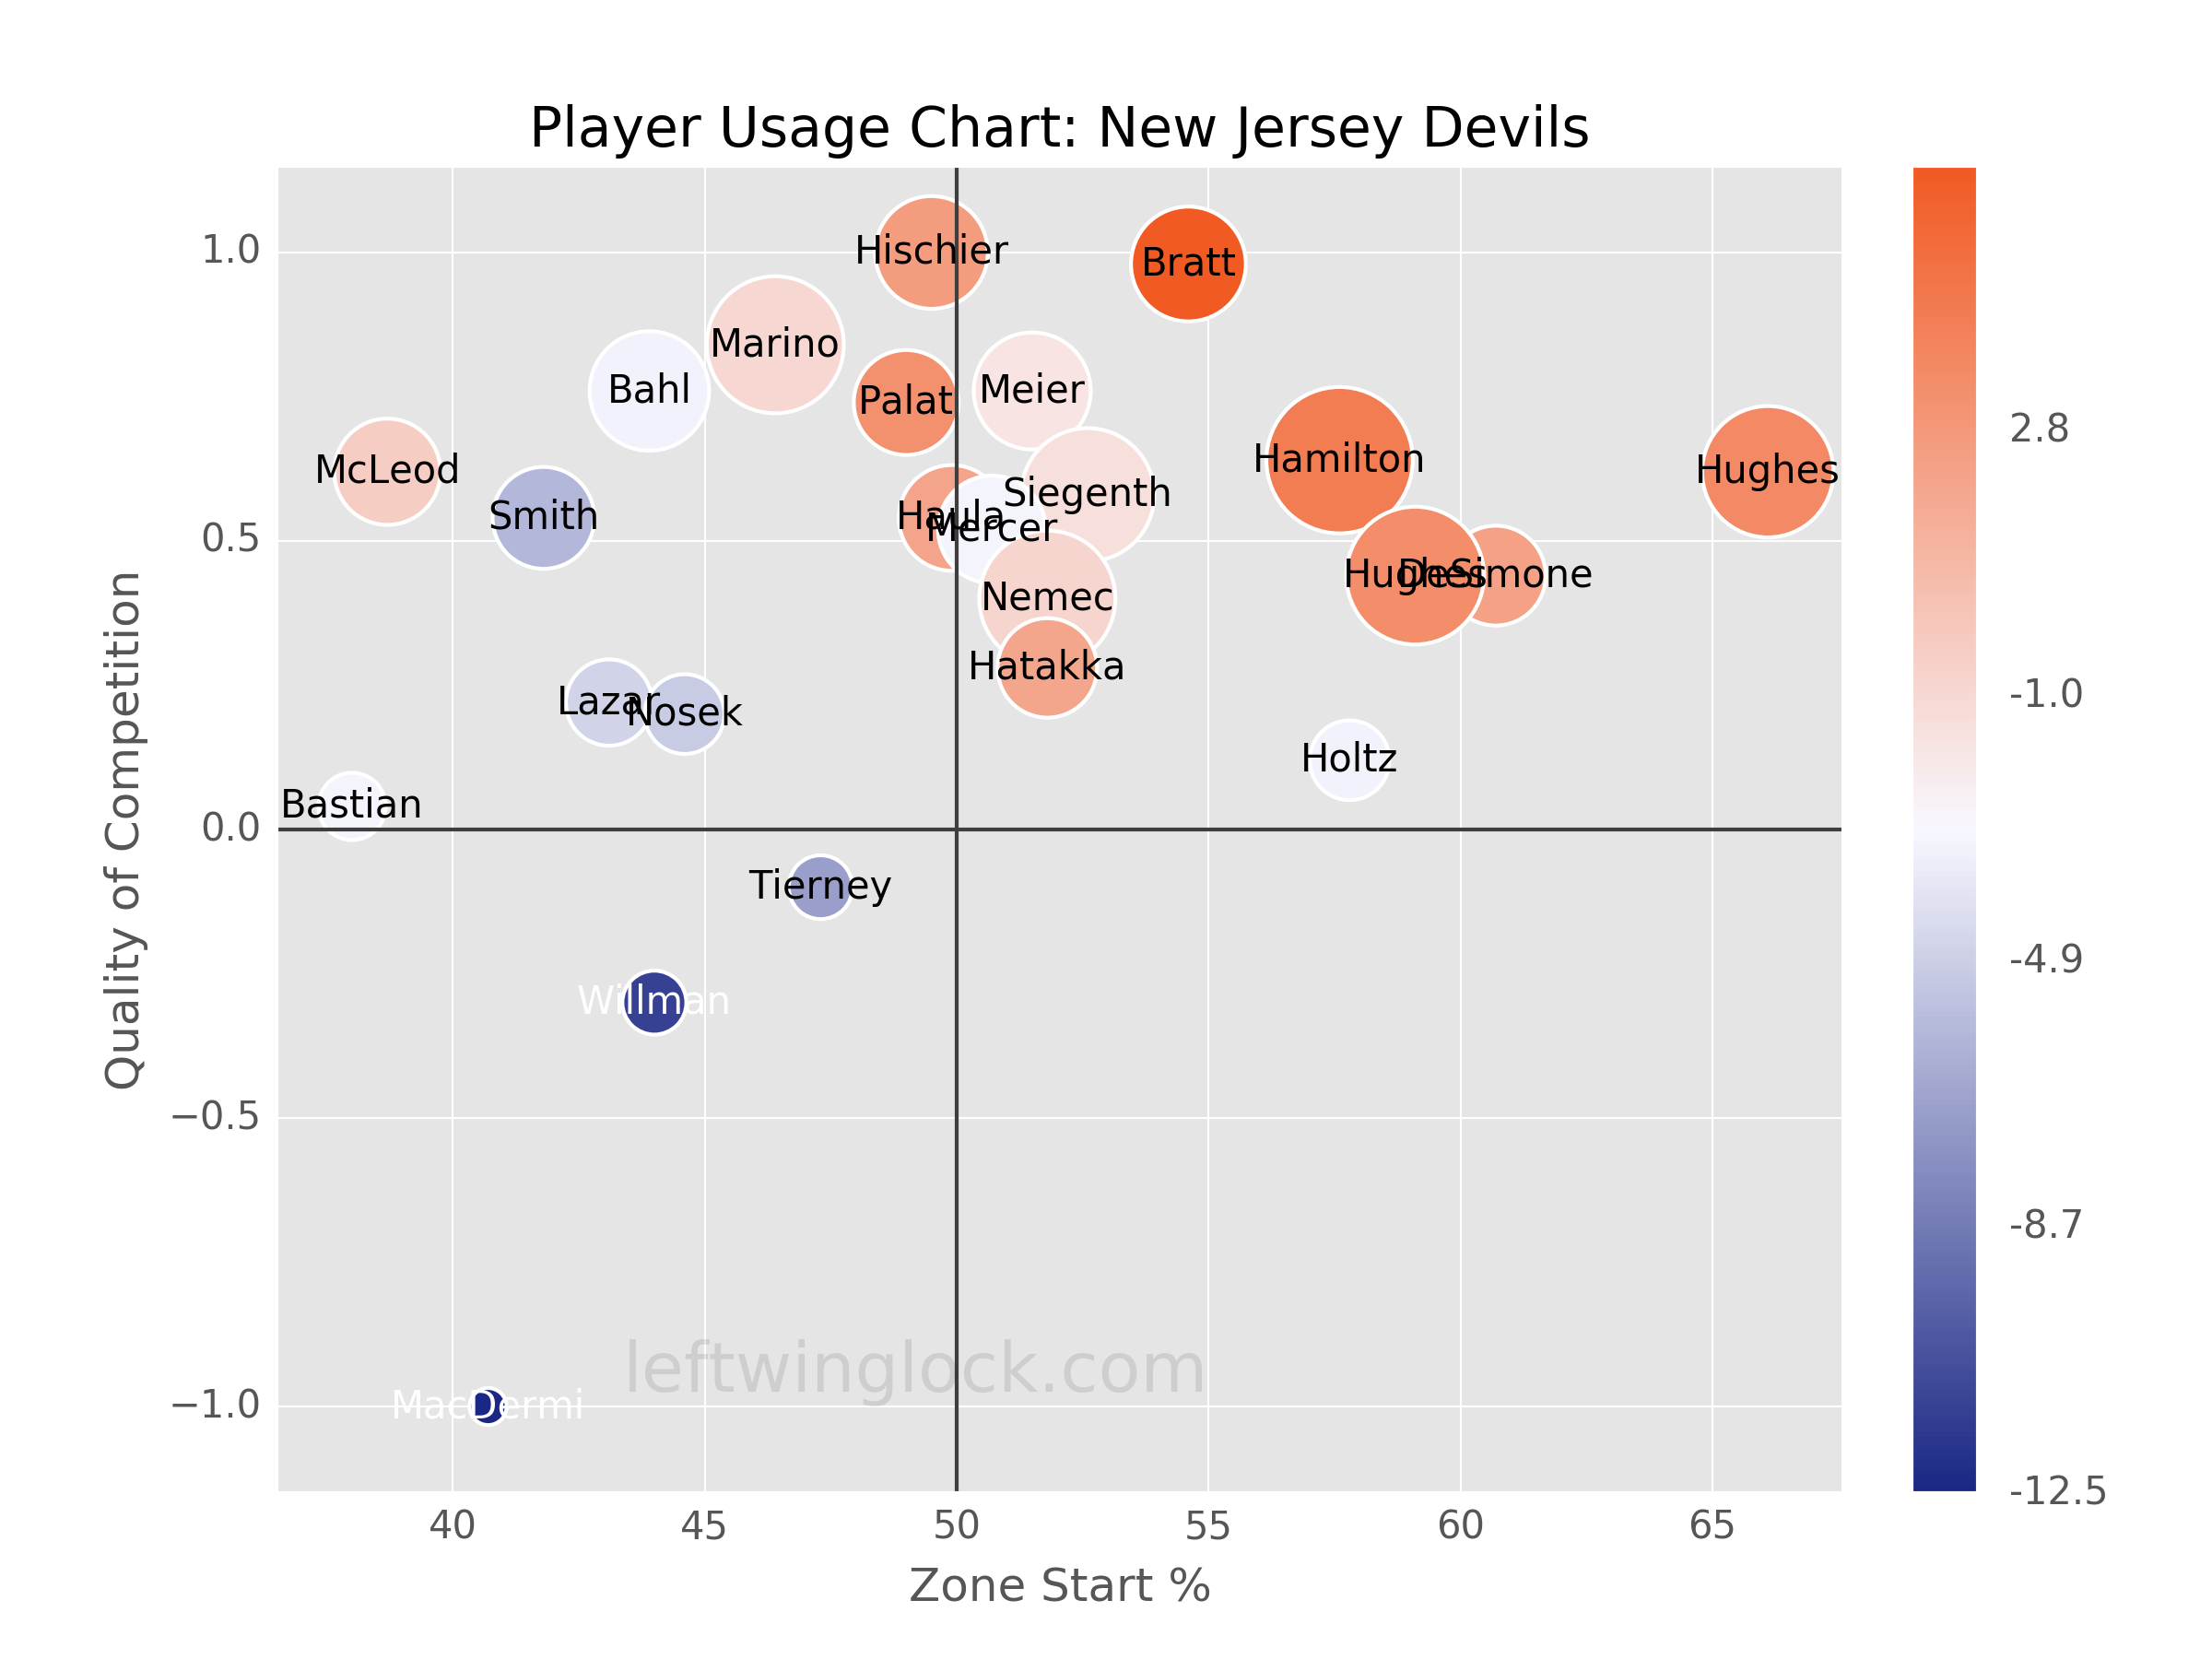
Player Usage Chart / Possession and Luck Chart