FILIP FORSBERG
Explore projections, stats, news, player usage charts, and line combinations for members of the Nashville Predators
-
Left Wing Leaders
2023 - 2024
Name G A Pts Artemi
Panarin49 71 120 Kirill Kaprizov 45 50 95 Filip Forsberg 48 46 94 Matthew Tkachuk 26 62 88 Jesper Bratt 27 56 83 Jason Robertson 29 51 80 Zach Hyman 54 23 77 Chris Kreider 39 36 75 Brandon Hagel 26 49 75 Brady Tkachuk 37 37 74 Kevin Fiala 29 44 73 Lucas Raymond 31 41 72 -
Player Card

FILIP FORSBERG
Nashville Predators2023 - 2024- G 48
- A 46
- PTS 94
- +/- 16
- PIM 43
- PPP 32
- SH% 13.8
- L 100%
- C 0%
- R 0%
-
Nashville Predators Leaders
2023 - 2024
Name PPG PPA PPP Roman
Josi9 24 33 Filip Forsberg 13 19 32 Ryan O'Reilly 14 14 28 Gustav Nyquist 5 19 24 Tommy Novak 6 6 12 Jason Zucker 5 5 10 Luke Evangelista 3 7 10 Colton Sissons 3 4 7 Tyson Barrie 0 6 6 Anthony Beauvillier 2 2 4 Philip Tomasino 0 4 4 Ryan McDonagh 0 4 4
News
-
Filip Forsberg
Is expected to be in the lineup for today's game.
Feb 27, 2024 - 12:20 pm -
Filip Forsberg
Is not on the ice for the morning skate.
Feb 27, 2024 - 11:38 am -
Filip Forsberg
Is not expected to be in the lineup for today's game.
Mar 14, 2023 - 12:46 pm -
Filip Forsberg
Was on the ice for the morning skate in a no-contact jersey.
Feb 28, 2023 - 12:53 pm
Feature
-
Trending
Players to Trade in the Coming Week
Replies 1
Basic Stats
| Season | Team | GP | G | A | P | +/- | PIM | S | S/GP | SH% | PPP | H | BS | FW | FO% | TOI | EVTOI | PPTOI | PKTOI |
|---|---|---|---|---|---|---|---|---|---|---|---|---|---|---|---|---|---|---|---|
| 23-24 | NSH | 82 | 48 | 46 | 94 | 16 | 43 | 347 | 4.2 | 13.8 | 32 | 141 | 44 | 11 | 50.0 | 18.91 | 15.35 | 3.55 | 0.01 |
| 22-23 | NSH | 50 | 19 | 23 | 42 | -4 | 20 | 157 | 3.1 | 12.1 | 13 | 86 | 20 | 0 | 0.0 | 17.47 | 14.35 | 3.10 | 0.02 |
| 21-22 | NSH | 69 | 42 | 42 | 84 | 12 | 22 | 226 | 3.3 | 18.6 | 27 | 112 | 48 | 1 | 100.0 | 18.10 | 14.92 | 3.15 | 0.03 |
| 20-21 | NSH | 39 | 12 | 20 | 32 | -9 | 16 | 129 | 3.3 | 9.3 | 13 | 47 | 14 | 3 | 37.5 | 18.29 | 15.34 | 2.94 | 0.01 |
| 19-20 | NSH | 63 | 21 | 27 | 48 | -7 | 29 | 198 | 3.1 | 10.6 | 14 | 82 | 27 | 1 | 33.3 | 17.35 | 14.09 | 2.86 | 0.39 |
Enhanced Stats (5-on-5 unless denoted with *)
| Season | G/60 | A/60 | P/60 | IPP | ΔPEN/60 | 1A | 2A | EVS/60* | PPS/60* | SATF | SAT% | tEVSH% | tEVSV% | SHSV | ZS% |
|---|---|---|---|---|---|---|---|---|---|---|---|---|---|---|---|
| 23-24 | 1.40 | 1.04 | 2.44 | 75 | 0.39 | 12 | 8 | 11.9 | 19.6 | 1313 | 53.2 | 9.6 | 0.918 | 1014 | 61.0 |
| 22-23 | 1.29 | 1.11 | 2.40 | 73 | 0.55 | 8 | 4 | 9.6 | 15.5 | 650 | 49.5 | 10.7 | 0.905 | 1012 | 58.7 |
| 21-22 | 1.67 | 1.22 | 2.88 | 80 | 0.62 | 12 | 7 | 9.7 | 15.2 | 934 | 52.6 | 11.7 | 0.909 | 1026 | 60.8 |
| 20-21 | 0.88 | 0.77 | 1.65 | 89 | 0.00 | 3 | 4 | 9.8 | 16.2 | 550 | 52.8 | 5.6 | 0.919 | 975 | 60.7 |
| 19-20 | 0.93 | 1.36 | 2.29 | 74 | -0.16 | 13 | 6 | 9.3 | 18.3 | 865 | 52.7 | 8.5 | 0.914 | 999 | 61.5 |
Regression Meter
This meter measures whether or not a player's point production is being influenced by luck. Orange indicates the player has been lucky. Dark grey indicates the player has been unlucky.
2A/60
tEVSH%
SH%
IPP
PPSH%
Positional Data
| Season | Team | Left | Center | Right |
|---|---|---|---|---|
| 23-24 | NSH | 100 | 0 | 0 |
| 22-23 | NSH | 100 | 0 | 0 |
| 21-22 | NSH | 100 | 0 | 0 |
| 20-21 | NSH | 100 | 0 | 0 |
| 19-20 | NSH | 100 | 0 | 0 |
Most Common Linemates and Line Production
See also: Nashville Predators Line Combo Tool | Line Production Tool
| Team | F1 | F2 | F3 | GF | GA | GF% | SATF | SATA | SAT% | USATF | USATA | USAT% | SH% | SV% | SHSV | ZS% |
|---|---|---|---|---|---|---|---|---|---|---|---|---|---|---|---|---|
| NSH | FORSBERG | NYQUIST | OREILLY | 46 | 31 | 59.7 | 930 | 799 | 53.8 | 663 | 570 | 53.8 | 10.0 | 0.923 | 1023 | 65.8 |
| NSH | FORSBERG | PARSSINEN | OREILLY | 4 | 5 | 44.4 | 69 | 64 | 51.9 | 52 | 41 | 55.9 | 10.0 | 0.800 | 900 | 54.5 |
| NSH | FORSBERG | NYQUIST | NOVAK | 3 | 0 | 100.0 | 39 | 18 | 68.4 | 29 | 16 | 64.4 | 12.5 | 1.000 | 1125 | 75.0 |
Most Recent 10 Games
| OPP | G | A | P | +/- | PIM | SOG | SH% | H | BS | FW | FL | FO% | TOI | EVTOI | PPTOI | PKTOI | ID |
|---|---|---|---|---|---|---|---|---|---|---|---|---|---|---|---|---|---|
| PIT | 1 | 0 | 1 | 1 | 0 | 3 | 33.3 | 3 | 2 | 0 | 0 | 0 | 19:25 | 17:49 | 01:36 | 00:00 | 21289 |
| CBJ | 1 | 0 | 1 | -1 | 0 | 6 | 16.7 | 0 | 0 | 0 | 0 | 0 | 15:42 | 14:38 | 01:01 | 00:03 | 21278 |
| CHI | 3 | 0 | 3 | 1 | 0 | 7 | 42.9 | 0 | 1 | 0 | 0 | 0 | 14:50 | 12:11 | 02:34 | 00:05 | 21266 |
| WPG | 0 | 0 | 0 | 0 | 0 | 4 | 0 | 2 | 0 | 0 | 0 | 0 | 23:26 | 17:38 | 05:48 | 00:00 | 21247 |
| NJD | 0 | 2 | 2 | 0 | 0 | 4 | 0 | 0 | 1 | 0 | 1 | 0 | 21:03 | 17:32 | 03:31 | 00:00 | 21233 |
| NYI | 0 | 0 | 0 | -1 | 0 | 10 | 0 | 0 | 0 | 0 | 0 | 0 | 20:46 | 16:34 | 04:12 | 00:00 | 21225 |
| STL | 2 | 1 | 3 | 0 | 2 | 4 | 50 | 2 | 2 | 0 | 0 | 0 | 20:54 | 18:05 | 02:49 | 00:00 | 21208 |
| BOS | 0 | 0 | 0 | -1 | 0 | 5 | 0 | 1 | 0 | 0 | 0 | 0 | 18:47 | 14:16 | 04:31 | 00:00 | 21194 |
| COL | 0 | 1 | 1 | -1 | 0 | 6 | 0 | 1 | 1 | 0 | 0 | 0 | 19:27 | 14:13 | 05:14 | 00:00 | 21169 |
| ARI | 1 | 1 | 2 | -4 | 0 | 2 | 50 | 3 | 0 | 0 | 0 | 0 | 18:06 | 16:13 | 01:53 | 00:00 | 21161 |
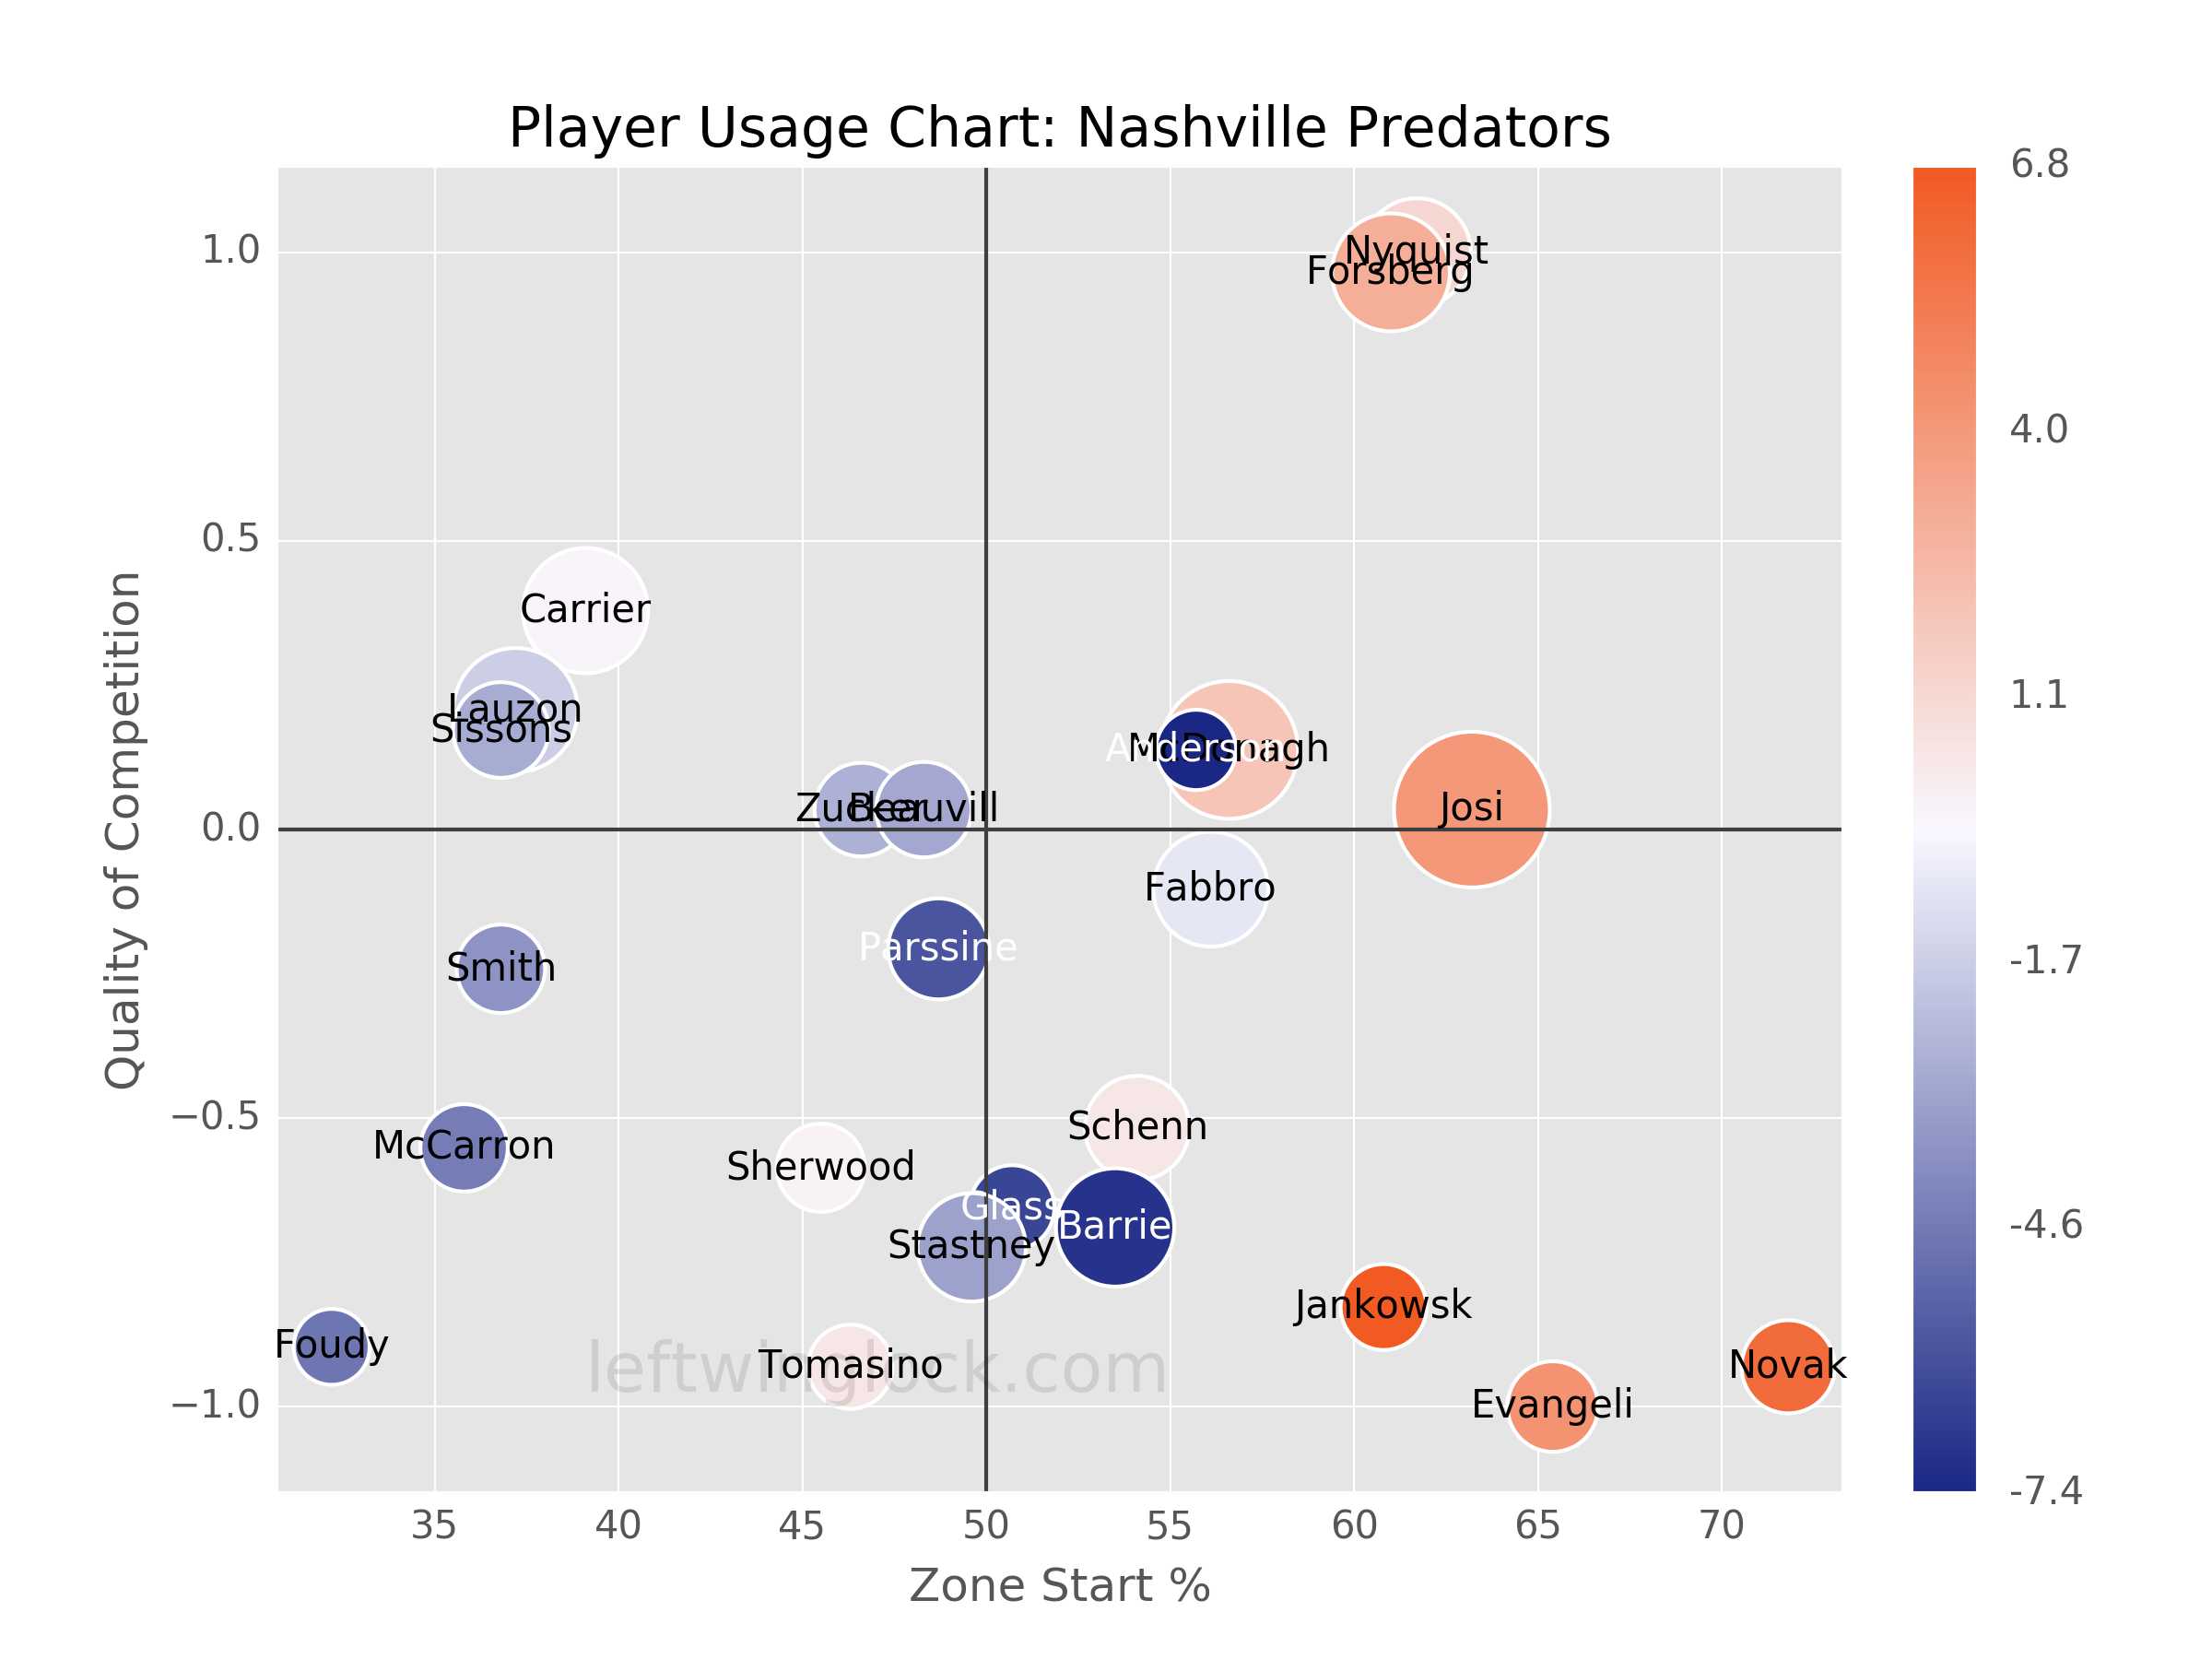
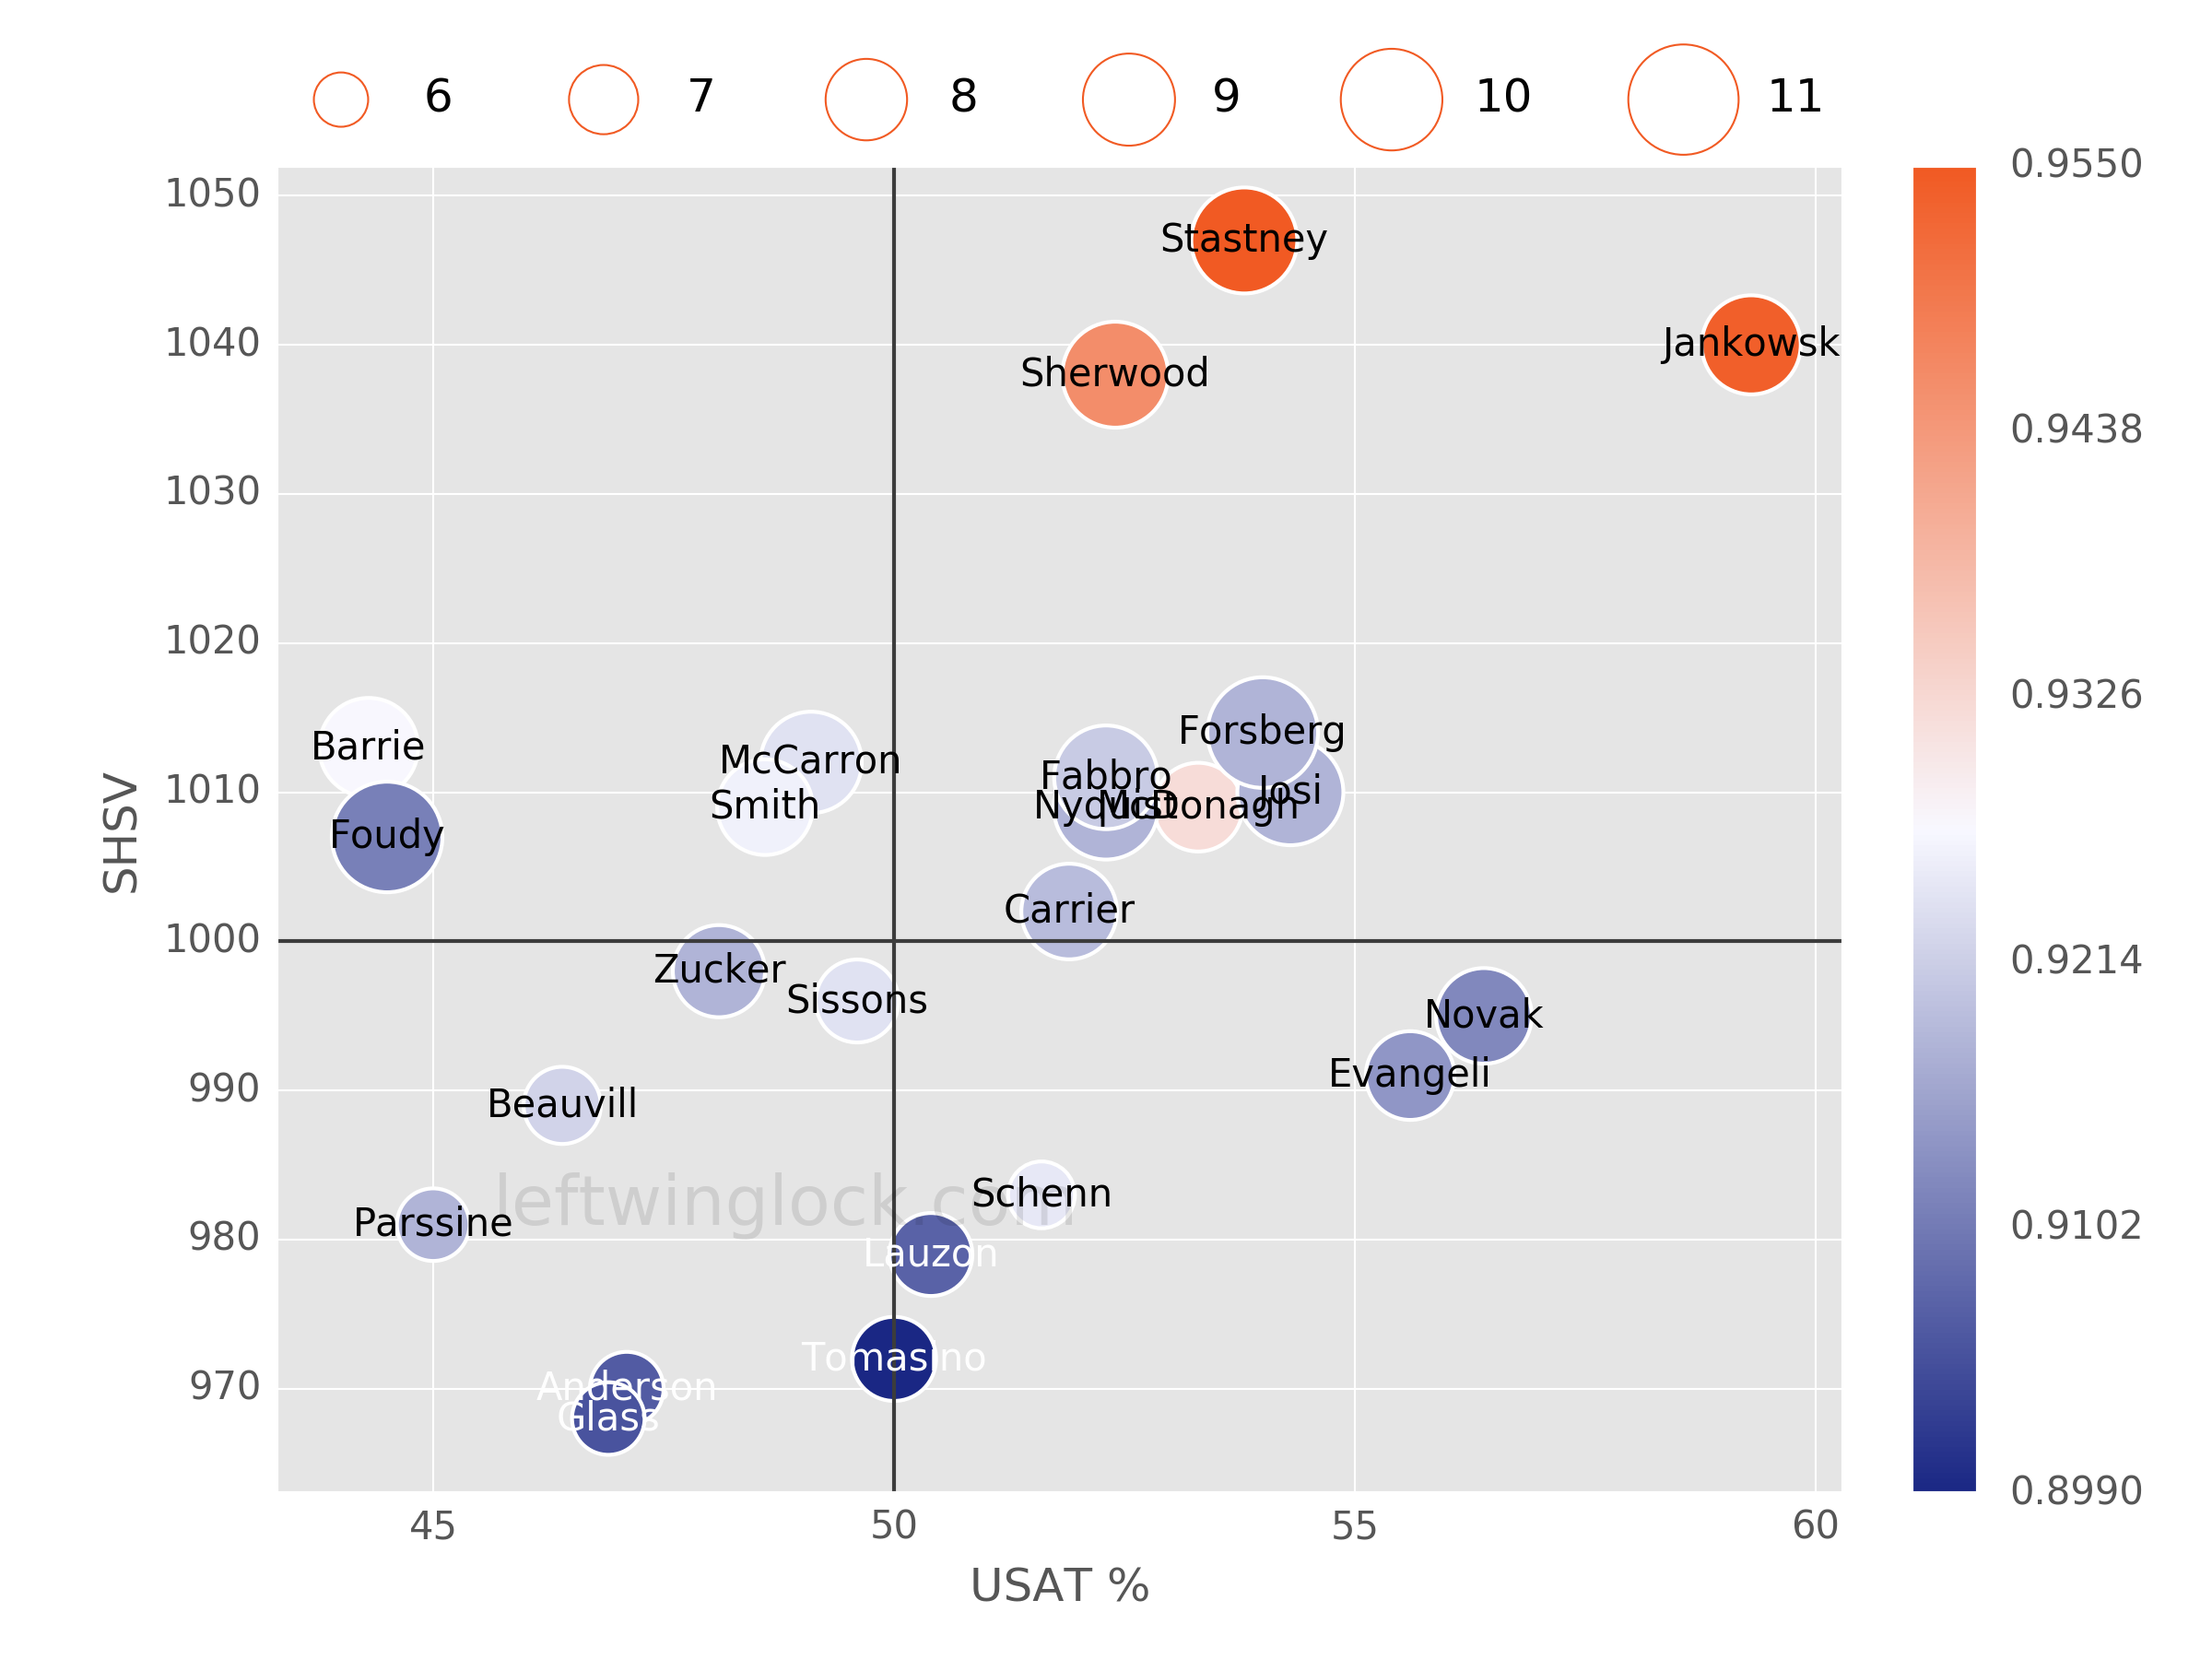
Player Usage Chart / Possession and Luck Chart