Jack Rathbone
Explore projections, stats, news, player usage charts, and line combinations for members of the Pittsburgh Penguins
-
Defenseman Leaders
2023 - 2024
Name G A Pts Quinn
Hughes17 75 92 Cale Makar 21 69 90 Roman Josi 23 62 85 Evan Bouchard 18 64 82 Victor Hedman 13 63 76 Adam Fox 17 56 73 Noah Dobson 10 60 70 Josh Morrissey 10 59 69 Mike Matheson 11 51 62 Rasmus Dahlin 20 39 59 Morgan Rielly 7 51 58 Zach Werenski 11 46 57 -
Player Card
-
Pittsburgh Penguins Leaders
2023 - 2024
Name PPG PPA PPP Sidney
Crosby10 13 23 Michael Bunting 7 14 21 Evgeni Malkin 6 12 18 Erik Karlsson 2 15 17 Bryan Rust 3 6 9 Reilly Smith 1 7 8 Rickard Rakell 4 2 6 Emil Bemstrom 4 1 5 Lars Eller 4 1 5 Kris Letang 0 5 5 Jeff Carter 4 0 4 Valtteri Puustinen 0 2 2

News
-
Jack Rathbone
Has been traded to the Pittsburgh Penguins, along with Karel Plasek, in exchange for Mark Friedman and Ty Glover.
Oct 17, 2023 - 1:39 pm -
Jack Rathbone
Has been reassigned to the AHL.
Apr 6, 2023 - 9:55 pm -
Jack Rathbone
Has been recalled from the AHL.
Mar 30, 2023 - 8:15 pm -
Jack Rathbone
Has been reassigned to the AHL.
Mar 28, 2023 - 7:59 pm
Feature
-
Trending
No articles available
Replies 0
Basic Stats
| Season | Team | GP | G | A | P | +/- | PIM | S | S/GP | SH% | PPP | H | BS | FW | FO% | TOI | EVTOI | PPTOI | PKTOI |
|---|---|---|---|---|---|---|---|---|---|---|---|---|---|---|---|---|---|---|---|
| 22-23 | VAN | 11 | 1 | 1 | 2 | -1 | 2 | 12 | 1.1 | 8.3 | 0 | 7 | 7 | 0 | 0.0 | 14.23 | 12.96 | 1.18 | 0.09 |
| 21-22 | VAN | 9 | 0 | 0 | 0 | -5 | 2 | 10 | 1.1 | 0.0 | 0 | 5 | 8 | 0 | 0.0 | 13.83 | 13.09 | 0.52 | 0.22 |
| 20-21 | VAN | 8 | 1 | 2 | 3 | 1 | 0 | 17 | 2.1 | 5.9 | 1 | 9 | 8 | 0 | 0.0 | 15.51 | 14.10 | 1.34 | 0.06 |
Enhanced Stats (5-on-5 unless denoted with *)
| Season | G/60 | A/60 | P/60 | IPP | ΔPEN/60 | 1A | 2A | EVS/60* | PPS/60* | SATF | SAT% | tEVSH% | tEVSV% | SHSV | ZS% |
|---|---|---|---|---|---|---|---|---|---|---|---|---|---|---|---|
| 22-23 | 0.43 | 0.43 | 0.86 | 29 | 0.38 | 0 | 1 | 4.7 | 4.6 | 112 | 42.7 | 12.9 | 0.907 | 1036 | 50.6 |
| 21-22 | 0.00 | 0.00 | 0.00 | 0 | 0.96 | 0 | 0 | 5.2 | 0.0 | 100 | 44.8 | 1.7 | 0.916 | 933 | 51.9 |
| 20-21 | 0.54 | 0.54 | 1.07 | 50 | 0.69 | 0 | 1 | 7.0 | 22.4 | 105 | 47.0 | 9.5 | 0.906 | 1001 | 47.8 |
Regression Meter
This meter measures whether or not a player's point production is being influenced by luck. Orange indicates the player has been lucky. Dark grey indicates the player has been unlucky.
2A/60
tEVSH%
SH%
IPP
PPSH%
Positional Data
| Season | Team | Left | Center | Right |
|---|---|---|---|---|
| 22-23 | VAN | 100 | 0 | 0 |
| 21-22 | VAN | 100 | 0 | 0 |
| 20-21 | VAN | 100 | 0 | 0 |
Most Common Pairings and Pair Production
See also: Pittsburgh Penguins Line Combos | Line Production Tool
| Team | D1 | D2 | GF | GA | GF% | SATF | SATA | SAT% | USATF | USATA | USAT% | SH% | SV% | SHSV | ZS% |
|---|
Most Recent 10 Games
| OPP | G | A | P | +/- | PIM | SOG | SH% | H | BS | FW | FL | FO% | TOI | EVTOI | PPTOI | PKTOI | ID |
|---|
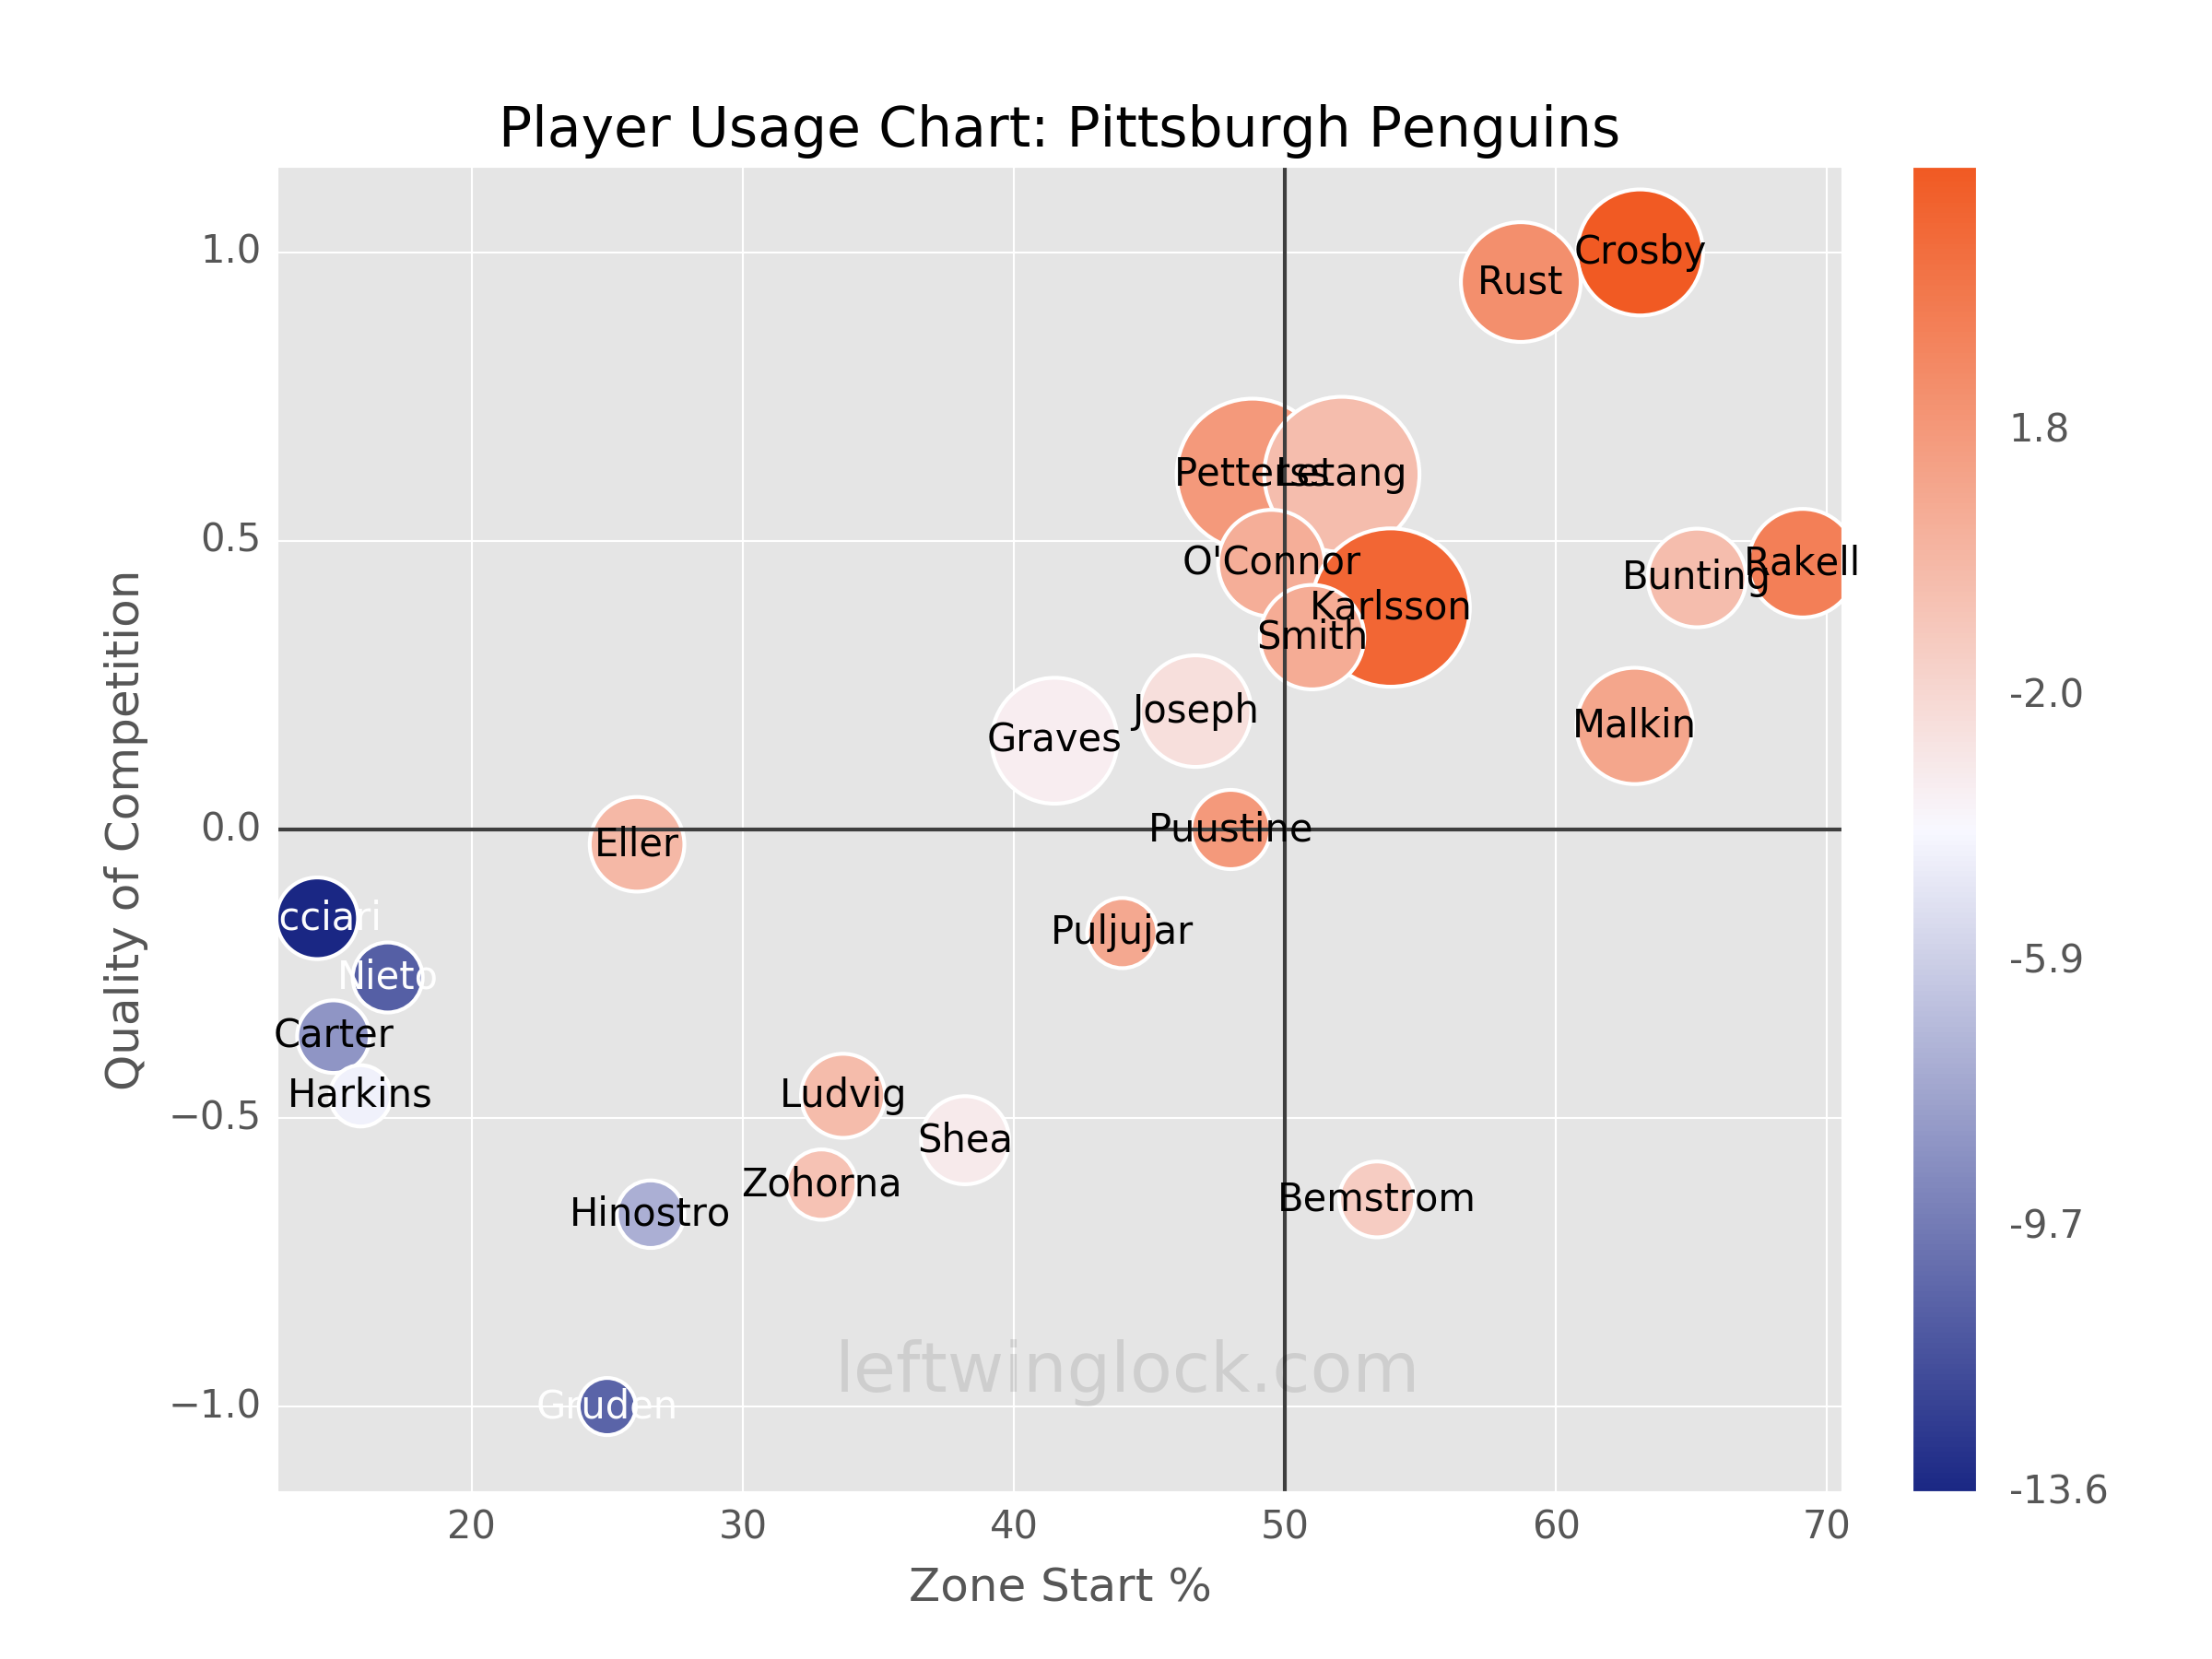
Player Usage Chart / Possession and Luck Chart