Jake DeBrusk
Explore projections, stats, news, player usage charts, and line combinations for members of the Boston Bruins
-
Left Wing Leaders
2023 - 2024
Name PPG PPA PPP Artemi
Panarin11 33 44 Kirill Kaprizov 18 22 40 Filip Forsberg 13 19 32 Matthew Tkachuk 6 26 32 Kevin Fiala 11 19 30 Chris Kreider 18 11 29 Alex Ovechkin 13 15 28 Jason Robertson 9 19 28 Jesper Bratt 7 20 27 Brad Marchand 7 19 26 Matt Boldy 10 14 24 Jared McCann 9 14 23 -
Player Card

Jake DeBrusk
Boston Bruins2023 - 2024- G 19
- A 21
- PTS 40
- +/- 4
- PIM 18
- PPP 10
- SH% 10.4
- L 29%
- C 0%
- R 71%
-
Boston Bruins Leaders
2023 - 2024
Name G A Pts David
Pastrnak47 63 110 Brad Marchand 29 38 67 Charlie Coyle 25 35 60 Pavel Zacha 21 38 59 Charlie McAvoy 12 35 47 Jake DeBrusk 19 21 40 Trent Frederic 18 22 40 Morgan Geekie 17 22 39 James van Riemsdyk 11 27 38 Danton Heinen 17 19 36 Hampus Lindholm 3 23 26 Kevin Shattenkirk 6 18 24
News
-
Jake DeBrusk
Is expected to be in the lineup for today's game.
Feb 6, 2024 - 11:35 am -
Jake DeBrusk
Will miss today's game with an injury.
Jan 27, 2024 - 12:04 pm -
Jake DeBrusk
Is expected to be in the lineup for today's game.
Oct 22, 2023 - 7:23 pm -
Jake DeBrusk
Will not play in tonight's game against the Los Angeles Kings.
Oct 21, 2023 - 2:31 pm
Feature
-
Trending
Buy-Low and Sell-High: Skaters
Replies 0
Basic Stats
| Season | Team | GP | G | A | P | +/- | PIM | S | S/GP | SH% | PPP | H | BS | FW | FO% | TOI | EVTOI | PPTOI | PKTOI |
|---|---|---|---|---|---|---|---|---|---|---|---|---|---|---|---|---|---|---|---|
| 23-24 | BOS | 80 | 19 | 21 | 40 | 4 | 18 | 183 | 2.3 | 10.4 | 10 | 107 | 48 | 7 | 30.4 | 16.83 | 13.55 | 1.68 | 1.61 |
| 22-23 | BOS | 64 | 27 | 23 | 50 | 26 | 16 | 191 | 3 | 14.1 | 14 | 85 | 22 | 4 | 26.7 | 16.78 | 12.46 | 2.94 | 1.37 |
| 21-22 | BOS | 77 | 25 | 17 | 42 | 6 | 10 | 184 | 2.4 | 13.6 | 4 | 62 | 25 | 10 | 45.5 | 15.04 | 13.11 | 1.30 | 0.63 |
| 20-21 | BOS | 41 | 5 | 9 | 14 | 1 | 6 | 92 | 2.2 | 5.4 | 3 | 33 | 20 | 6 | 40.0 | 14.89 | 12.81 | 1.38 | 0.71 |
| 19-20 | BOS | 65 | 19 | 16 | 35 | -1 | 14 | 161 | 2.5 | 11.8 | 10 | 35 | 15 | 9 | 34.6 | 16.05 | 13.48 | 2.56 | 0.01 |
Enhanced Stats (5-on-5 unless denoted with *)
| Season | G/60 | A/60 | P/60 | IPP | ΔPEN/60 | 1A | 2A | EVS/60* | PPS/60* | SATF | SAT% | tEVSH% | tEVSV% | SHSV | ZS% |
|---|---|---|---|---|---|---|---|---|---|---|---|---|---|---|---|
| 23-24 | 0.77 | 0.71 | 1.48 | 61 | 0.13 | 6 | 6 | 8.3 | 10.3 | 999 | 49.2 | 8.0 | 0.937 | 1017 | 48.2 |
| 22-23 | 1.51 | 0.87 | 2.38 | 65 | 0.22 | 8 | 3 | 0.0 | 15.0 | 887 | 58.4 | 9.1 | 0.936 | 1027 | 59.1 |
| 21-22 | 1.07 | 0.88 | 1.94 | 80 | 0.57 | 8 | 6 | 9.2 | 13.8 | 997 | 55.9 | 6.7 | 0.920 | 987 | 53.5 |
| 20-21 | 0.36 | 0.97 | 1.33 | 75 | 0.49 | 4 | 4 | 8.6 | 8.5 | 475 | 51.0 | 5.5 | 0.955 | 1010 | 55.1 |
| 19-20 | 0.95 | 0.80 | 1.75 | 73 | 0.46 | 7 | 4 | 9.6 | 9.7 | 760 | 51.0 | 7.1 | 0.937 | 1008 | 61.8 |
Regression Meter
This meter measures whether or not a player's point production is being influenced by luck. Orange indicates the player has been lucky. Dark grey indicates the player has been unlucky.
2A/60
tEVSH%
SH%
IPP
PPSH%
Positional Data
| Season | Team | Left | Center | Right |
|---|---|---|---|---|
| 23-24 | BOS | 29 | 0 | 71 |
| 22-23 | BOS | 3 | 0 | 97 |
| 21-22 | BOS | 60 | 0 | 40 |
| 20-21 | BOS | 42 | 0 | 58 |
| 19-20 | BOS | 97 | 0 | 3 |
Most Common Linemates and Line Production
See also: Boston Bruins Line Combo Tool | Line Production Tool
| Team | F1 | F2 | F3 | GF | GA | GF% | SATF | SATA | SAT% | USATF | USATA | USAT% | SH% | SV% | SHSV | ZS% |
|---|---|---|---|---|---|---|---|---|---|---|---|---|---|---|---|---|
| BOS | DEBRUSK | COYLE | MARCHAND | 14 | 9 | 60.9 | 301 | 356 | 45.8 | 191 | 249 | 43.4 | 10.4 | 0.945 | 1050 | 35.8 |
| BOS | DEBRUSK | ZACHA | PASTRNAK | 6 | 4 | 60.0 | 143 | 145 | 49.7 | 111 | 108 | 50.7 | 7.7 | 0.944 | 1021 | 65.1 |
| BOS | DEBRUSK | POITRAS | HEINEN | 2 | 1 | 66.7 | 70 | 60 | 53.8 | 46 | 41 | 52.9 | 6.1 | 0.964 | 1025 | 53.3 |
Most Recent 10 Games
| OPP | G | A | P | +/- | PIM | SOG | SH% | H | BS | FW | FL | FO% | TOI | EVTOI | PPTOI | PKTOI | ID |
|---|---|---|---|---|---|---|---|---|---|---|---|---|---|---|---|---|---|
| OTT | 0 | 0 | 0 | -2 | 0 | 4 | 0 | 2 | 0 | 0 | 0 | 0 | 14:50 | 13:20 | 00:13 | 01:17 | 21295 |
| WSH | 0 | 0 | 0 | -1 | 0 | 0 | 0 | 1 | 0 | 0 | 0 | 0 | 15:08 | 14:42 | 00:00 | 00:26 | 21291 |
| PIT | 1 | 0 | 1 | 0 | 0 | 4 | 25 | 2 | 0 | 0 | 0 | 0 | 17:57 | 13:23 | 03:40 | 00:54 | 21279 |
| CAR | 0 | 0 | 0 | -1 | 0 | 2 | 0 | 0 | 0 | 0 | 0 | 0 | 17:56 | 13:16 | 03:11 | 01:29 | 21239 |
| FLA | 0 | 0 | 0 | 1 | 0 | 0 | 0 | 3 | 0 | 1 | 0 | 100 | 18:38 | 14:13 | 03:23 | 01:02 | 21218 |
| CAR | 0 | 0 | 0 | 0 | 0 | 1 | 0 | 0 | 0 | 0 | 0 | 0 | 16:52 | 12:01 | 03:39 | 01:12 | 21202 |
| NSH | 0 | 0 | 0 | 0 | 2 | 1 | 0 | 1 | 0 | 0 | 0 | 0 | 17:35 | 14:01 | 01:41 | 01:53 | 21194 |
| WSH | 0 | 0 | 0 | -1 | 0 | 3 | 0 | 2 | 0 | 0 | 0 | 0 | 16:37 | 14:43 | 00:51 | 01:03 | 21176 |
| TBL | 0 | 0 | 0 | -1 | 0 | 3 | 0 | 2 | 1 | 0 | 0 | 0 | 17:50 | 16:14 | 00:46 | 00:50 | 21149 |
| FLA | 0 | 0 | 0 | -1 | 0 | 0 | 0 | 0 | 1 | 0 | 0 | 0 | 15:19 | 13:47 | 00:50 | 00:42 | 21136 |
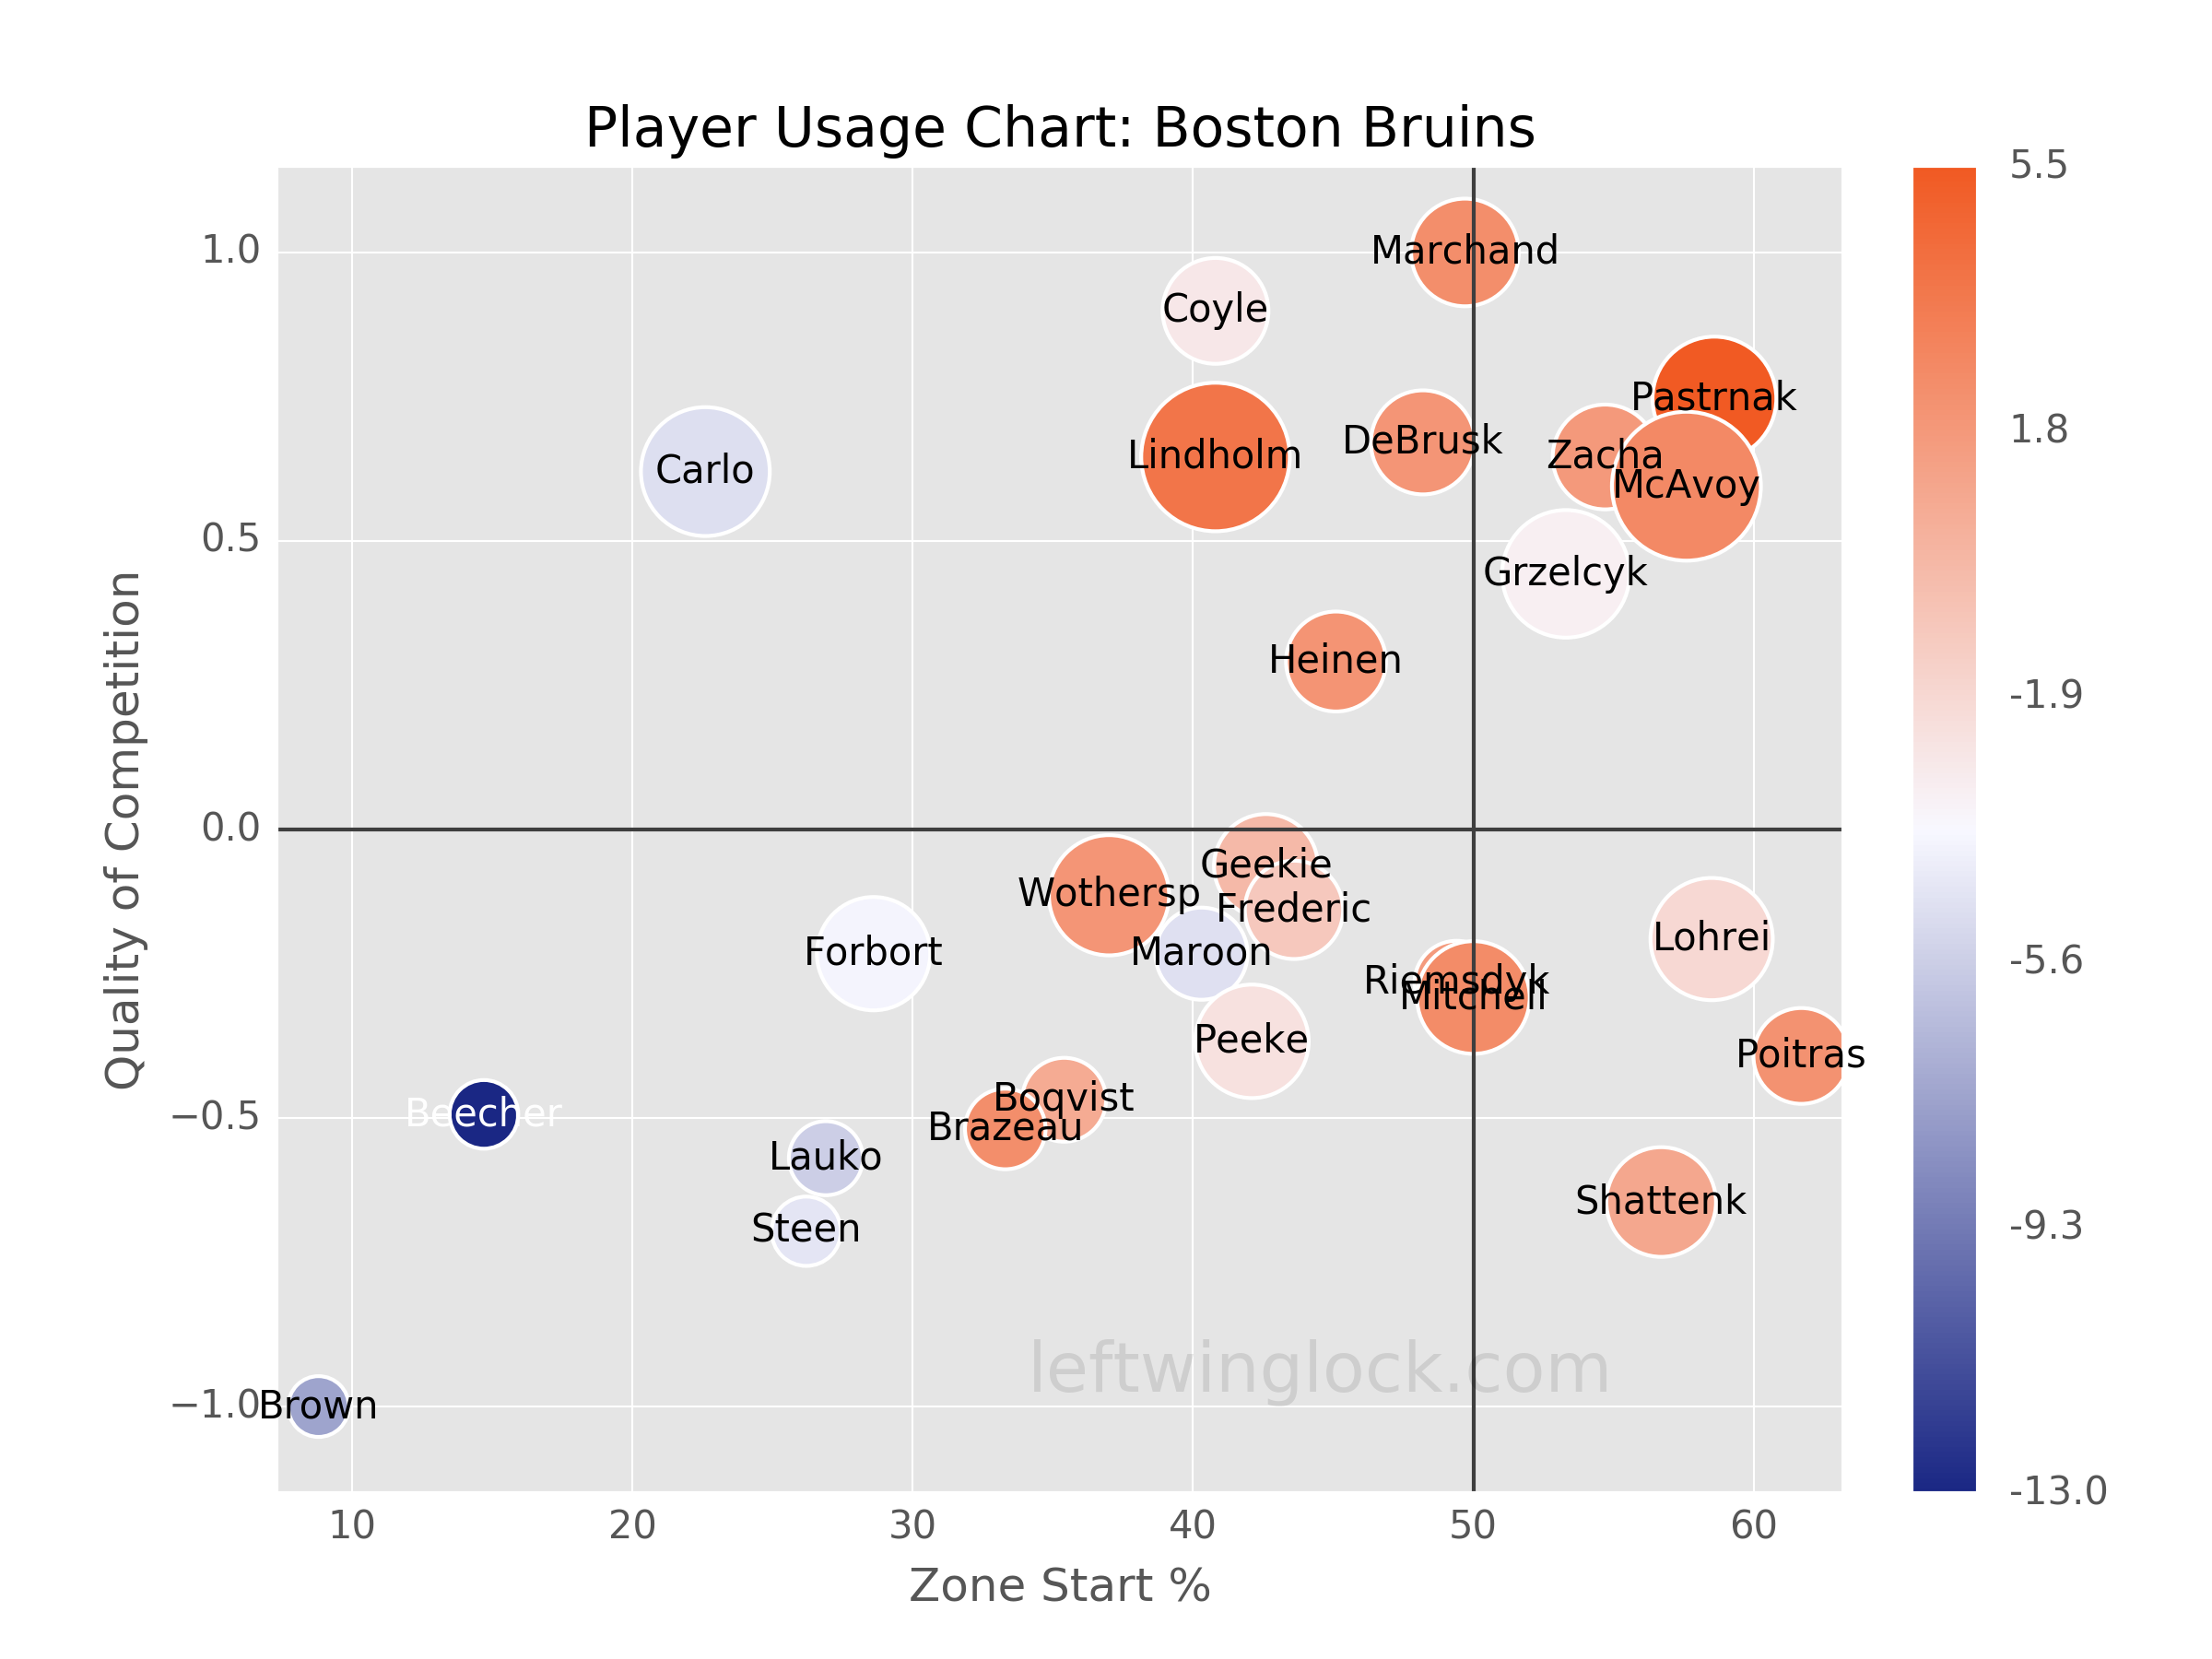
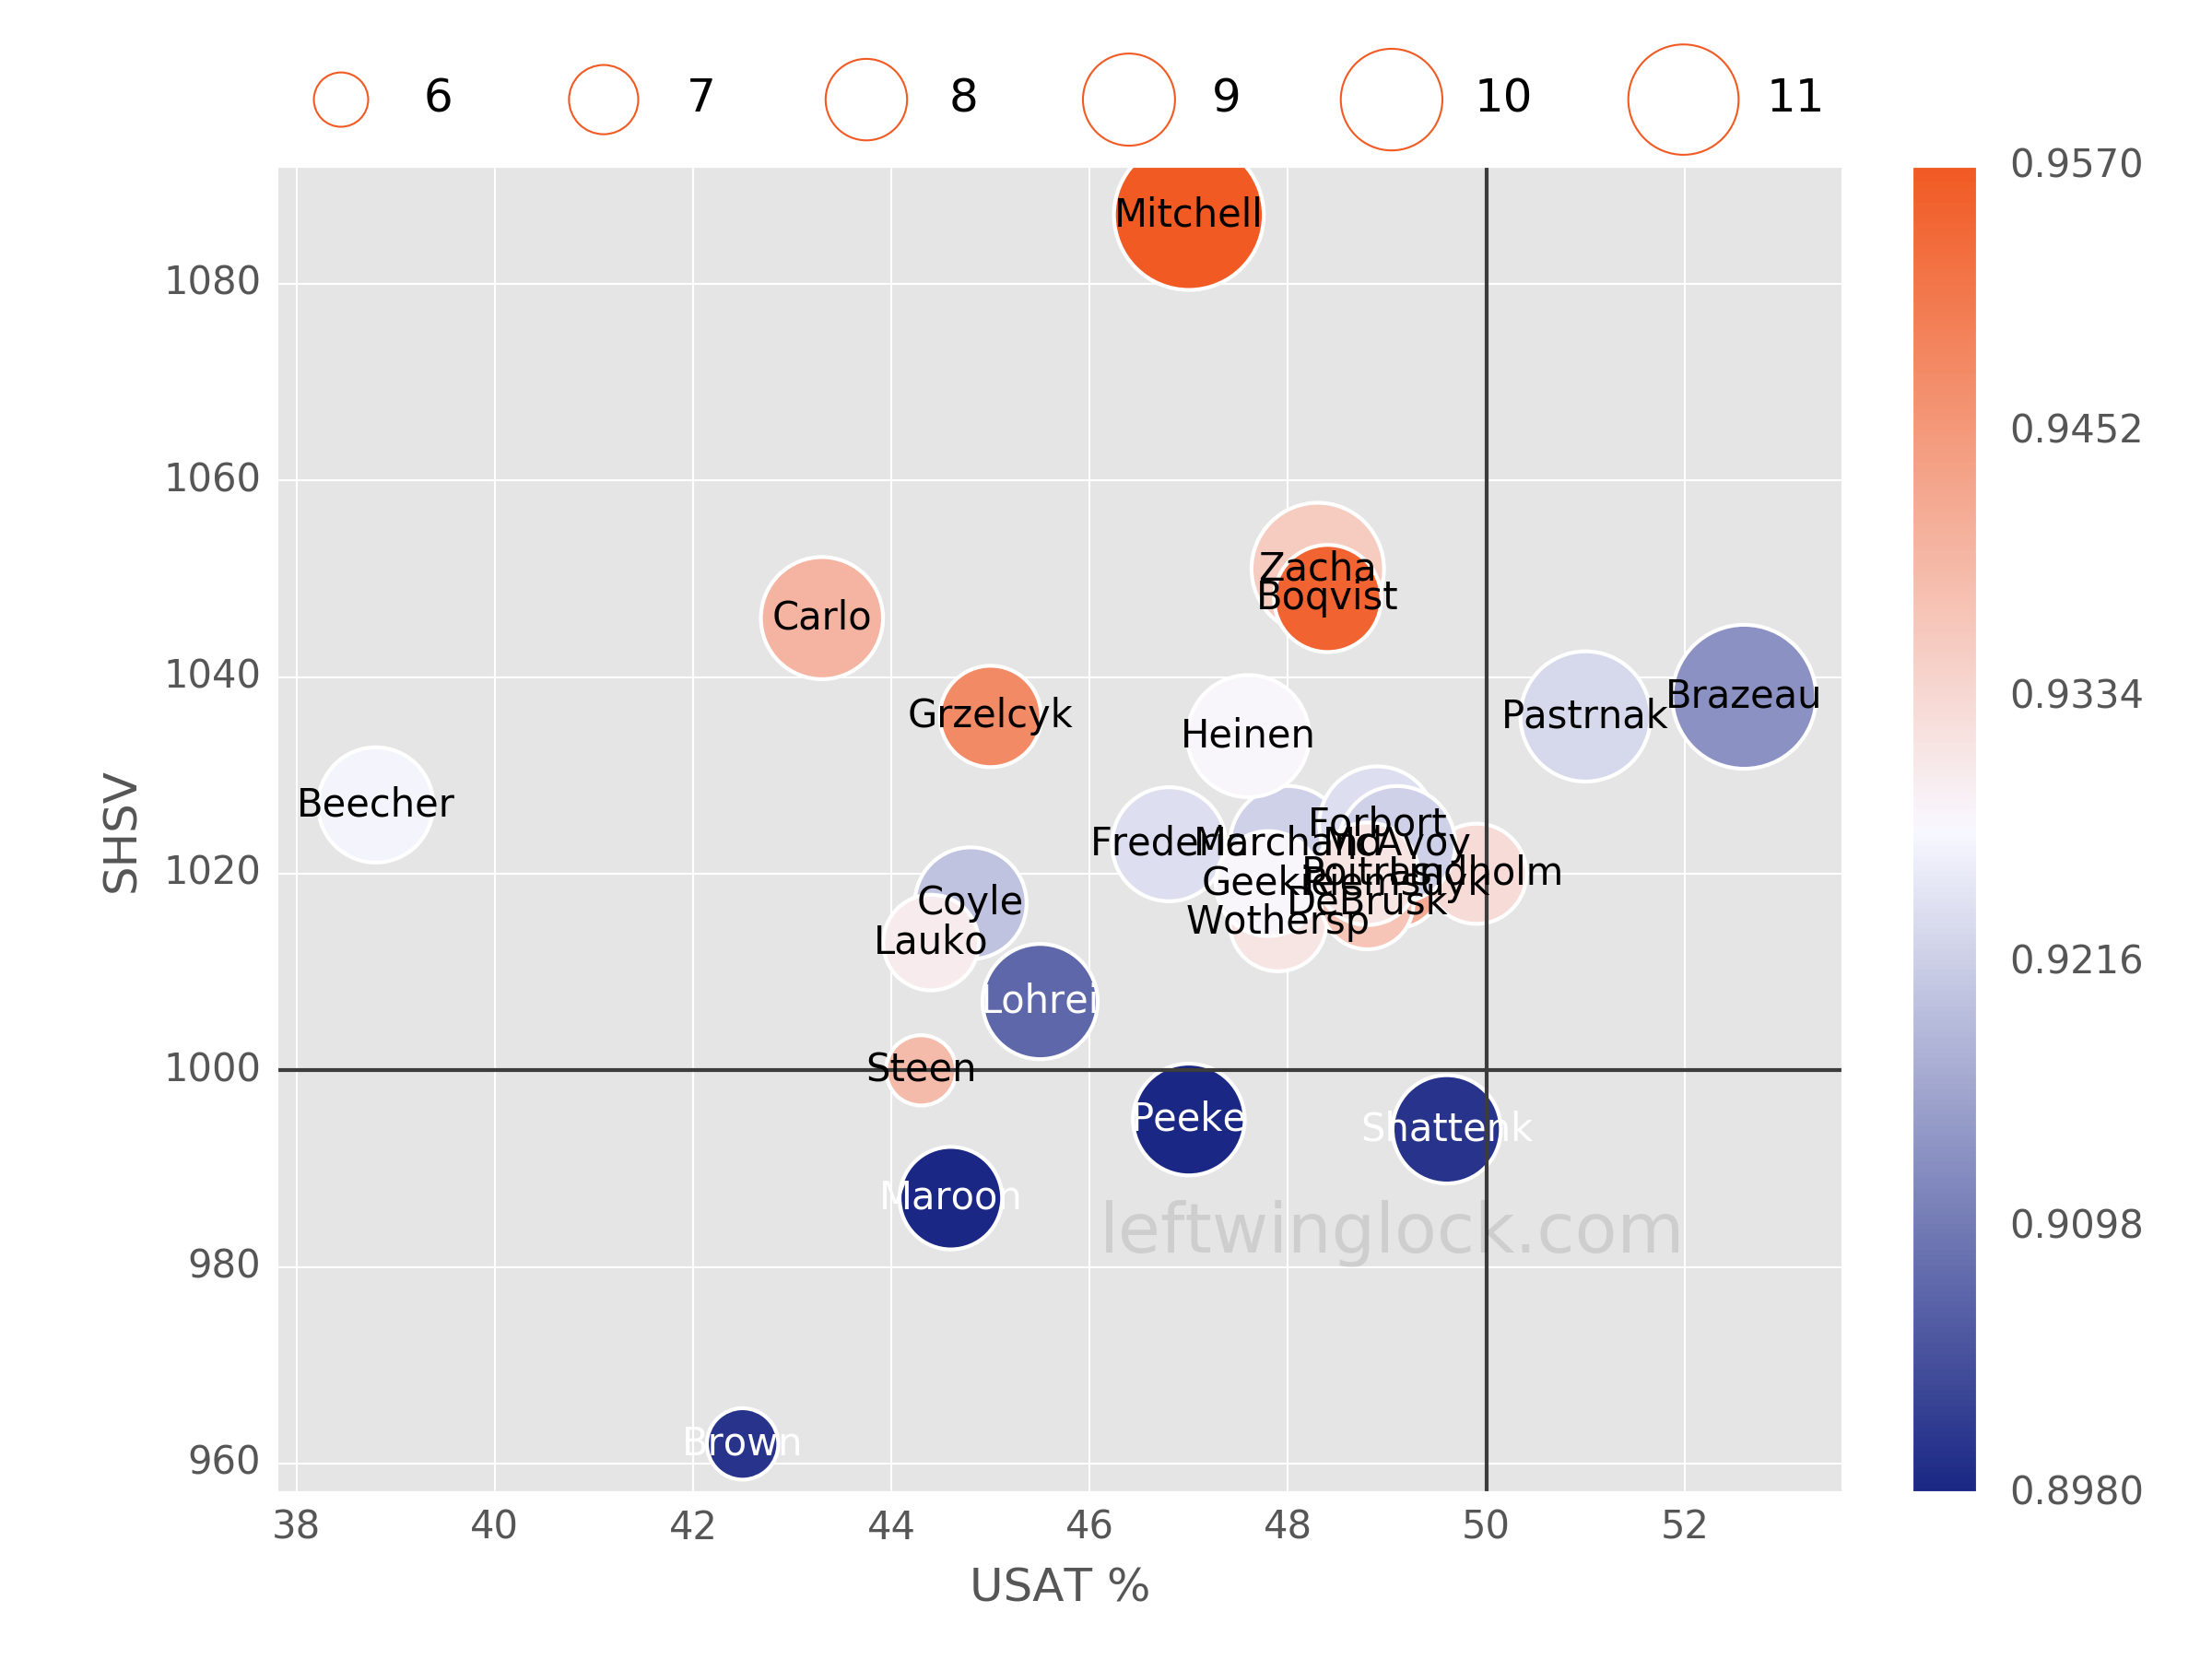
Player Usage Chart / Possession and Luck Chart