Matt Benning
Explore projections, stats, news, player usage charts, and line combinations for members of the San Jose Sharks
-
Defenseman Leaders
2023 - 2024
Name G A Pts Quinn
Hughes17 74 91 Cale Makar 21 68 89 Roman Josi 23 62 85 Evan Bouchard 18 64 82 Victor Hedman 13 63 76 Adam Fox 17 56 73 Noah Dobson 10 60 70 Josh Morrissey 10 59 69 Mike Matheson 11 51 62 Rasmus Dahlin 20 39 59 Morgan Rielly 7 51 58 Zach Werenski 11 46 57 -
Player Card
-
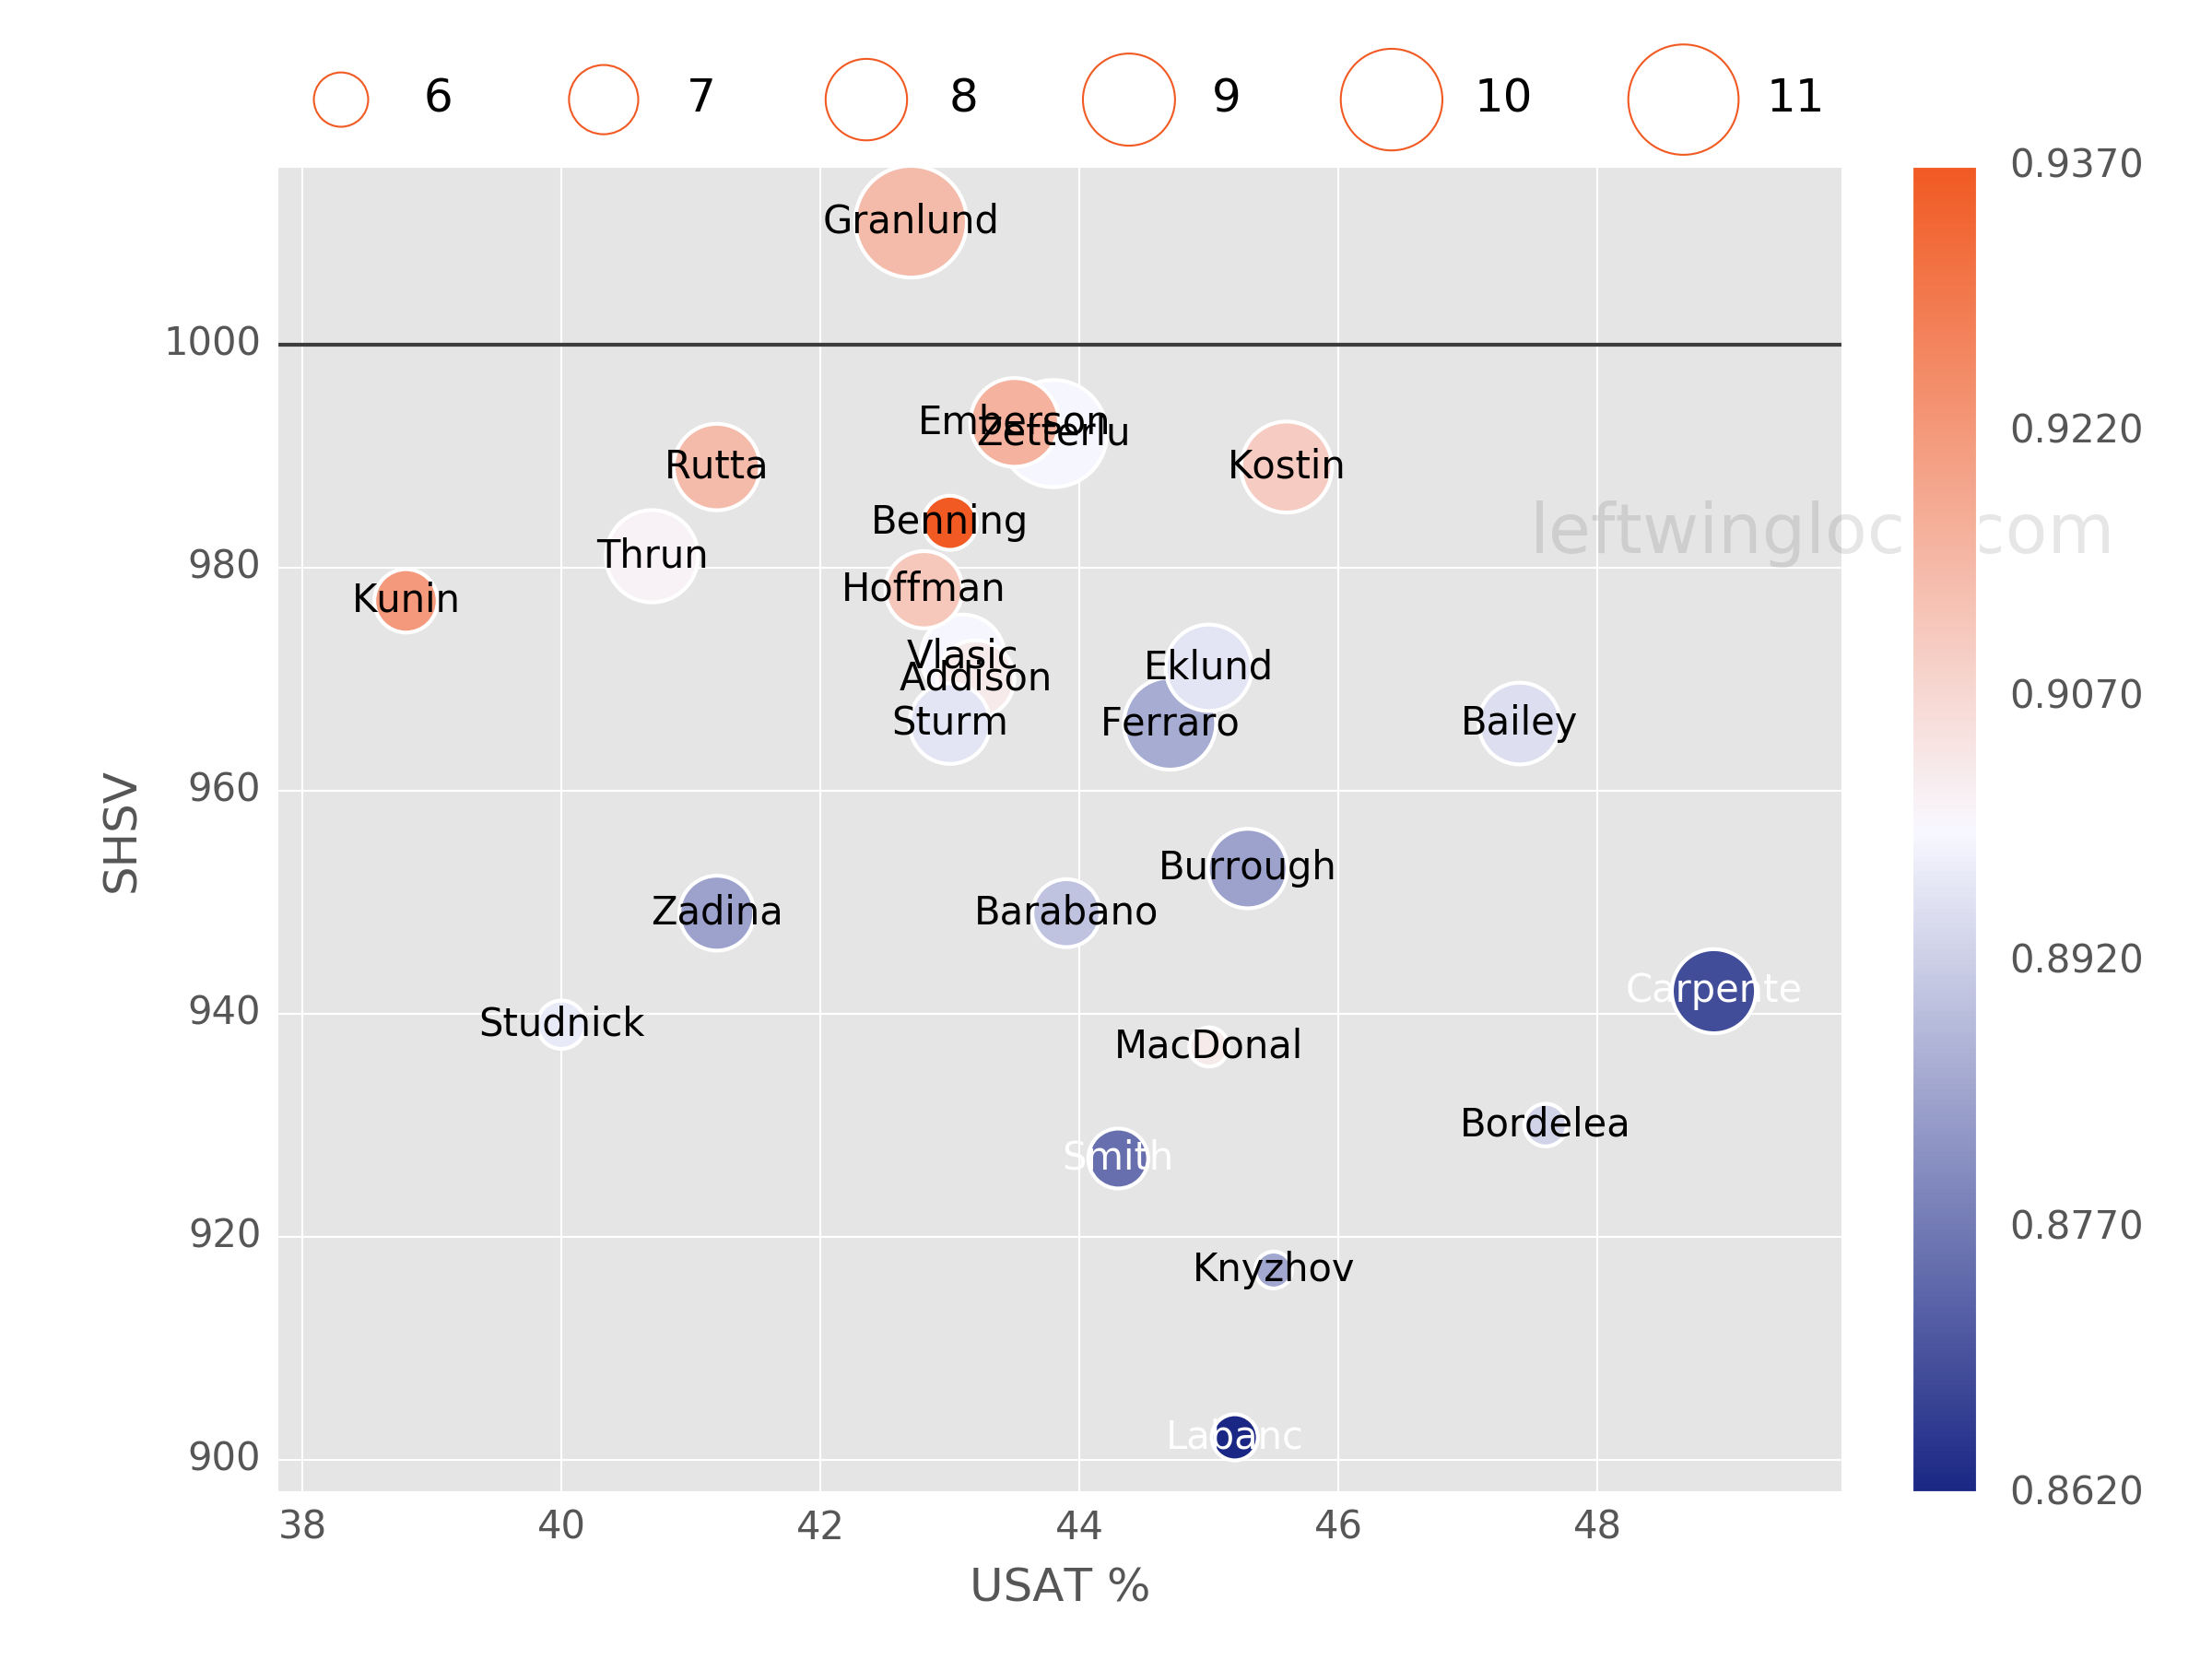
San Jose Sharks Leaders
2023 - 2024
Name G A Pts Mikael
Granlund12 47 59 William Eklund 16 29 45 Fabian Zetterlund 23 20 43 Filip Zadina 13 10 23 Mike Hoffman 10 13 23 Mario Ferraro 3 18 21 Jan Rutta 5 14 19 Luke Kunin 11 7 18 Calen Addison 1 16 17 Klim Kostin 8 6 14 Justin Bailey 5 9 14 Nico Sturm 5 8 13

News
-
Matt Benning
Had hip surgery and will need approximately five months of recovery time.
Jan 4, 2024 - 1:00 pm -
Matt Benning
Has been placed on IR.
Dec 12, 2023 - 3:17 pm -
Matt Benning
Is not expected to be in the lineup for today's game.
Dec 5, 2023 - 11:48 am -
Matt Benning
Has been activated from IR.
Nov 24, 2023 - 2:14 pm
Feature
-
Trending
Buy-Low and Sell-High: Skaters
Replies 0
Basic Stats
| Season | Team | GP | G | A | P | +/- | PIM | S | S/GP | SH% | PPP | H | BS | FW | FO% | TOI | EVTOI | PPTOI | PKTOI |
|---|---|---|---|---|---|---|---|---|---|---|---|---|---|---|---|---|---|---|---|
| 23-24 | SJS | 14 | 0 | 2 | 2 | -5 | 14 | 13 | 0.9 | 0.0 | 0 | 19 | 29 | 0 | 0.0 | 18.48 | 15.61 | 0.00 | 2.87 |
| 22-23 | SJS | 77 | 1 | 23 | 24 | -18 | 26 | 58 | 0.8 | 1.7 | 1 | 102 | 125 | 0 | 0.0 | 19.78 | 16.16 | 0.81 | 2.82 |
| 21-22 | NSH | 65 | 0 | 11 | 11 | -24 | 39 | 61 | 0.9 | 0.0 | 0 | 82 | 67 | 0 | 0.0 | 16.34 | 14.11 | 0.03 | 2.19 |
| 20-21 | NSH | 53 | 1 | 3 | 4 | -1 | 30 | 43 | 0.8 | 2.3 | 0 | 55 | 53 | 0 | 0.0 | 16.33 | 14.28 | 0.02 | 2.02 |
| 19-20 | EDM | 43 | 1 | 7 | 8 | 8 | 15 | 38 | 0.9 | 2.6 | 0 | 78 | 34 | 0 | 0.0 | 13.23 | 12.59 | 0.00 | 0.64 |
Enhanced Stats (5-on-5 unless denoted with *)
| Season | G/60 | A/60 | P/60 | IPP | ΔPEN/60 | 1A | 2A | EVS/60* | PPS/60* | SATF | SAT% | tEVSH% | tEVSV% | SHSV | ZS% |
|---|---|---|---|---|---|---|---|---|---|---|---|---|---|---|---|
| 23-24 | 0.00 | 0.57 | 0.57 | 50 | -1.16 | 2 | 0 | 3.7 | 0.0 | 172 | 43.6 | 4.7 | 0.937 | 984 | 46.9 |
| 22-23 | 0.05 | 1.00 | 1.04 | 46 | 0.28 | 11 | 9 | 2.6 | 1.9 | 985 | 44.7 | 9.0 | 0.907 | 997 | 30.0 |
| 21-22 | 0.00 | 0.68 | 0.68 | 41 | -0.23 | 6 | 4 | 4.1 | 0.0 | 754 | 49.6 | 6.3 | 0.878 | 941 | 38.1 |
| 20-21 | 0.08 | 0.17 | 0.25 | 13 | -0.07 | 0 | 2 | 3.2 | 0.0 | 607 | 48.7 | 6.8 | 0.929 | 997 | 34.2 |
| 19-20 | 0.11 | 0.79 | 0.90 | 35 | 0.00 | 5 | 2 | 4.0 | 0.0 | 434 | 48.2 | 9.5 | 0.933 | 1028 | 45.8 |
Regression Meter
This meter measures whether or not a player's point production is being influenced by luck. Orange indicates the player has been lucky. Dark grey indicates the player has been unlucky.
2A/60
tEVSH%
SH%
IPP
PPSH%
Positional Data
| Season | Team | Left | Center | Right |
|---|---|---|---|---|
| 23-24 | SJS | 29 | 0 | 71 |
| 22-23 | SJ | 0 | 0 | 100 |
| 21-22 | SJ | 0 | 0 | 0 |
| 20-21 | NSH | 0 | 0 | 100 |
| 19-20 | EDM | 0 | 0 | 100 |
Most Common Pairings and Pair Production
See also: San Jose Sharks Line Combos | Line Production Tool
| Team | D1 | D2 | GF | GA | GF% | SATF | SATA | SAT% | USATF | USATA | USAT% | SH% | SV% | SHSV | ZS% |
|---|---|---|---|---|---|---|---|---|---|---|---|---|---|---|---|
| SJS | MATT BENNING | CALEN ADDISON | 1 | 1 | 50.0 | 46 | 39 | 54.1 | 34 | 28 | 54.8 | 5.0 | 0.955 | 1005 | 37.5 |
| SJS | KYLE BURROUGHS | MATT BENNING | 0 | 2 | 0.0 | 27 | 38 | 41.5 | 20 | 28 | 41.7 | 0.0 | 0.905 | 905 | 41.7 |
| SJS | MATT BENNING | MARIO FERRARO | 1 | 2 | 33.3 | 23 | 34 | 40.4 | 18 | 27 | 40.0 | 9.1 | 0.917 | 1008 | 27.3 |
Most Recent 10 Games
| OPP | G | A | P | +/- | PIM | SOG | SH% | H | BS | FW | FL | FO% | TOI | EVTOI | PPTOI | PKTOI | ID |
|---|---|---|---|---|---|---|---|---|---|---|---|---|---|---|---|---|---|
| NYR | 0 | 0 | 0 | -1 | 0 | 1 | 0 | 0 | 1 | 0 | 0 | 0 | 15:16 | 11:53 | 00:00 | 03:23 | 20370 |
| NJD | 0 | 1 | 1 | 3 | 2 | 0 | 0 | 0 | 2 | 0 | 0 | 0 | 18:22 | 16:22 | 00:00 | 02:00 | 20355 |
| BOS | 0 | 0 | 0 | 0 | 2 | 1 | 0 | 1 | 0 | 0 | 0 | 0 | 15:27 | 11:51 | 00:00 | 03:36 | 20340 |
| WSH | 0 | 0 | 0 | 0 | 0 | 1 | 0 | 2 | 1 | 0 | 0 | 0 | 20:41 | 17:13 | 00:00 | 03:28 | 20326 |
| VAN | 0 | 0 | 0 | -1 | 4 | 1 | 0 | 3 | 5 | 0 | 0 | 0 | 22:44 | 19:46 | 00:00 | 02:58 | 20314 |
| MTL | 0 | 0 | 0 | 0 | 0 | 0 | 0 | 2 | 2 | 0 | 0 | 0 | 18:20 | 16:04 | 00:00 | 02:16 | 20300 |
| WSH | 0 | 0 | 0 | -1 | 0 | 1 | 0 | 0 | 2 | 0 | 0 | 0 | 16:45 | 13:23 | 00:00 | 03:22 | 20128 |
| TBL | 0 | 0 | 0 | -2 | 2 | 1 | 0 | 5 | 4 | 0 | 0 | 0 | 20:20 | 18:42 | 00:00 | 01:38 | 20106 |
| FLA | 0 | 0 | 0 | -1 | 0 | 3 | 0 | 1 | 0 | 0 | 0 | 0 | 19:56 | 16:09 | 00:04 | 03:43 | 20089 |
| NSH | 0 | 0 | 0 | -1 | 0 | 1 | 0 | 0 | 1 | 0 | 0 | 0 | 18:43 | 13:48 | 00:00 | 04:55 | 20074 |
Player Usage Chart / Possession and Luck Chart