RILEY STILLMAN
Explore projections, stats, news, player usage charts, and line combinations for members of the Buffalo Sabres
-
Defenseman Leaders
2023 - 2024
Name G A Pts Quinn
Hughes17 74 91 Cale Makar 21 68 89 Roman Josi 23 62 85 Evan Bouchard 18 63 81 Victor Hedman 13 63 76 Adam Fox 17 56 73 Noah Dobson 10 60 70 Josh Morrissey 10 59 69 Mike Matheson 11 51 62 Rasmus Dahlin 20 39 59 Morgan Rielly 7 51 58 Zach Werenski 11 46 57 -
Player Card
-
Buffalo Sabres Leaders
2023 - 2024
Name PPG PPA PPP Rasmus
Dahlin6 14 20 Tage Thompson 9 7 16 Jeff Skinner 8 4 12 Alex Tuch 2 9 11 Dylan Cozens 2 8 10 JJ Peterka 3 4 7 Owen Power 0 6 6 Victor Olofsson 1 2 3 Jordan Greenway 1 2 3 Jack Quinn 1 2 3 Zach Benson 0 2 2 Bowen Byram 0 1 1

News
-
Riley Stillman
Is not expected to be in the lineup for today's game.
Mar 24, 2023 - 6:31 pm -
Riley Stillman
Is expected to be in the lineup for today's game.
Mar 9, 2023 - 11:28 am -
Riley Stillman
Is considered day-to-day with an upper-body injury.
Mar 6, 2023 - 10:50 am -
Riley Stillman
Has suffered an upper-body injury and will not return to the game.
Mar 4, 2023 - 2:36 pm
Feature
-
Trending
No articles available
Replies 0
Basic Stats
| Season | Team | GP | G | A | P | +/- | PIM | S | S/GP | SH% | PPP | H | BS | FW | FO% | TOI | EVTOI | PPTOI | PKTOI |
|---|---|---|---|---|---|---|---|---|---|---|---|---|---|---|---|---|---|---|---|
| 22-23 | BUF | 50 | 1 | 7 | 8 | -13 | 36 | 37 | 0.7 | 2.7 | 0 | 81 | 44 | 0 | 0.0 | 14.64 | 13.65 | 0.03 | 0.96 |
| 21-22 | CHI | 52 | 2 | 10 | 12 | -8 | 36 | 49 | 0.9 | 4.1 | 0 | 122 | 67 | 0 | 0.0 | 15.06 | 13.92 | 0.02 | 1.12 |
| 20-21 | FLA | 21 | 1 | 0 | 1 | 5 | 16 | 29 | 1.4 | 3.5 | 0 | 51 | 29 | 0 | 0.0 | 15.36 | 14.30 | 0.01 | 1.06 |
| 19-20 | FLA | 34 | 0 | 5 | 5 | -3 | 14 | 39 | 1.1 | 0.0 | 0 | 59 | 57 | 0 | 0.0 | 19.12 | 16.70 | 0.04 | 2.37 |
Enhanced Stats (5-on-5 unless denoted with *)
| Season | G/60 | A/60 | P/60 | IPP | ΔPEN/60 | 1A | 2A | EVS/60* | PPS/60* | SATF | SAT% | tEVSH% | tEVSV% | SHSV | ZS% |
|---|---|---|---|---|---|---|---|---|---|---|---|---|---|---|---|
| 22-23 | 0.09 | 0.62 | 0.71 | 23 | -0.33 | 2 | 5 | 3.3 | 0.0 | 623 | 49.8 | 8.7 | 0.873 | 960 | 48.4 |
| 21-22 | 0.17 | 0.68 | 0.85 | 35 | 0.08 | 6 | 2 | 3.9 | 0.0 | 556 | 41.3 | 8.9 | 0.920 | 1009 | 52.0 |
| 20-21 | 0.20 | 0.00 | 0.20 | 0 | 0.19 | 0 | 0 | 5.5 | 0.0 | 267 | 46.2 | 10.1 | 0.938 | 1039 | 39.3 |
| 19-20 | 0.00 | 0.44 | 0.44 | 20 | 0.18 | 2 | 2 | 4.2 | 0.0 | 477 | 48.6 | 7.5 | 0.921 | 996 | 45.7 |
Regression Meter
This meter measures whether or not a player's point production is being influenced by luck. Orange indicates the player has been lucky. Dark grey indicates the player has been unlucky.
2A/60
tEVSH%
SH%
IPP
PPSH%
Positional Data
| Season | Team | Left | Center | Right |
|---|---|---|---|---|
| 22-23 | BUF | 100 | 0 | 0 |
| 21-22 | CHI | 87 | 0 | 13 |
| 20-21 | FLA | 100 | 0 | 0 |
| 19-20 | FLA | 85 | 0 | 15 |
Most Common Pairings and Pair Production
See also: Buffalo Sabres Line Combos | Line Production Tool
| Team | D1 | D2 | GF | GA | GF% | SATF | SATA | SAT% | USATF | USATA | USAT% | SH% | SV% | SHSV | ZS% |
|---|
Most Recent 10 Games
| OPP | G | A | P | +/- | PIM | SOG | SH% | H | BS | FW | FL | FO% | TOI | EVTOI | PPTOI | PKTOI | ID |
|---|
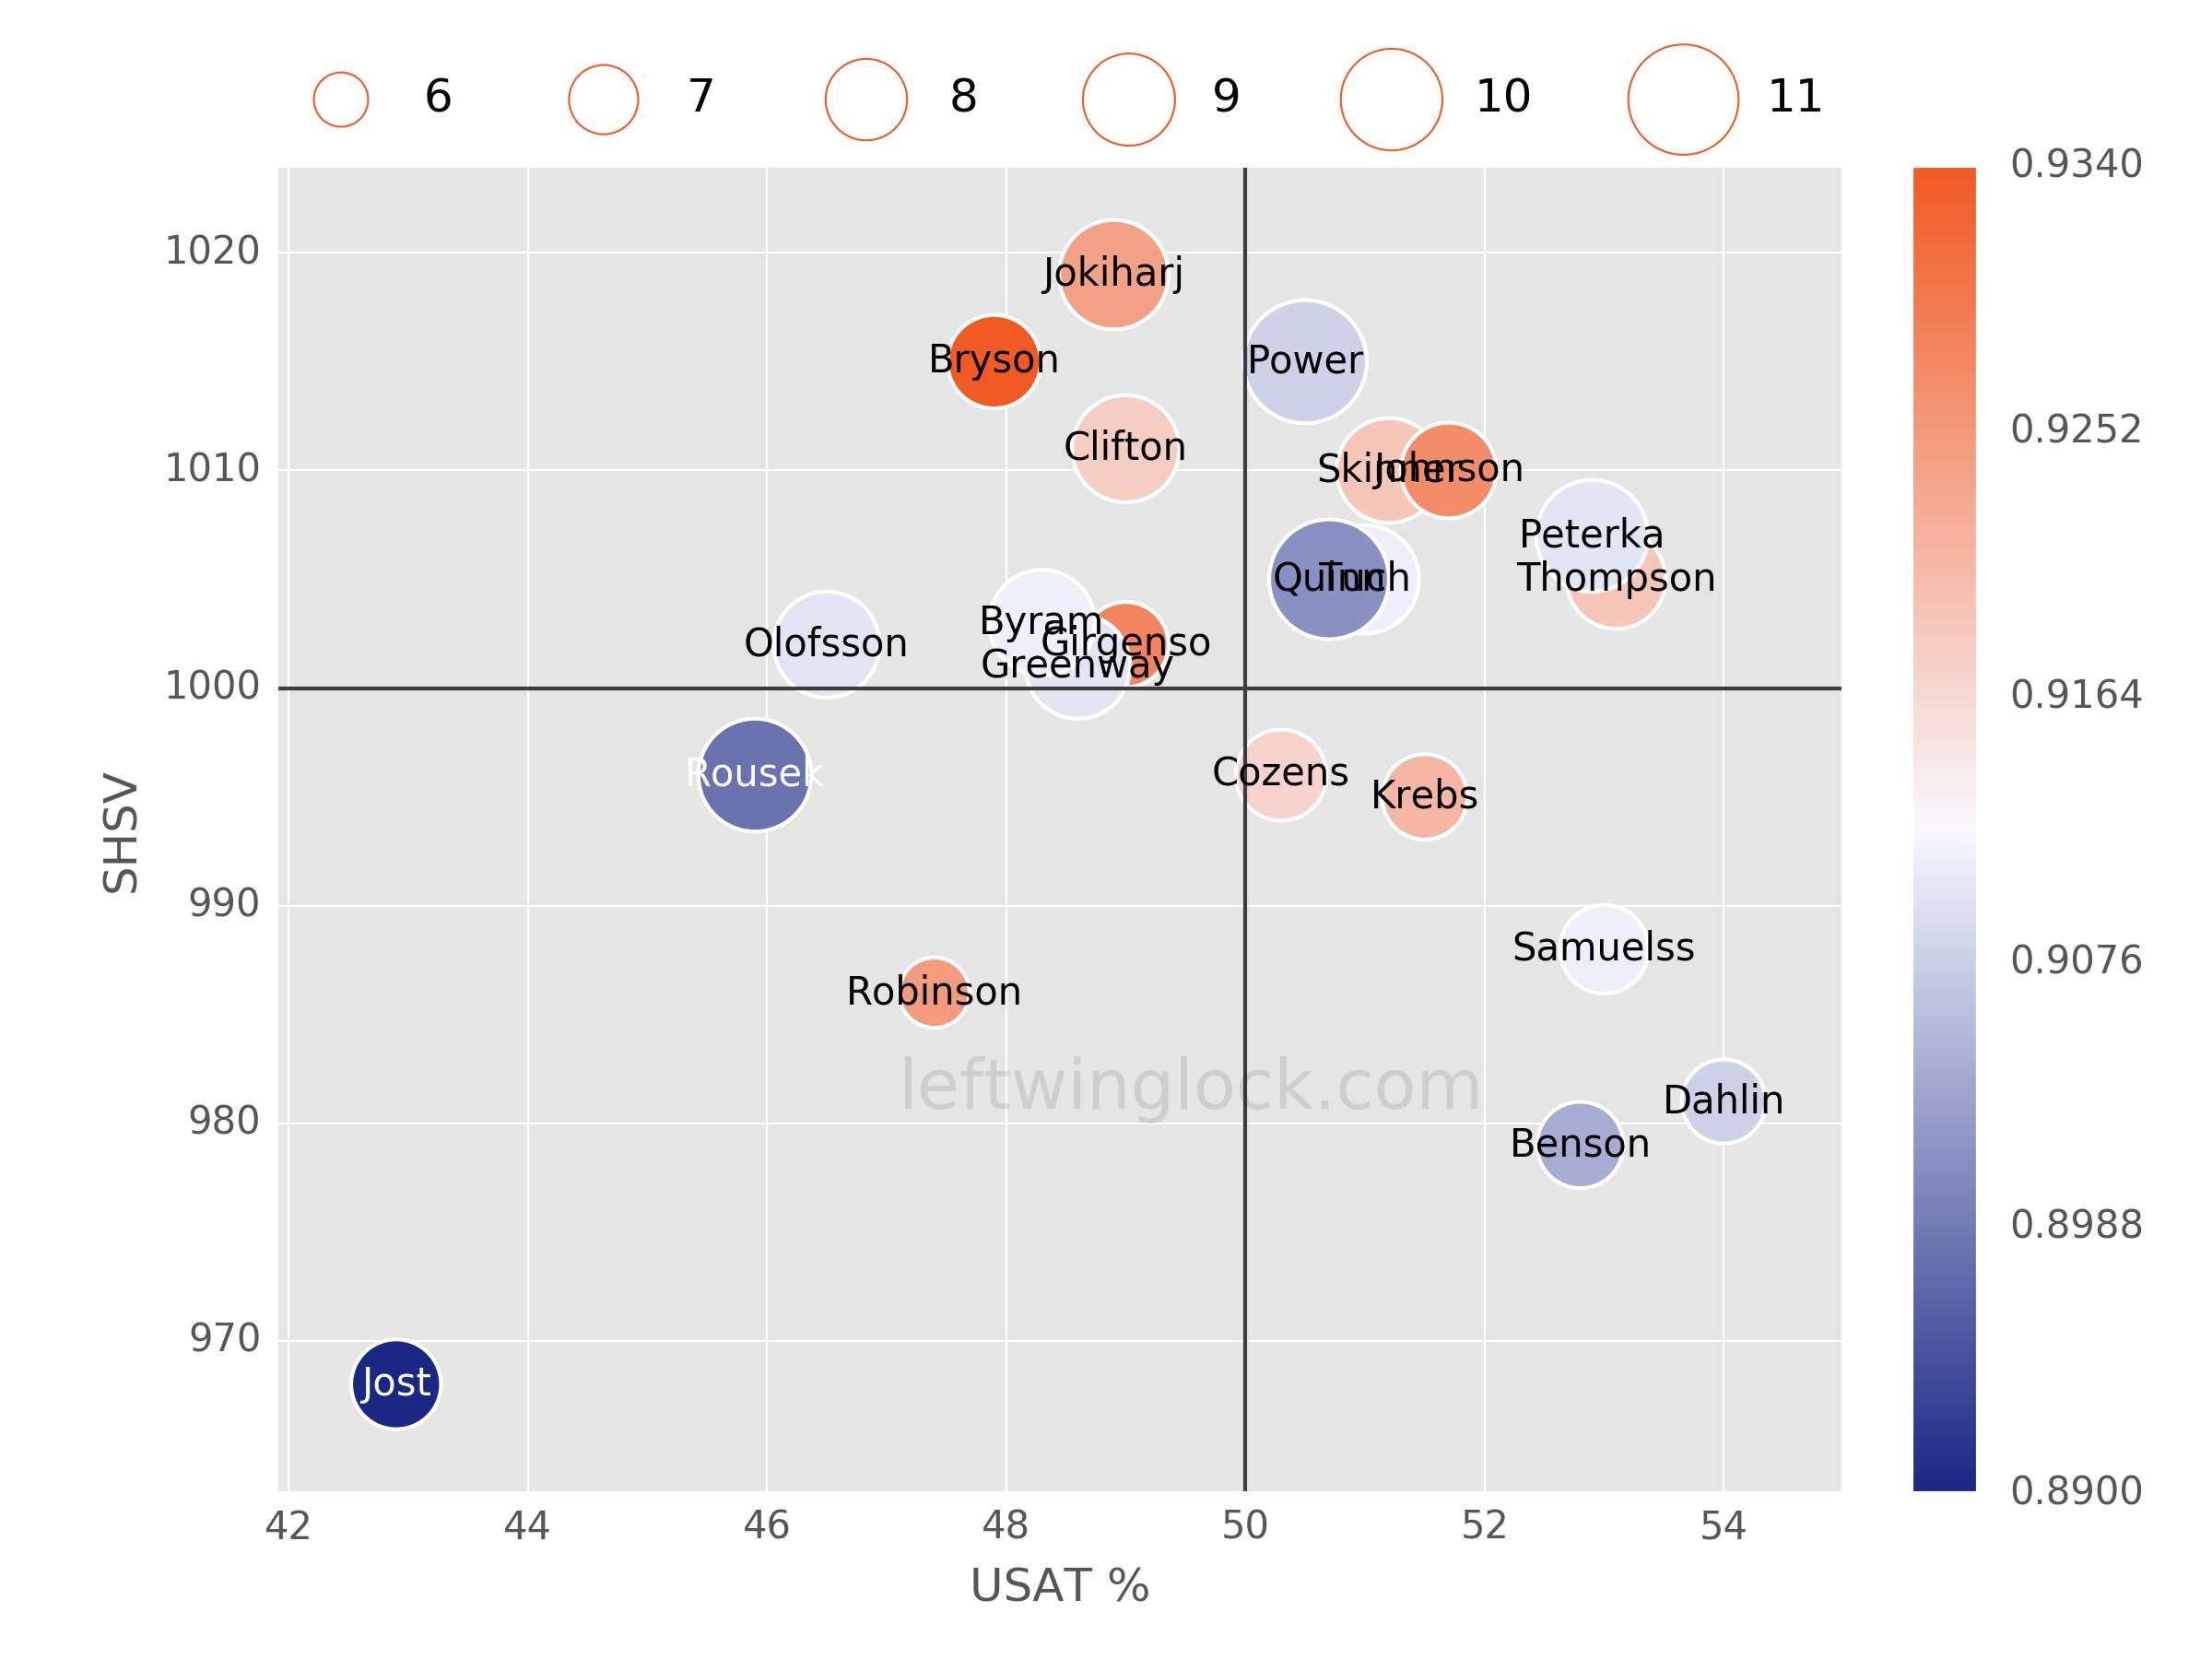
Player Usage Chart / Possession and Luck Chart