TOMAS NOSEK
Explore projections, stats, news, player usage charts, and line combinations for members of the New Jersey Devils
-
Left Wing Leaders
2023 - 2024
Name G A Pts Artemi
Panarin49 71 120 Kirill Kaprizov 45 50 95 Filip Forsberg 48 46 94 Matthew Tkachuk 26 62 88 Jesper Bratt 27 56 83 Jason Robertson 29 51 80 Zach Hyman 54 23 77 Chris Kreider 39 36 75 Brandon Hagel 26 49 75 Brady Tkachuk 37 37 74 Kevin Fiala 29 44 73 Lucas Raymond 31 41 72 -
Player Card

TOMAS NOSEK
New Jersey Devils2023 - 2024- G 2
- A 4
- PTS 6
- +/- -11
- PIM 6
- PPP 0
- SH% 5.3
- L 14%
- C 83%
- R 3%
-
New Jersey Devils Leaders
2023 - 2024
Name G A Pts Jesper
Bratt27 56 83 Jack Hughes 27 47 74 Nico Hischier 27 40 67 Timo Meier 28 24 52 Luke Hughes 9 38 47 Erik Haula 16 19 35 Dawson Mercer 20 13 33 Ondrej Palat 11 20 31 Alexander Holtz 16 12 28 Curtis Lazar 7 18 25 John Marino 4 21 25 Michael McLeod 10 9 19
News
-
Tomas Nosek
Is not expected to be in the lineup for today's game.
Feb 24, 2024 - 1:42 pm -
Tomas Nosek
Has re-aggravated his foot injury. He underwent surgery and will be out indefinitely.
Dec 1, 2023 - 4:59 pm -
Tomas Nosek
Is not on the ice for practice.
Nov 27, 2023 - 10:35 am -
Tomas Nosek
Has been placed on IR.
Nov 25, 2023 - 5:48 pm
Feature
-
Trending
Buy-Low and Sell-High: Skaters
Replies 0
Basic Stats
| Season | Team | GP | G | A | P | +/- | PIM | S | S/GP | SH% | PPP | H | BS | FW | FO% | TOI | EVTOI | PPTOI | PKTOI |
|---|---|---|---|---|---|---|---|---|---|---|---|---|---|---|---|---|---|---|---|
| 23-24 | NJD | 36 | 2 | 4 | 6 | -11 | 6 | 38 | 1.1 | 5.3 | 0 | 33 | 20 | 121 | 51.9 | 11.81 | 10.37 | 0.05 | 1.39 |
| 22-23 | BOS | 66 | 7 | 11 | 18 | 9 | 48 | 69 | 1 | 10.1 | 0 | 69 | 31 | 354 | 59.3 | 12.55 | 9.96 | 0.03 | 2.56 |
| 21-22 | BOS | 75 | 3 | 14 | 17 | -9 | 32 | 84 | 1.1 | 3.6 | 0 | 85 | 34 | 362 | 54.0 | 13.34 | 11.49 | 0.05 | 1.81 |
| 20-21 | VGK | 38 | 8 | 10 | 18 | 7 | 10 | 59 | 1.6 | 13.6 | 1 | 51 | 18 | 200 | 51.7 | 13.00 | 11.60 | 0.06 | 1.34 |
| 19-20 | VGK | 67 | 8 | 7 | 15 | -2 | 20 | 93 | 1.4 | 8.6 | 0 | 91 | 38 | 217 | 50.1 | 11.61 | 10.26 | 0.06 | 1.29 |
Enhanced Stats (5-on-5 unless denoted with *)
| Season | G/60 | A/60 | P/60 | IPP | ΔPEN/60 | 1A | 2A | EVS/60* | PPS/60* | SATF | SAT% | tEVSH% | tEVSV% | SHSV | ZS% |
|---|---|---|---|---|---|---|---|---|---|---|---|---|---|---|---|
| 23-24 | 0.33 | 0.67 | 1.00 | 60 | 0.00 | 4 | 0 | 5.5 | 0.0 | 326 | 46.5 | 6.4 | 0.889 | 953 | 44.6 |
| 22-23 | 0.38 | 0.94 | 1.31 | 75 | -0.65 | 5 | 5 | 5.3 | 0.0 | 481 | 44.9 | 7.2 | 0.954 | 1026 | 12.8 |
| 21-22 | 0.22 | 0.86 | 1.08 | 59 | -0.36 | 7 | 5 | 5.8 | 0.0 | 718 | 50.2 | 5.9 | 0.899 | 958 | 36.9 |
| 20-21 | 1.11 | 1.11 | 2.22 | 78 | -0.24 | 2 | 6 | 7.8 | 0.0 | 421 | 52.5 | 8.1 | 0.930 | 1011 | 58.7 |
| 19-20 | 0.62 | 0.53 | 1.15 | 57 | 0.00 | 2 | 4 | 7.7 | 0.0 | 634 | 52.2 | 6.4 | 0.912 | 976 | 56.3 |
Regression Meter
This meter measures whether or not a player's point production is being influenced by luck. Orange indicates the player has been lucky. Dark grey indicates the player has been unlucky.
2A/60
tEVSH%
SH%
IPP
PPSH%
Positional Data
| Season | Team | Left | Center | Right |
|---|---|---|---|---|
| 23-24 | NJD | 14 | 83 | 3 |
| 22-23 | BOS | 0 | 98 | 2 |
| 21-22 | BOS | 3 | 93 | 4 |
| 20-21 | VGK | 5 | 95 | 0 |
| 19-20 | VGK | 31 | 67 | 1 |
Most Common Linemates and Line Production
See also: New Jersey Devils Line Combo Tool | Line Production Tool
| Team | F1 | F2 | F3 | GF | GA | GF% | SATF | SATA | SAT% | USATF | USATA | USAT% | SH% | SV% | SHSV | ZS% |
|---|---|---|---|---|---|---|---|---|---|---|---|---|---|---|---|---|
| NJD | NOSEK | MERCER | PALAT | 3 | 2 | 60.0 | 82 | 69 | 54.3 | 63 | 47 | 57.3 | 6.8 | 0.941 | 1009 | 45.0 |
| NJD | NOSEK | HOLTZ | PALAT | 1 | 2 | 33.3 | 19 | 27 | 41.3 | 12 | 20 | 37.5 | 12.5 | 0.846 | 971 | 50.0 |
| NJD | NOSEK | HUGHES | PALAT | 1 | 1 | 50.0 | 18 | 13 | 58.1 | 9 | 9 | 50.0 | 14.3 | 0.800 | 943 | 66.7 |
Most Recent 10 Games
| OPP | G | A | P | +/- | PIM | SOG | SH% | H | BS | FW | FL | FO% | TOI | EVTOI | PPTOI | PKTOI | ID |
|---|---|---|---|---|---|---|---|---|---|---|---|---|---|---|---|---|---|
| NYI | 0 | 0 | 0 | -2 | 0 | 1 | 0 | 0 | 0 | 7 | 4 | 64 | 15:23 | 15:12 | 00:11 | 00:00 | 21288 |
| TOR | 0 | 0 | 0 | 0 | 0 | 1 | 0 | 0 | 1 | 5 | 4 | 56 | 17:30 | 15:36 | 00:00 | 01:54 | 21243 |
| NSH | 0 | 1 | 1 | 0 | 0 | 1 | 0 | 0 | 0 | 5 | 7 | 42 | 17:02 | 14:19 | 00:00 | 02:43 | 21233 |
| OTT | 0 | 0 | 0 | 1 | 0 | 2 | 0 | 2 | 0 | 6 | 6 | 50 | 15:06 | 14:19 | 00:00 | 00:47 | 21224 |
| NYR | 0 | 0 | 0 | -1 | 2 | 0 | 0 | 0 | 0 | 7 | 6 | 54 | 15:02 | 14:02 | 00:00 | 01:00 | 21198 |
| PIT | 0 | 1 | 1 | 0 | 0 | 2 | 0 | 0 | 1 | 5 | 5 | 50 | 17:07 | 16:00 | 00:00 | 01:07 | 21191 |
| BUF | 0 | 0 | 0 | 0 | 0 | 2 | 0 | 0 | 0 | 4 | 4 | 50 | 13:18 | 13:18 | 00:00 | 00:00 | 21164 |
| TOR | 0 | 0 | 0 | -2 | 0 | 2 | 0 | 2 | 2 | 8 | 2 | 80 | 15:53 | 15:42 | 00:11 | 00:00 | 21139 |
| NYI | 0 | 0 | 0 | 0 | 0 | 1 | 0 | 1 | 1 | 8 | 3 | 73 | 14:50 | 13:02 | 00:00 | 01:48 | 21126 |
| OTT | 1 | 0 | 1 | 0 | 0 | 3 | 33.3 | 0 | 1 | 2 | 5 | 29 | 16:55 | 13:36 | 00:00 | 03:19 | 21117 |
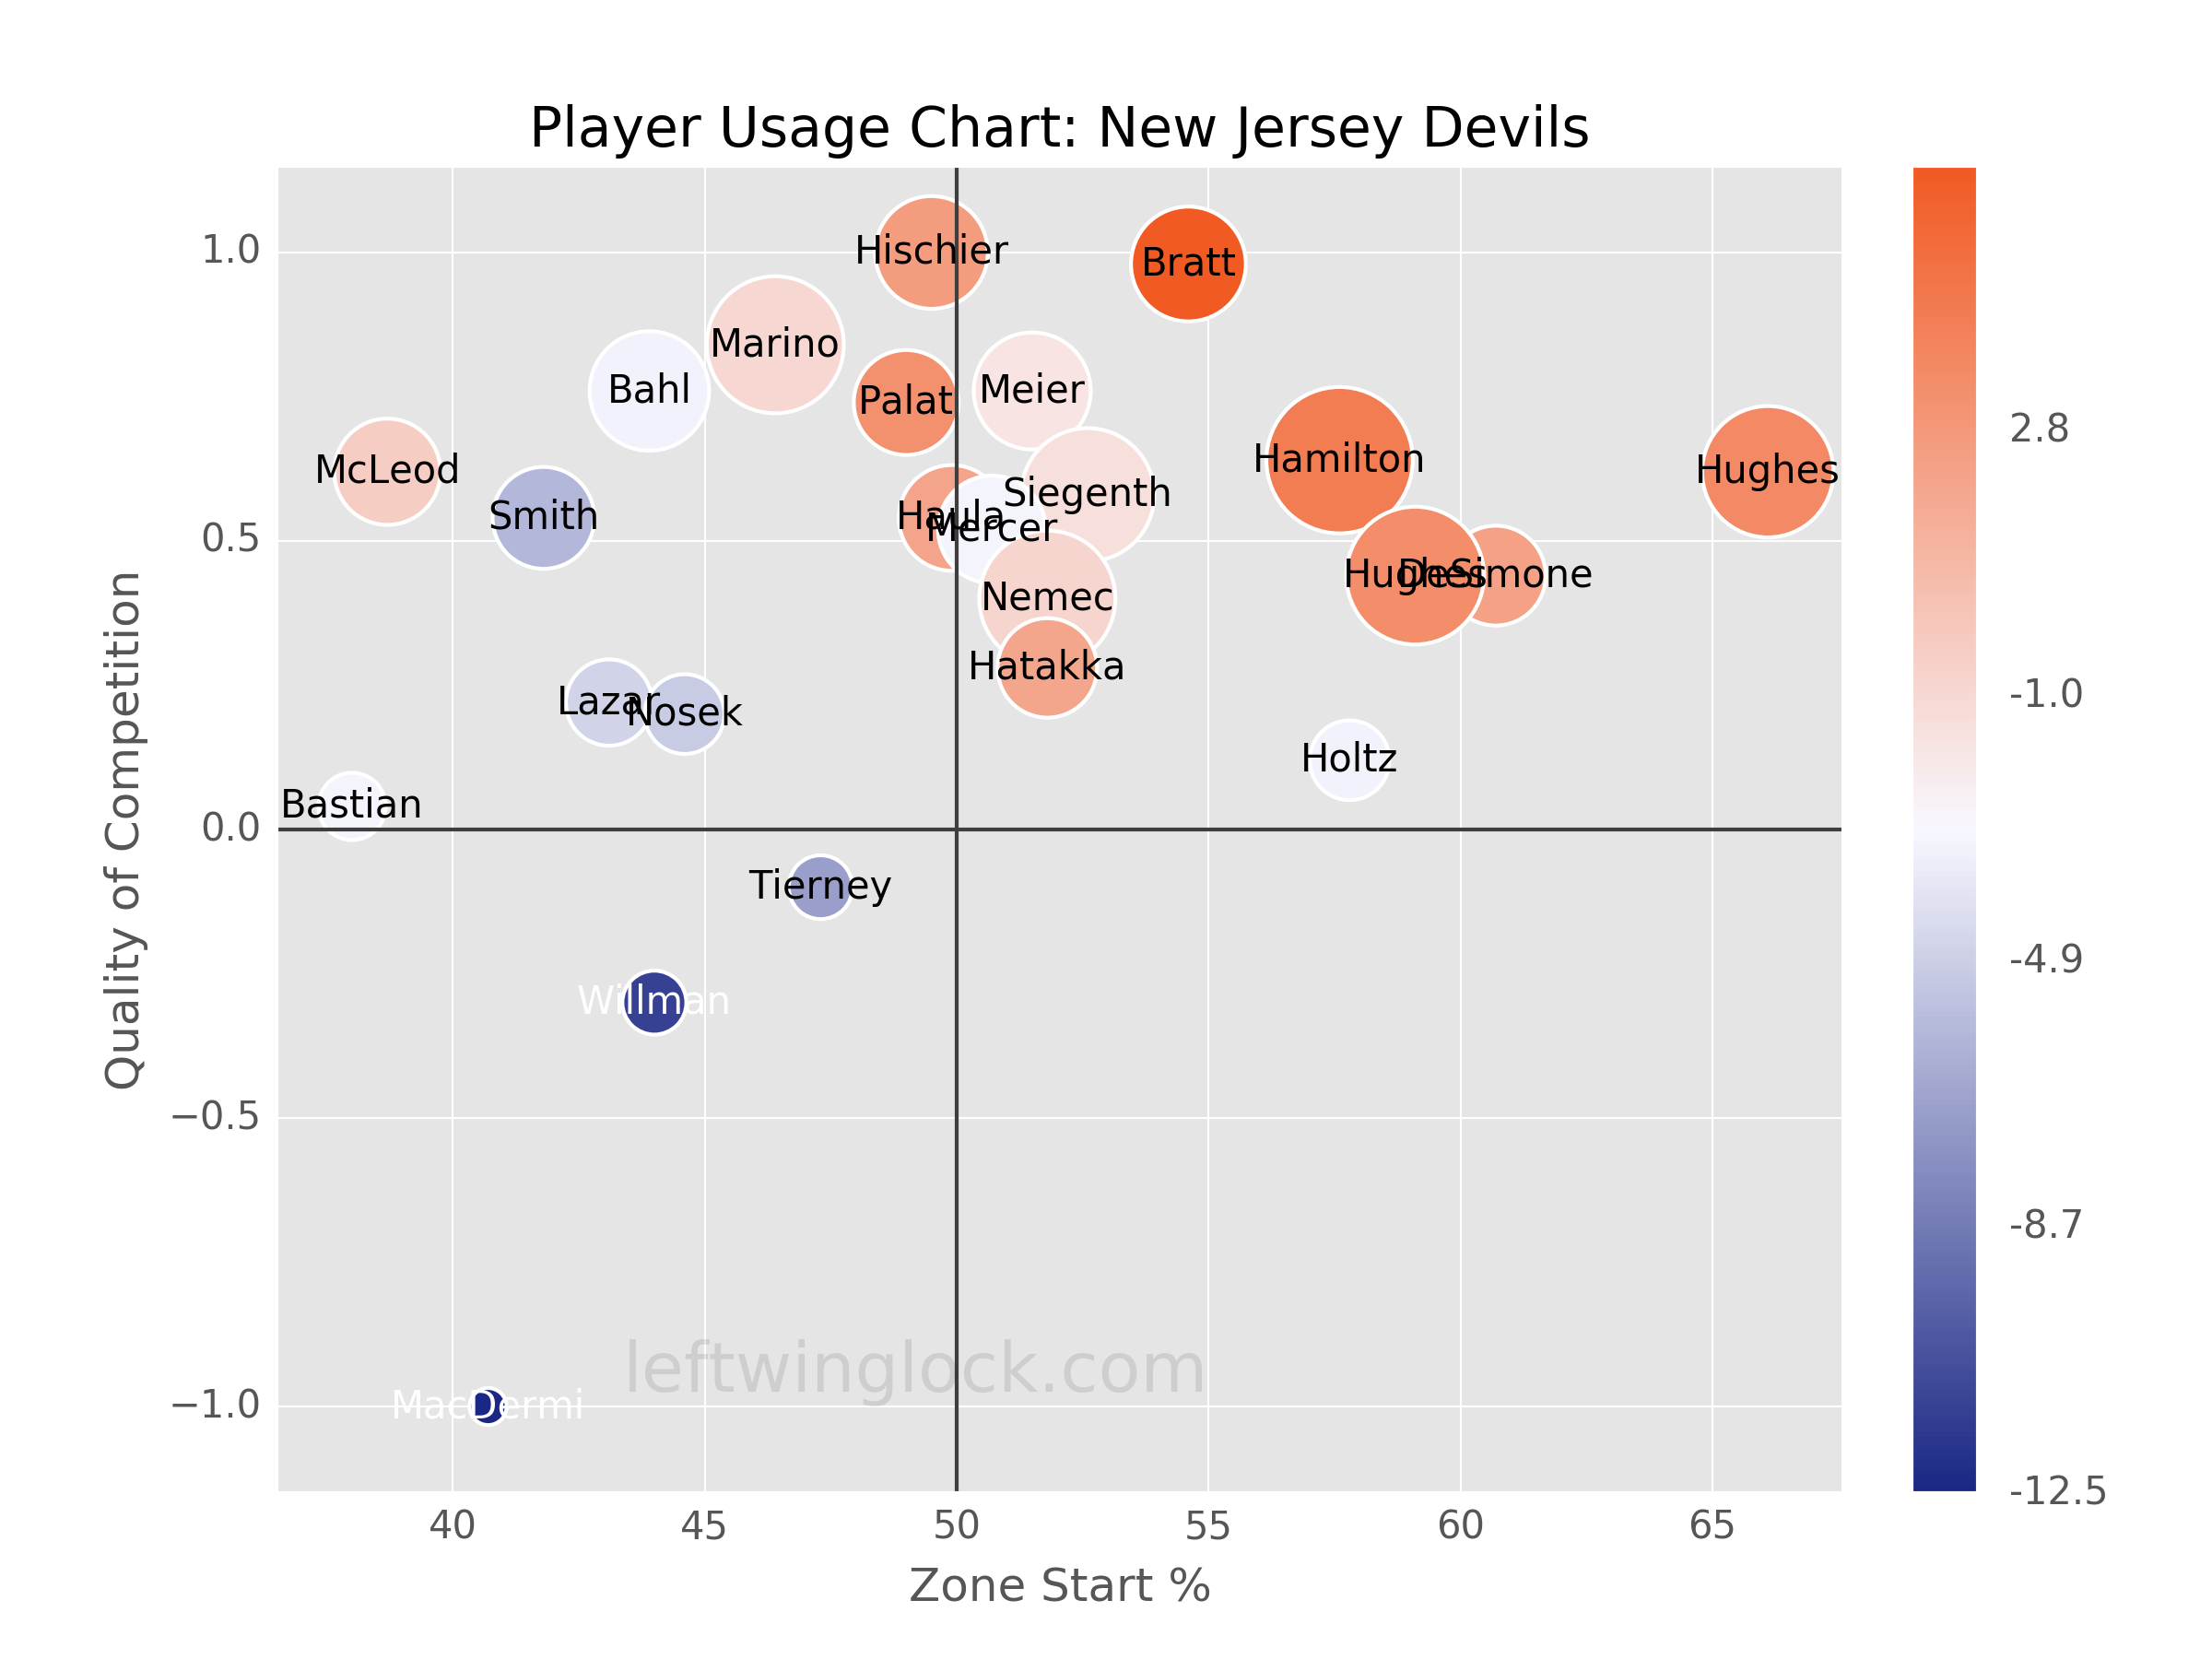
Player Usage Chart / Possession and Luck Chart