TOMAS TATAR
Explore projections, stats, news, player usage charts, and line combinations for members of the Seattle Kraken
-
Left Wing Leaders
2023 - 2024
Name PPG PPA PPP Artemi
Panarin11 33 44 Kirill Kaprizov 18 22 40 Filip Forsberg 13 19 32 Matthew Tkachuk 6 26 32 Kevin Fiala 11 19 30 Chris Kreider 18 11 29 Alex Ovechkin 13 15 28 Jason Robertson 9 19 28 Jesper Bratt 7 20 27 Brad Marchand 7 19 26 Matt Boldy 10 14 24 Jared McCann 9 14 23 -
Player Card
-
Seattle Kraken Leaders
2023 - 2024
Name G A Pts Jared
McCann29 32 61 Oliver Bjorkstrand 20 37 57 Vince Dunn 11 35 46 Jordan Eberle 17 27 44 Eeli Tolvanen 16 25 41 Matty Beniers 14 22 36 Yanni Gourde 9 22 31 Jaden Schwartz 13 17 30 Justin Schultz 7 18 25 Will Borgen 3 22 25 Tomas Tatar 9 15 24 Tye Kartye 10 9 19

News
-
Tomas Tatar
Is taking a maintenance day.
Feb 23, 2024 - 3:28 pm -
Tomas Tatar
Is expected to be in the lineup for today's game.
Dec 16, 2023 - 2:19 pm -
Tomas Tatar
Has been traded to the Seattle Kraken in exchange for a 2024 5th round draft pick.
Dec 15, 2023 - 7:03 pm -
Tomas Tatar
Is not expected to be in the lineup for today's game.
Nov 1, 2023 - 9:15 pm
Feature
-
Trending
Buy-Low and Sell-High: Skaters
Replies 0
Basic Stats
| Season | Team | GP | G | A | P | +/- | PIM | S | S/GP | SH% | PPP | H | BS | FW | FO% | TOI | EVTOI | PPTOI | PKTOI |
|---|---|---|---|---|---|---|---|---|---|---|---|---|---|---|---|---|---|---|---|
| 23-24 | SEA | 69 | 9 | 15 | 24 | 8 | 20 | 70 | 1 | 12.9 | 1 | 43 | 24 | 4 | 21.1 | 12.46 | 11.53 | 0.65 | 0.27 |
| 22-23 | NJD | 82 | 20 | 28 | 48 | 41 | 30 | 153 | 1.9 | 13.1 | 4 | 65 | 30 | 17 | 39.5 | 15.12 | 13.48 | 1.64 | 0.00 |
| 21-22 | NJD | 76 | 15 | 15 | 30 | -22 | 22 | 132 | 1.7 | 11.4 | 5 | 75 | 28 | 19 | 38.0 | 14.83 | 12.96 | 1.86 | 0.01 |
| 20-21 | MTL | 50 | 10 | 20 | 30 | 0 | 8 | 82 | 1.6 | 12.2 | 8 | 63 | 20 | 12 | 44.4 | 14.99 | 12.94 | 2.01 | 0.04 |
| 19-20 | MTL | 68 | 22 | 39 | 61 | 5 | 36 | 162 | 2.4 | 13.6 | 14 | 79 | 24 | 9 | 36.0 | 16.29 | 14.08 | 2.19 | 0.03 |
Enhanced Stats (5-on-5 unless denoted with *)
| Season | G/60 | A/60 | P/60 | IPP | ΔPEN/60 | 1A | 2A | EVS/60* | PPS/60* | SATF | SAT% | tEVSH% | tEVSV% | SHSV | ZS% |
|---|---|---|---|---|---|---|---|---|---|---|---|---|---|---|---|
| 23-24 | 0.69 | 1.00 | 1.69 | 60 | 0.21 | 5 | 8 | 4.9 | 6.7 | 775 | 50.7 | 9.7 | 0.929 | 1026 | 50.1 |
| 22-23 | 0.84 | 1.13 | 1.97 | 57 | -0.29 | 7 | 13 | 7.1 | 8.9 | 1188 | 57.4 | 9.2 | 0.938 | 1030 | 52.1 |
| 21-22 | 0.76 | 0.70 | 1.46 | 64 | 0.21 | 5 | 6 | 7.2 | 6.8 | 954 | 52.3 | 6.9 | 0.893 | 962 | 55.1 |
| 20-21 | 0.67 | 1.35 | 2.02 | 72 | 0.16 | 8 | 6 | 6.5 | 7.2 | 681 | 59.1 | 7.9 | 0.896 | 975 | 48.1 |
| 19-20 | 0.66 | 1.93 | 2.59 | 74 | -0.65 | 14 | 15 | 8.2 | 10.9 | 1140 | 60.1 | 8.4 | 0.902 | 986 | 50.0 |
Regression Meter
This meter measures whether or not a player's point production is being influenced by luck. Orange indicates the player has been lucky. Dark grey indicates the player has been unlucky.
2A/60
tEVSH%
SH%
IPP
PPSH%
Positional Data
| Season | Team | Left | Center | Right |
|---|---|---|---|---|
| 23-24 | SEA | 100 | 0 | 0 |
| 22-23 | NJ | 79 | 0 | 21 |
| 21-22 | NJ | 36 | 0 | 64 |
| 20-21 | MTL | 100 | 0 | 0 |
| 19-20 | MTL | 100 | 0 | 0 |
Most Common Linemates and Line Production
See also: Seattle Kraken Line Combo Tool | Line Production Tool
| Team | F1 | F2 | F3 | GF | GA | GF% | SATF | SATA | SAT% | USATF | USATA | USAT% | SH% | SV% | SHSV | ZS% |
|---|---|---|---|---|---|---|---|---|---|---|---|---|---|---|---|---|
| SEA | TATAR | BENIERS | EBERLE | 13 | 2 | 86.7 | 214 | 199 | 51.8 | 152 | 140 | 52.1 | 11.9 | 0.980 | 1099 | 43.7 |
| SEA | TATAR | EBERLE | MCCANN | 6 | 1 | 85.7 | 93 | 59 | 61.2 | 70 | 51 | 57.9 | 12.0 | 0.969 | 1089 | 44.4 |
| COL | TATAR | JOHANSEN | DROUIN | 6 | 3 | 66.7 | 78 | 85 | 47.9 | 54 | 64 | 45.8 | 16.2 | 0.921 | 1083 | 42.4 |
Most Recent 10 Games
| OPP | G | A | P | +/- | PIM | SOG | SH% | H | BS | FW | FL | FO% | TOI | EVTOI | PPTOI | PKTOI | ID |
|---|---|---|---|---|---|---|---|---|---|---|---|---|---|---|---|---|---|
| WPG | 1 | 0 | 1 | 1 | 0 | 1 | 100 | 2 | 0 | 0 | 0 | 0 | 12:37 | 12:20 | 00:11 | 00:06 | 21300 |
| DAL | 0 | 1 | 1 | 1 | 0 | 0 | 0 | 0 | 0 | 0 | 0 | 0 | 11:05 | 11:05 | 00:00 | 00:00 | 21271 |
| LAK | 0 | 0 | 0 | -2 | 0 | 1 | 0 | 0 | 0 | 0 | 0 | 0 | 10:37 | 09:41 | 00:56 | 00:00 | 21201 |
| MTL | 0 | 0 | 0 | -1 | 0 | 3 | 0 | 0 | 0 | 0 | 0 | 0 | 13:43 | 12:02 | 01:41 | 00:00 | 21133 |
| ARI | 0 | 0 | 0 | 0 | 0 | 2 | 0 | 0 | 0 | 0 | 0 | 0 | 09:39 | 09:39 | 00:00 | 00:00 | 21112 |
| VGK | 0 | 0 | 0 | 0 | 0 | 1 | 0 | 0 | 1 | 0 | 1 | 0 | 09:51 | 08:04 | 00:00 | 01:47 | 21107 |
| BUF | 0 | 0 | 0 | -2 | 0 | 1 | 0 | 1 | 0 | 0 | 0 | 0 | 10:21 | 08:47 | 01:34 | 00:00 | 21081 |
| NSH | 0 | 0 | 0 | 0 | 2 | 0 | 0 | 0 | 1 | 0 | 0 | 0 | 11:18 | 11:18 | 00:00 | 00:00 | 21071 |
| WSH | 0 | 0 | 0 | 0 | 0 | 0 | 0 | 0 | 1 | 0 | 1 | 0 | 13:28 | 13:28 | 00:00 | 00:00 | 21056 |
| VGK | 0 | 1 | 1 | 1 | 2 | 0 | 0 | 1 | 2 | 0 | 1 | 0 | 13:11 | 13:11 | 00:00 | 00:00 | 21040 |
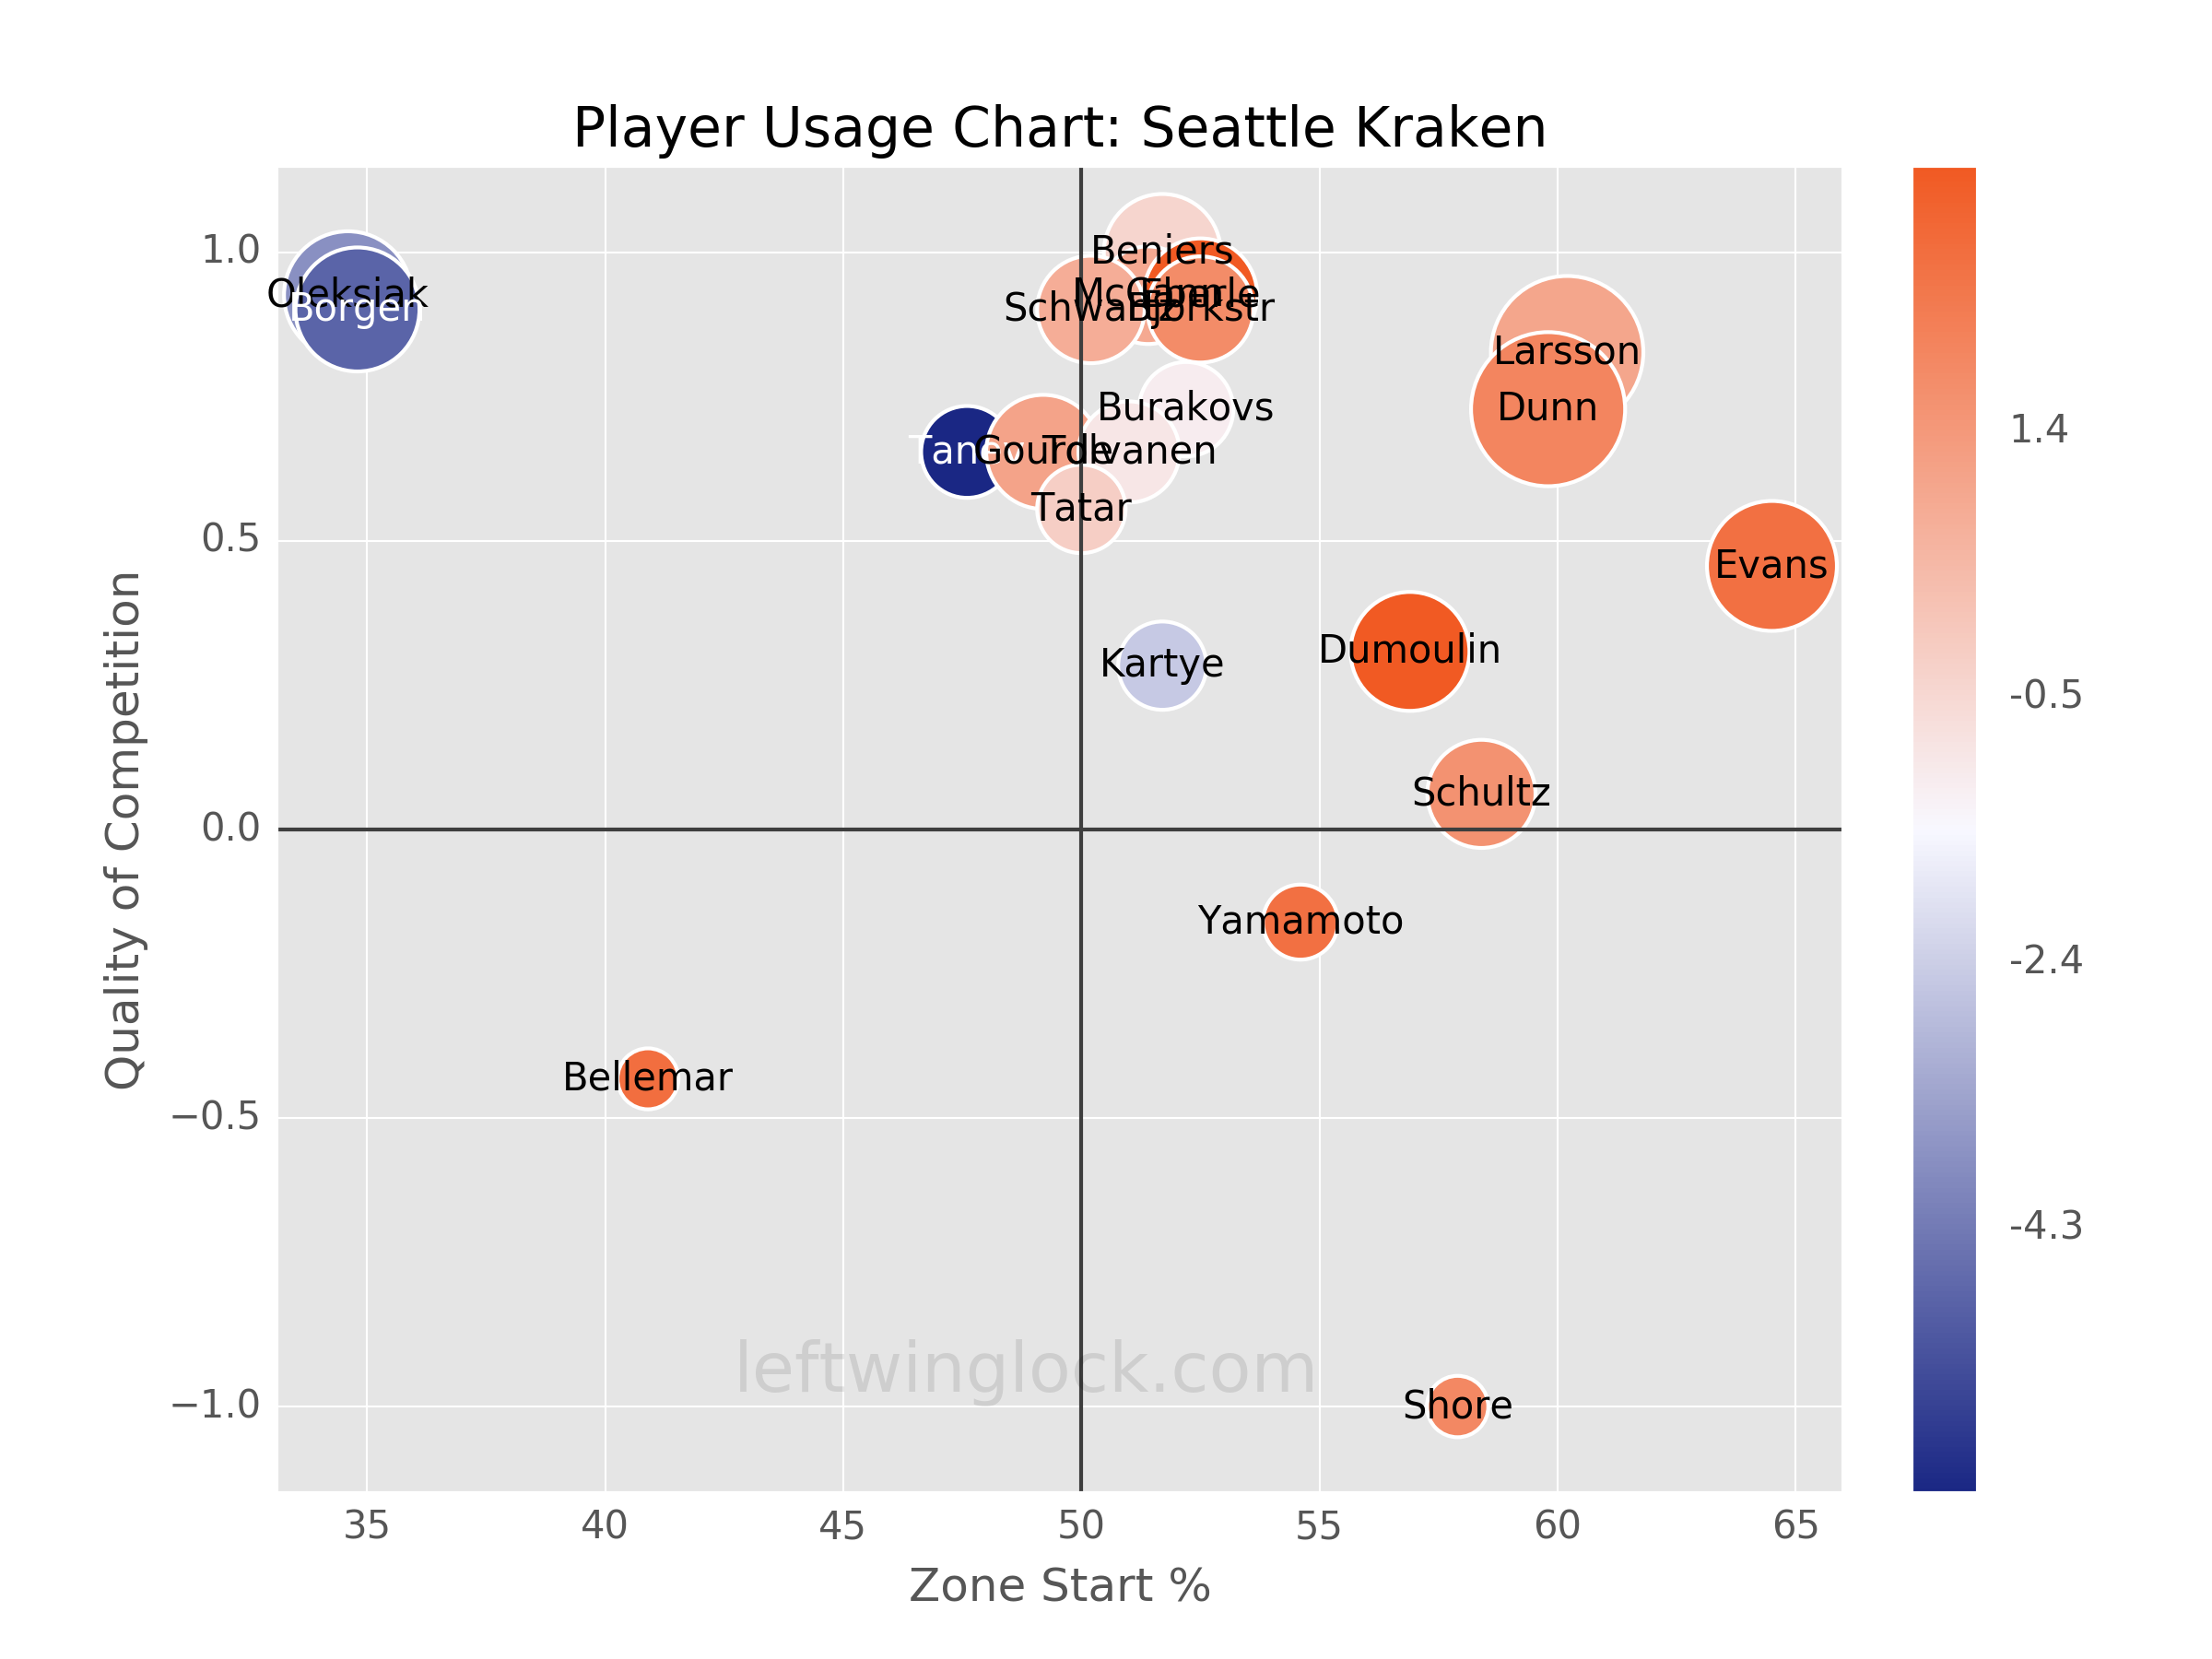
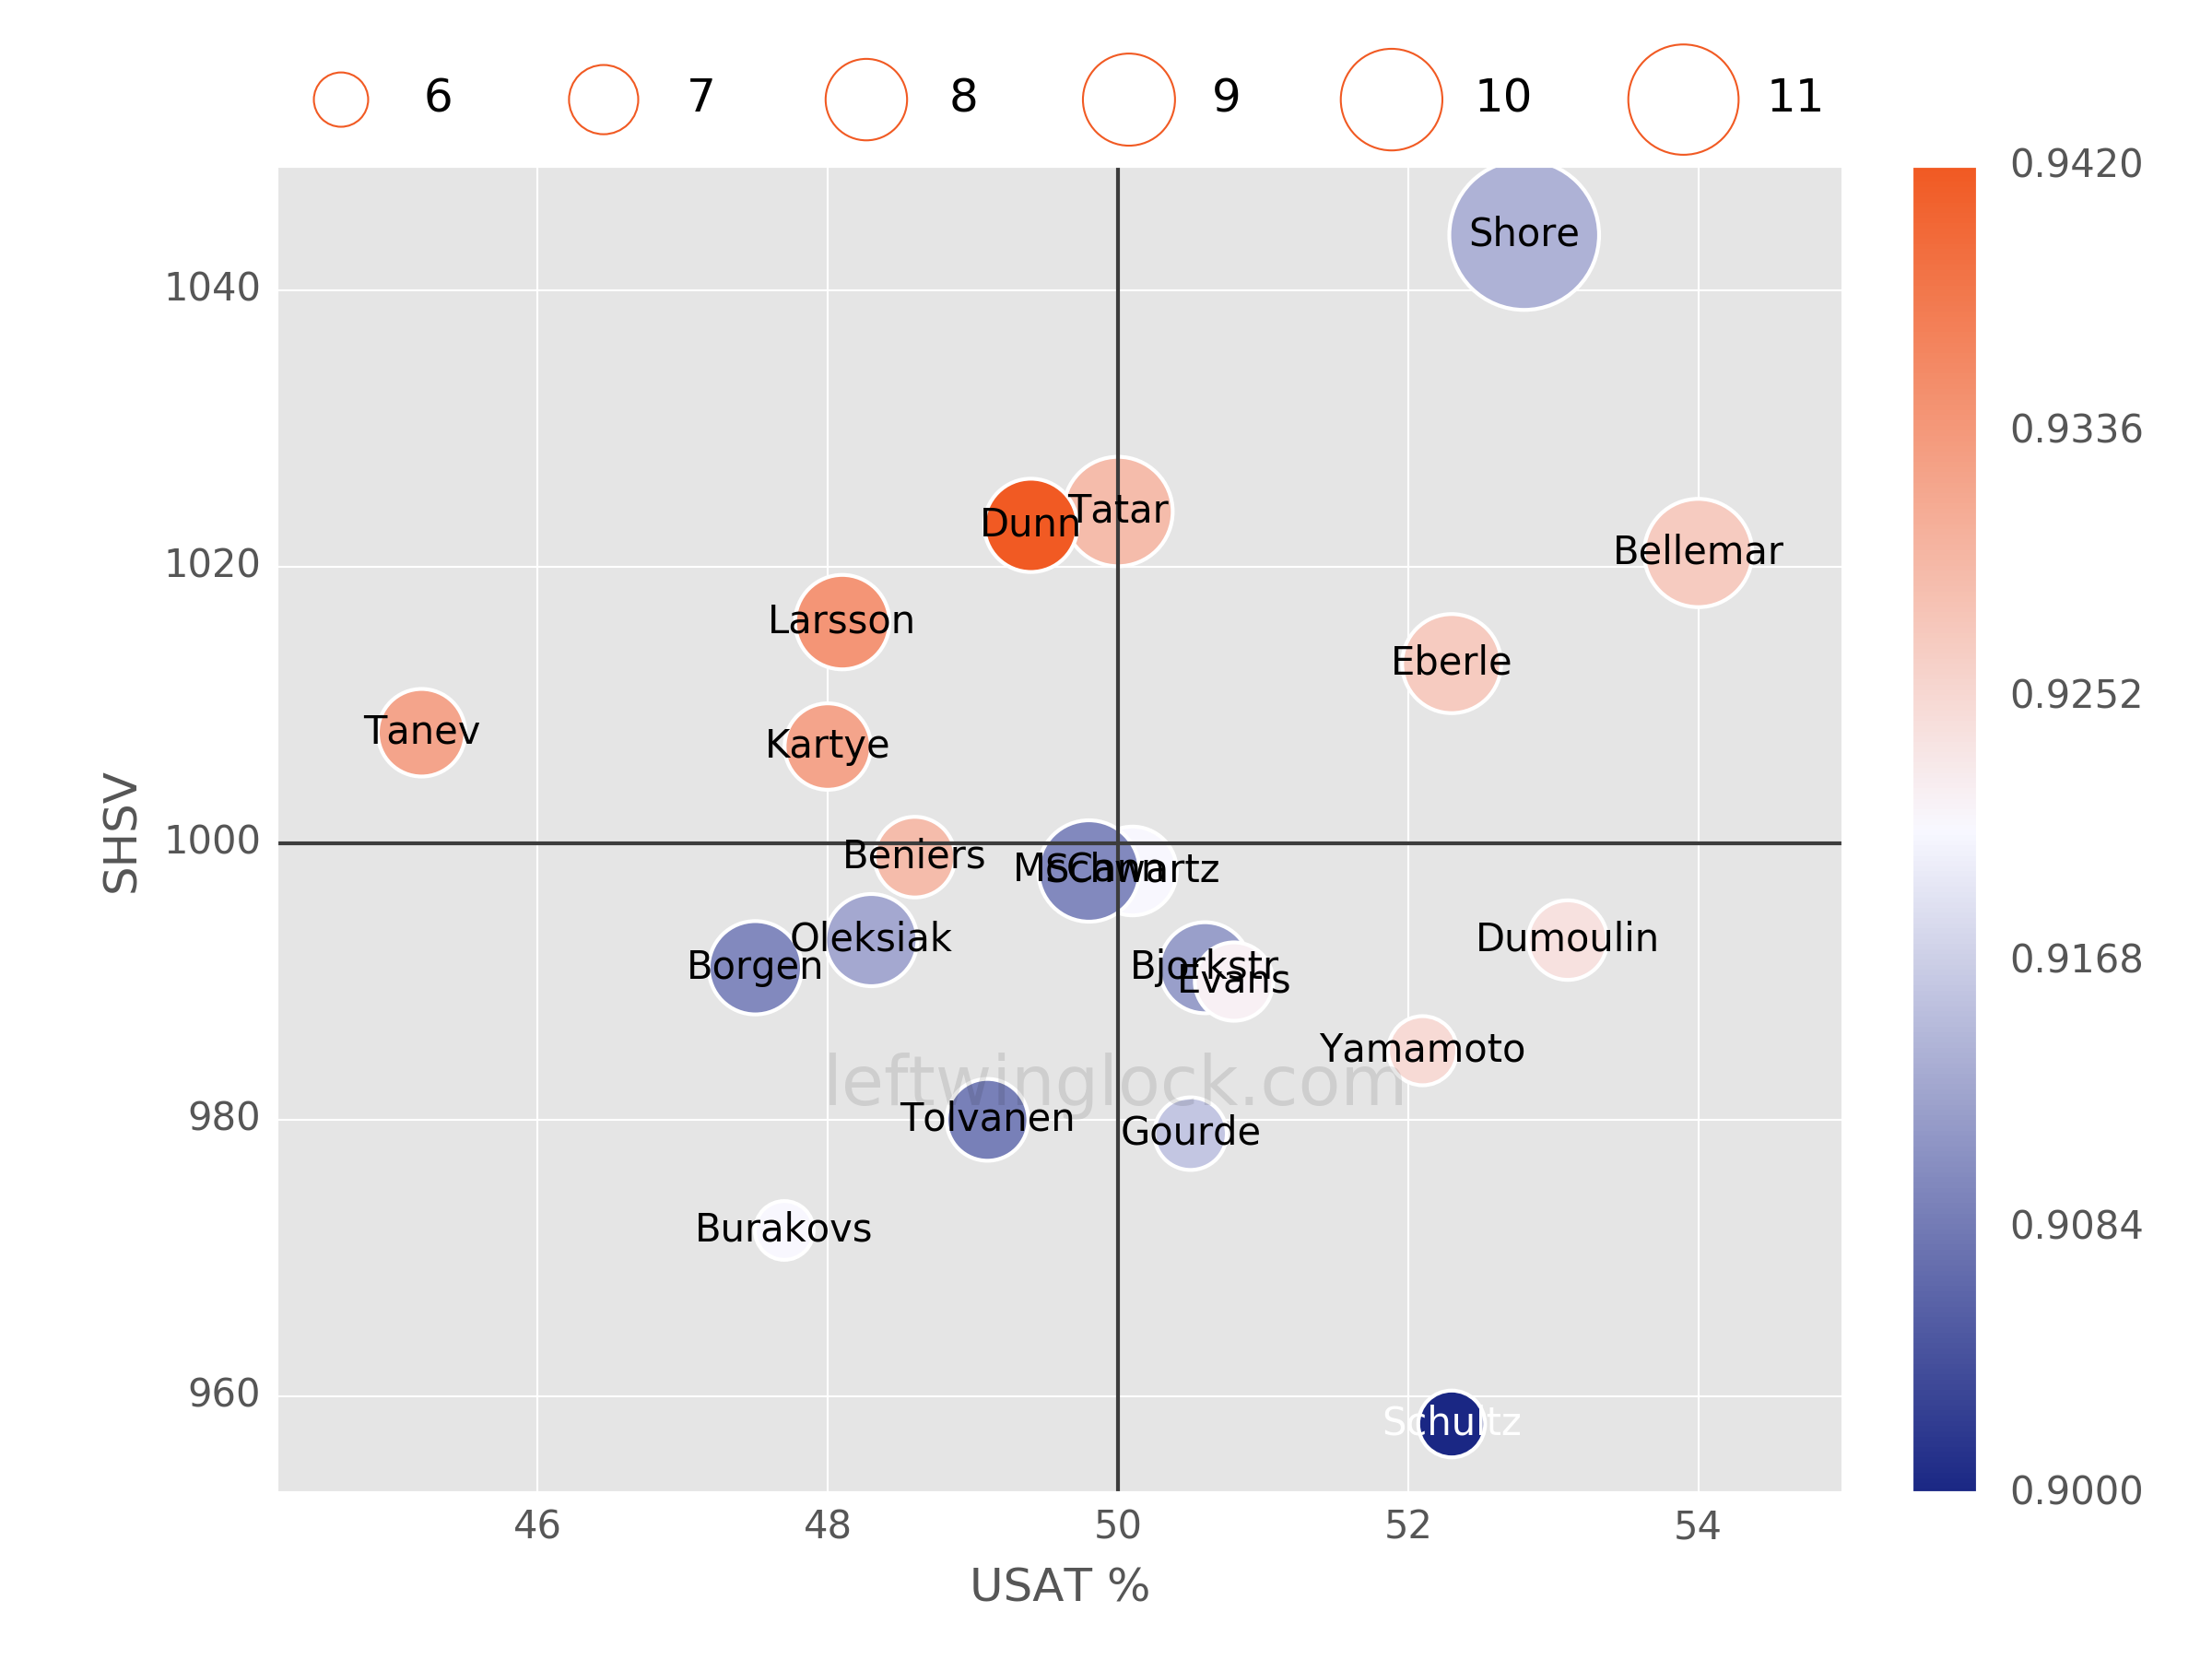
Player Usage Chart / Possession and Luck Chart