Tanner Laczynski
Explore projections, stats, news, player usage charts, and line combinations for members of the Philadelphia Flyers
-
Center Leaders
2023 - 2024
Name PPG PPA PPP Nathan
MacKinnon10 38 48 Connor McDavid 7 37 44 J.T. Miller 10 30 40 Leon Draisaitl 21 18 39 Steven Stamkos 19 20 39 Sam Reinhart 27 7 34 Brayden Point 15 17 32 Sebastian Aho 11 21 32 Elias Pettersson 13 18 31 Mika Zibanejad 12 19 31 Nick Suzuki 12 19 31 Jack Hughes 9 22 31 -
Player Card
-
Philadelphia Flyers Leaders
2023 - 2024
Name G A Pts Travis
Konecny33 35 68 Owen Tippett 28 25 53 Joel Farabee 22 28 50 Travis Sanheim 10 34 44 Morgan Frost 13 28 41 Scott Laughton 13 26 39 Sean Couturier 11 27 38 Tyson Foerster 20 13 33 Cam York 10 20 30 Cam Atkinson 13 15 28 Ryan Poehling 11 17 28 Ryan Johansen 13 10 23

News
-
Tanner Laczynski
Is not expected to be in the lineup for today's game.
Mar 21, 2023 - 10:26 am -
Tanner Laczynski
Has been activated from IR.
Mar 3, 2023 - 10:50 am -
Tanner Laczynski
Is considered week-to-week with a lower-body injury. He has been placed on IR.
Dec 6, 2022 - 2:20 pm -
Tanner Laczynski
Is expected to be in the lineup for today's game.
Dec 5, 2022 - 10:43 am
Feature
-
Trending
No articles available
Replies 0
Basic Stats
| Season | Team | GP | G | A | P | +/- | PIM | S | S/GP | SH% | PPP | H | BS | FW | FO% | TOI | EVTOI | PPTOI | PKTOI |
|---|---|---|---|---|---|---|---|---|---|---|---|---|---|---|---|---|---|---|---|
| 22-23 | PHI | 32 | 2 | 2 | 4 | -5 | 2 | 23 | 0.7 | 8.7 | 0 | 30 | 10 | 50 | 51.6 | 9.52 | 9.17 | 0.22 | 0.14 |
| 21-22 | PHI | 1 | 0 | 0 | 0 | -1 | 0 | 0 | 0 | 0.0 | 0 | 3 | 1 | 2 | 40.0 | 9.45 | 9.17 | 0.00 | 0.28 |
| 20-21 | PHI | 5 | 0 | 0 | 0 | 1 | 0 | 6 | 1.2 | 0.0 | 0 | 5 | 1 | 11 | 40.7 | 9.98 | 8.86 | 0.01 | 1.11 |
Enhanced Stats (5-on-5 unless denoted with *)
| Season | G/60 | A/60 | P/60 | IPP | ΔPEN/60 | 1A | 2A | EVS/60* | PPS/60* | SATF | SAT% | tEVSH% | tEVSV% | SHSV | ZS% |
|---|---|---|---|---|---|---|---|---|---|---|---|---|---|---|---|
| 22-23 | 0.41 | 0.21 | 0.62 | 75 | 0.20 | 1 | 0 | 4.8 | 0.0 | 209 | 44.0 | 3.6 | 0.924 | 960 | 48.0 |
| 21-22 | 0.00 | 0.00 | 0.00 | 0 | 0.00 | 0 | 0 | 0.0 | 0.0 | 5 | 41.6 | 0.0 | 0.800 | 0 | 0.0 |
| 20-21 | 0.00 | 0.00 | 0.00 | 0 | 0.00 | 0 | 0 | 8.3 | 0.0 | 28 | 44.4 | 4.5 | 0.000 | 0 | 31.8 |
Regression Meter
This meter measures whether or not a player's point production is being influenced by luck. Orange indicates the player has been lucky. Dark grey indicates the player has been unlucky.
2A/60
tEVSH%
SH%
IPP
PPSH%
Positional Data
| Season | Team | Left | Center | Right |
|---|---|---|---|---|
| 22-23 | PHI | 0 | 58 | 42 |
| 21-22 | PHI | 0 | 100 | 0 |
| 20-21 | PHI | 0 | 100 | 0 |
Most Common Linemates and Line Production
See also: Philadelphia Flyers Line Combo Tool | Line Production Tool
| Team | F1 | F2 | F3 | GF | GA | GF% | SATF | SATA | SAT% | USATF | USATA | USAT% | SH% | SV% | SHSV | ZS% |
|---|
Most Recent 10 Games
| OPP | G | A | P | +/- | PIM | SOG | SH% | H | BS | FW | FL | FO% | TOI | EVTOI | PPTOI | PKTOI | ID |
|---|
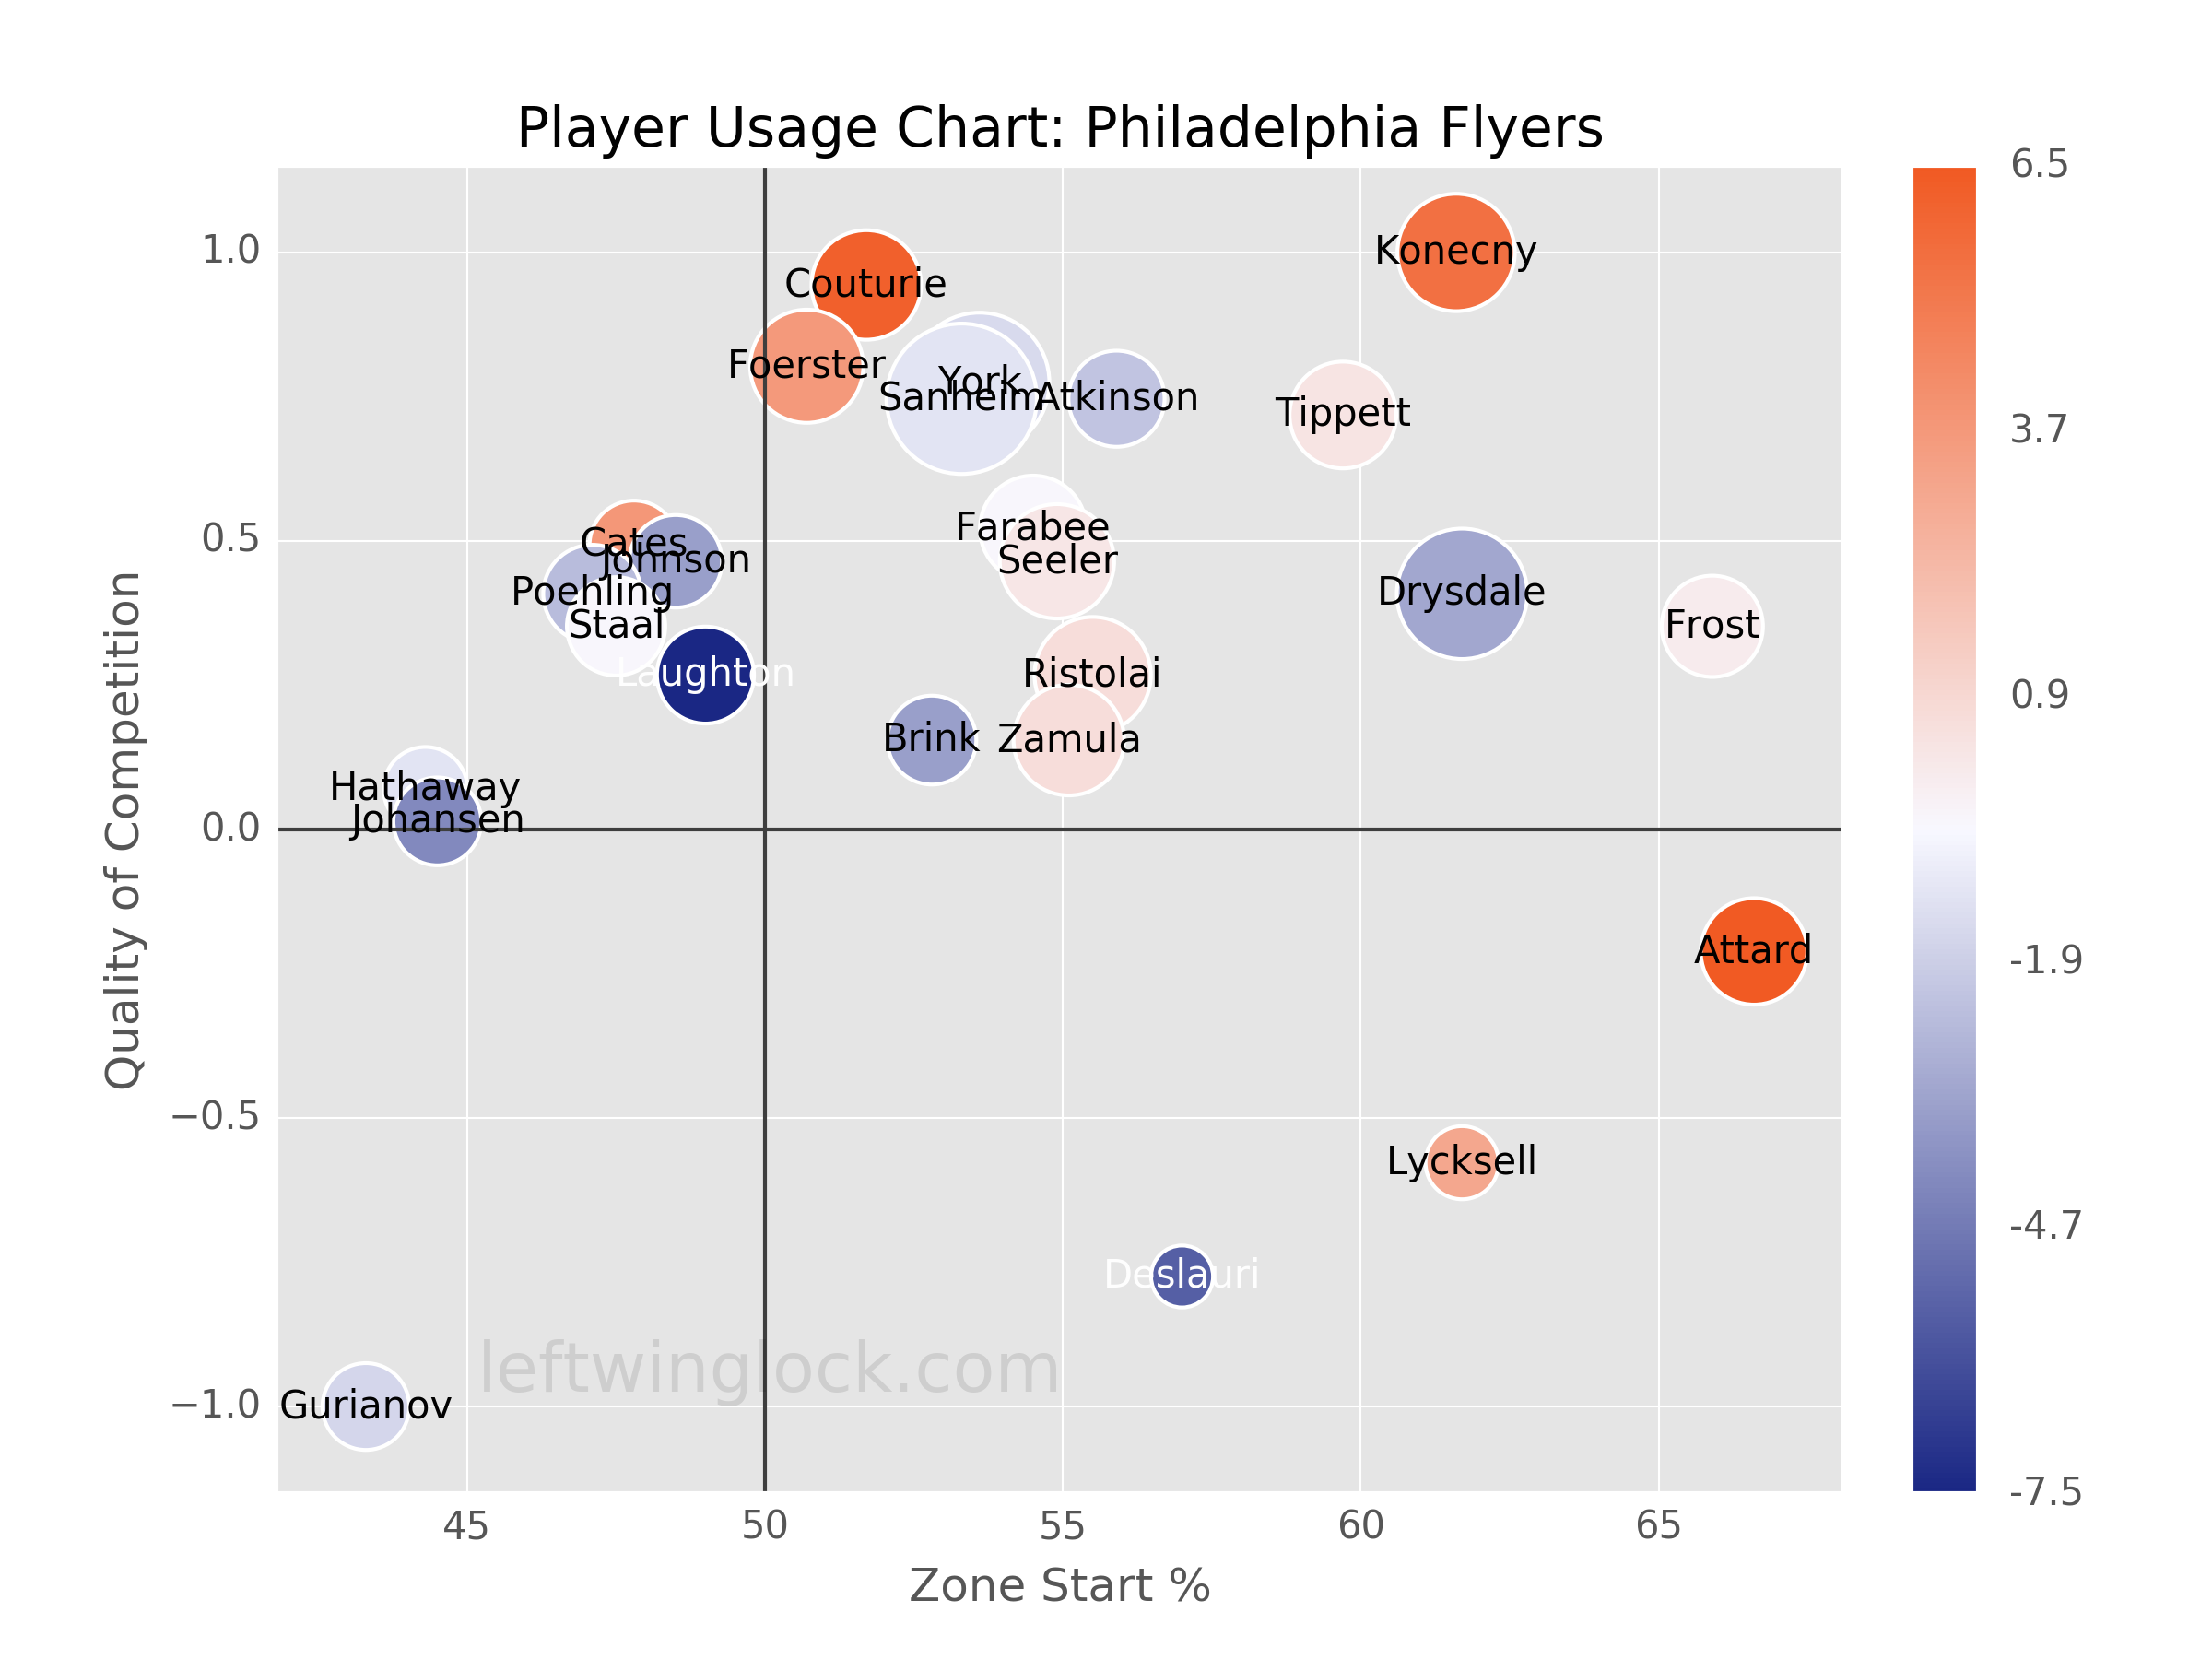
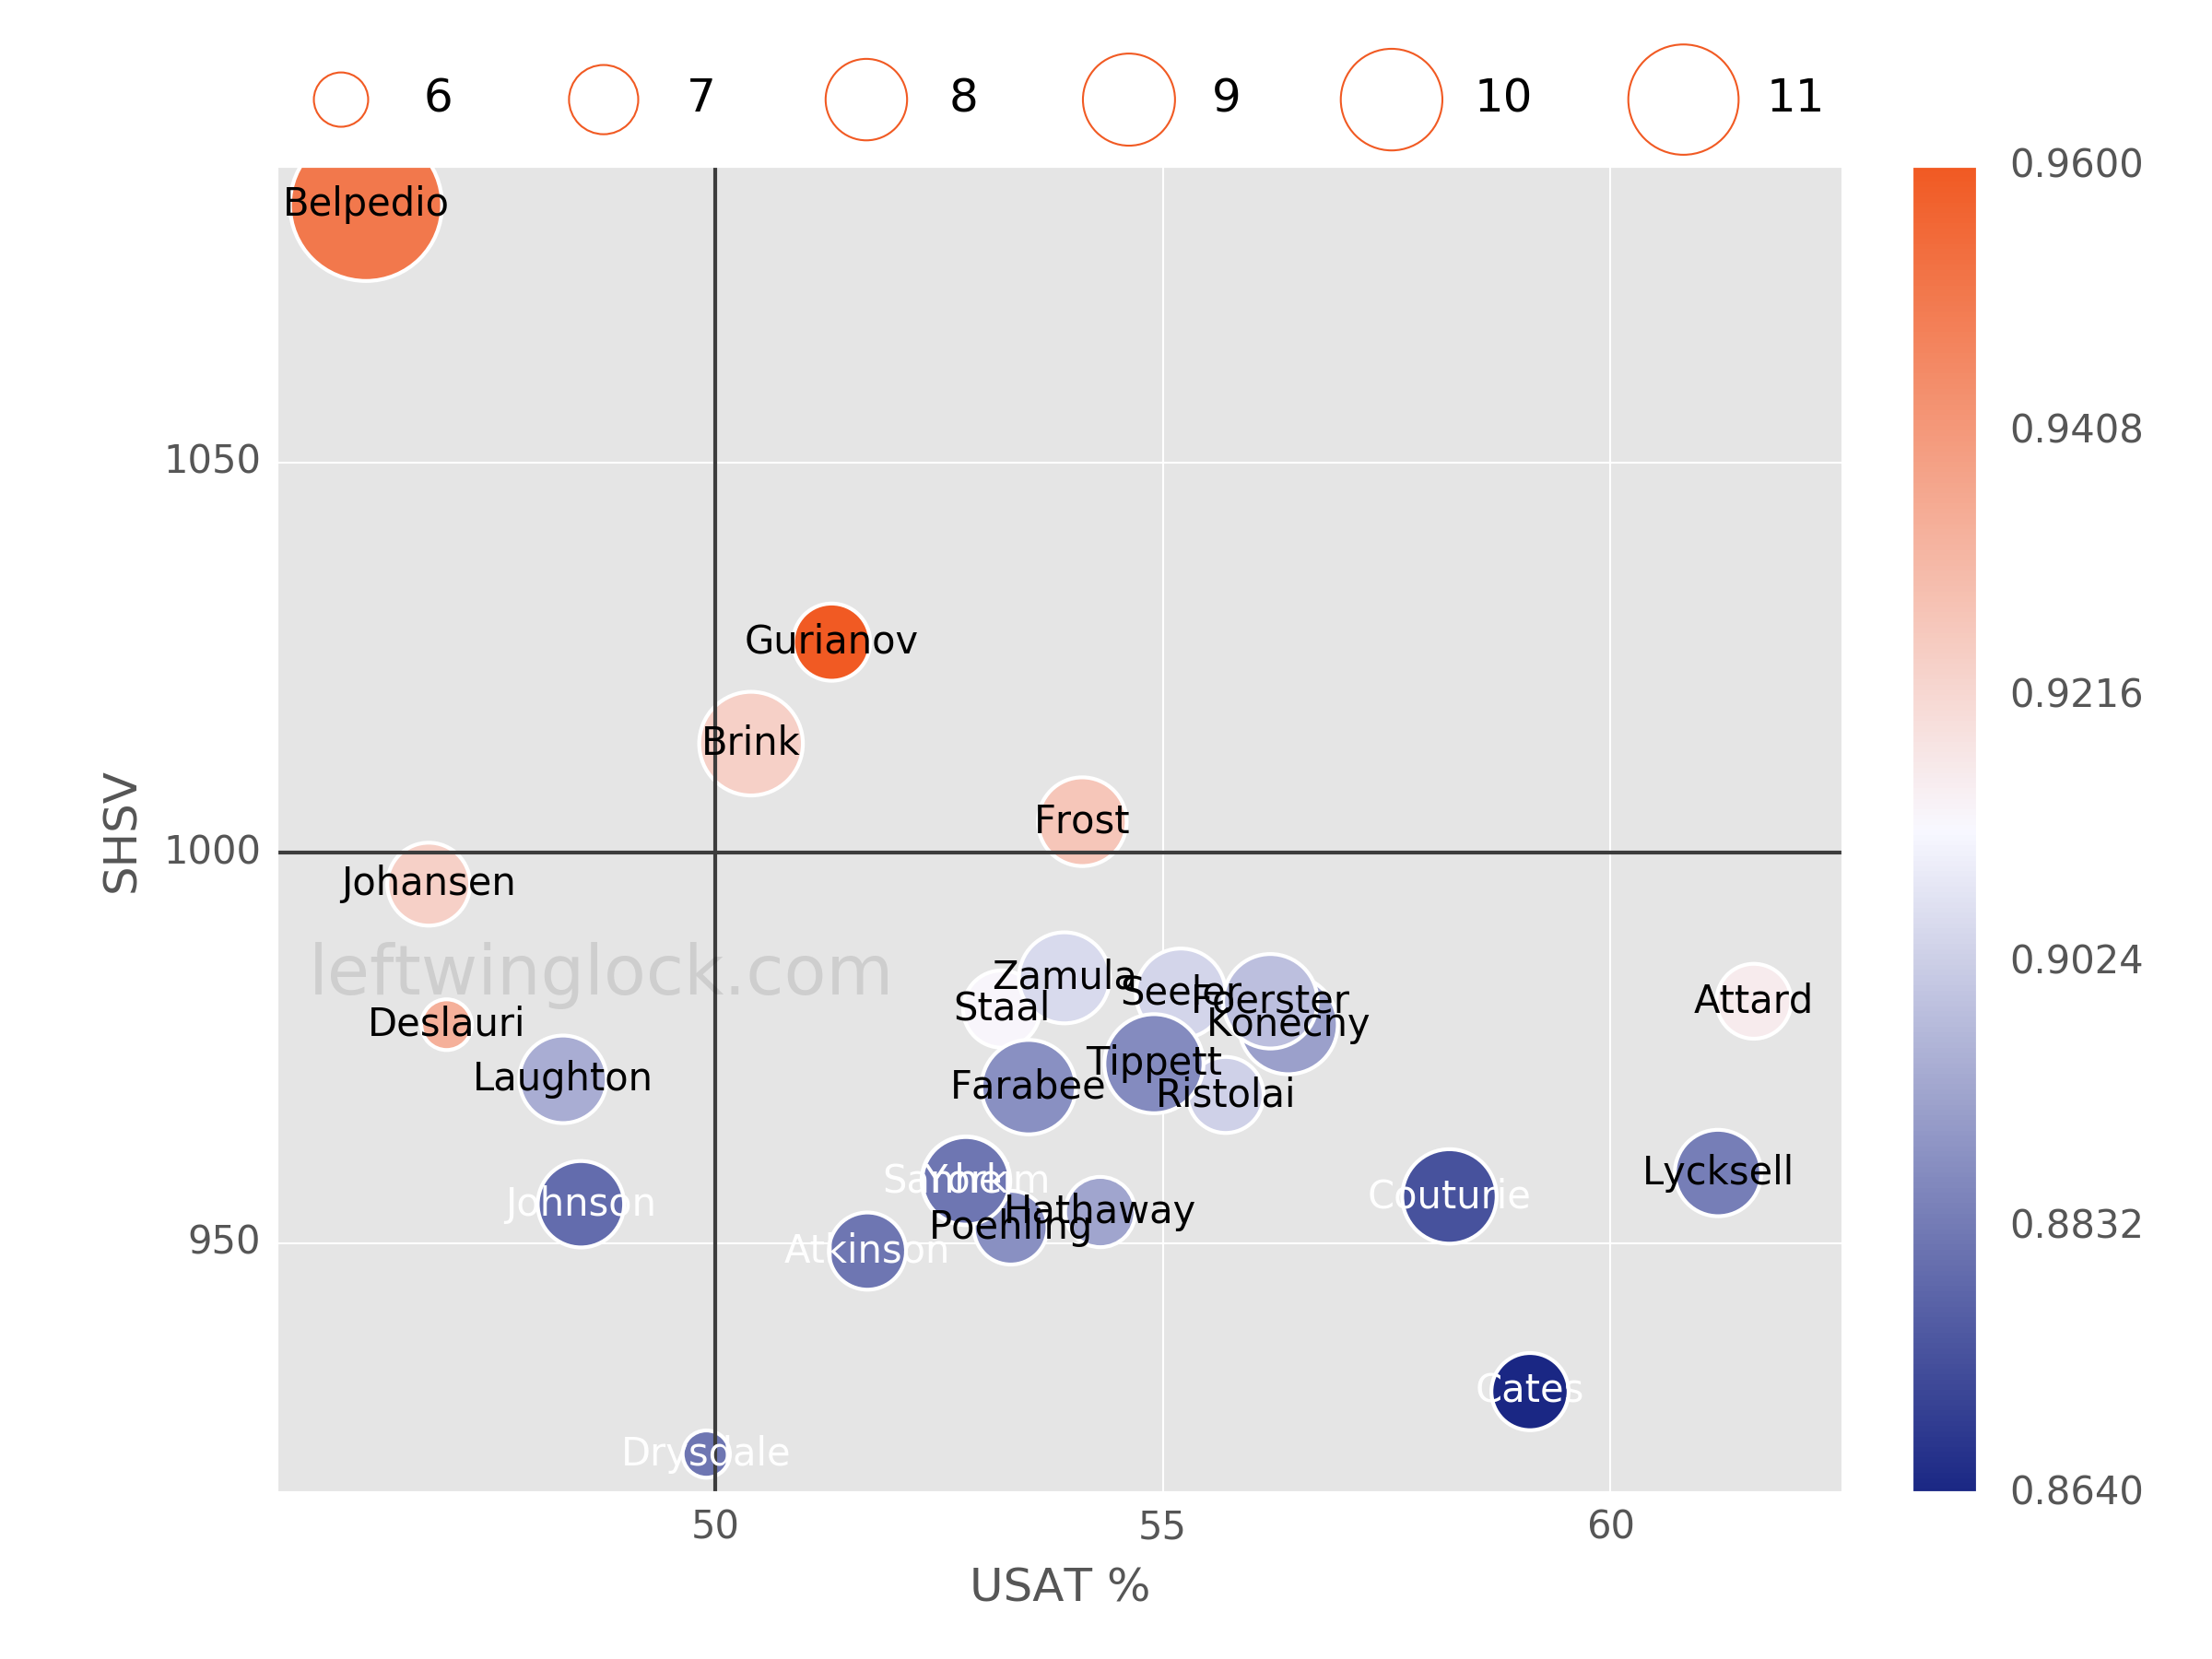
Player Usage Chart / Possession and Luck Chart