KEITH YANDLE
Explore projections, stats, news, player usage charts, and line combinations for members of the Philadelphia Flyers
-
Defenseman Leaders
2023 - 2024
Name PPG PPA PPP Cale
Makar7 32 39 Quinn Hughes 5 33 38 Evan Bouchard 8 27 35 Roman Josi 9 24 33 Adam Fox 6 27 33 Victor Hedman 4 27 31 Shayne Gostisbehere 2 27 29 Mike Matheson 5 23 28 Luke Hughes 4 21 25 Noah Dobson 1 23 24 John Carlson 6 15 21 Miro Heiskanen 2 19 21 -
Player Card
-
Philadelphia Flyers Leaders
2023 - 2024
Name G A Pts Travis
Konecny33 35 68 Owen Tippett 28 25 53 Joel Farabee 22 28 50 Travis Sanheim 10 34 44 Morgan Frost 13 28 41 Scott Laughton 13 26 39 Sean Couturier 11 27 38 Tyson Foerster 20 13 33 Cam York 10 20 30 Cam Atkinson 13 15 28 Ryan Poehling 11 17 28 Ryan Johansen 13 10 23

News
-
Keith Yandle
Has announced his retirement from professional hockey.
Sep 20, 2022 - 8:20 am -
Keith Yandle
Is expected to be in the lineup for today's game.
Apr 13, 2022 - 4:55 pm -
Keith Yandle
Is not expected to be in the lineup for today's game.
Apr 7, 2022 - 5:45 pm -
Keith Yandle
Is not expected to be in the lineup for today's game.
Apr 2, 2022 - 10:26 am
Feature
-
Trending
Finding Value at the D Position
Replies 0
Basic Stats
| Season | Team | GP | G | A | P | +/- | PIM | S | S/GP | SH% | PPP | H | BS | FW | FO% | TOI | EVTOI | PPTOI | PKTOI |
|---|---|---|---|---|---|---|---|---|---|---|---|---|---|---|---|---|---|---|---|
| 21-22 | PHI | 77 | 1 | 18 | 19 | -47 | 14 | 105 | 1.4 | 1.0 | 11 | 29 | 40 | 0 | 0.0 | 13.98 | 11.82 | 2.14 | 0.02 |
| 20-21 | FLA | 56 | 3 | 24 | 27 | -8 | 38 | 113 | 2 | 2.7 | 18 | 18 | 27 | 0 | 0.0 | 17.24 | 12.75 | 4.45 | 0.04 |
| 19-20 | FLA | 69 | 5 | 40 | 45 | 0 | 20 | 129 | 1.9 | 3.9 | 21 | 18 | 51 | 0 | 0.0 | 19.70 | 15.94 | 3.71 | 0.06 |
Enhanced Stats (5-on-5 unless denoted with *)
| Season | G/60 | A/60 | P/60 | IPP | ΔPEN/60 | 1A | 2A | EVS/60* | PPS/60* | SATF | SAT% | tEVSH% | tEVSV% | SHSV | ZS% |
|---|---|---|---|---|---|---|---|---|---|---|---|---|---|---|---|
| 21-22 | 0.00 | 0.55 | 0.54 | 33 | -0.22 | 3 | 5 | 4.3 | 14.2 | 774 | 45.3 | 5.6 | 0.903 | 959 | 59.4 |
| 20-21 | 0.18 | 0.62 | 0.79 | 33 | -0.81 | 3 | 4 | 5.5 | 11.3 | 680 | 56.2 | 6.7 | 0.903 | 970 | 71.8 |
| 19-20 | 0.11 | 1.09 | 1.20 | 43 | -0.22 | 10 | 9 | 4.5 | 9.6 | 962 | 48.1 | 8.9 | 0.933 | 1022 | 56.9 |
Regression Meter
This meter measures whether or not a player's point production is being influenced by luck. Orange indicates the player has been lucky. Dark grey indicates the player has been unlucky.
2A/60
tEVSH%
SH%
IPP
PPSH%
Positional Data
| Season | Team | Left | Center | Right |
|---|---|---|---|---|
| 21-22 | PHI | 100 | 0 | 0 |
| 20-21 | FLA | 100 | 0 | 0 |
| 19-20 | FLA | 100 | 0 | 0 |
Most Common Pairings and Pair Production
See also: Philadelphia Flyers Line Combos | Line Production Tool
| Team | D1 | D2 | GF | GA | GF% | SATF | SATA | SAT% | USATF | USATA | USAT% | SH% | SV% | SHSV | ZS% |
|---|
Most Recent 10 Games
| OPP | G | A | P | +/- | PIM | SOG | SH% | H | BS | FW | FL | FO% | TOI | EVTOI | PPTOI | PKTOI | ID |
|---|
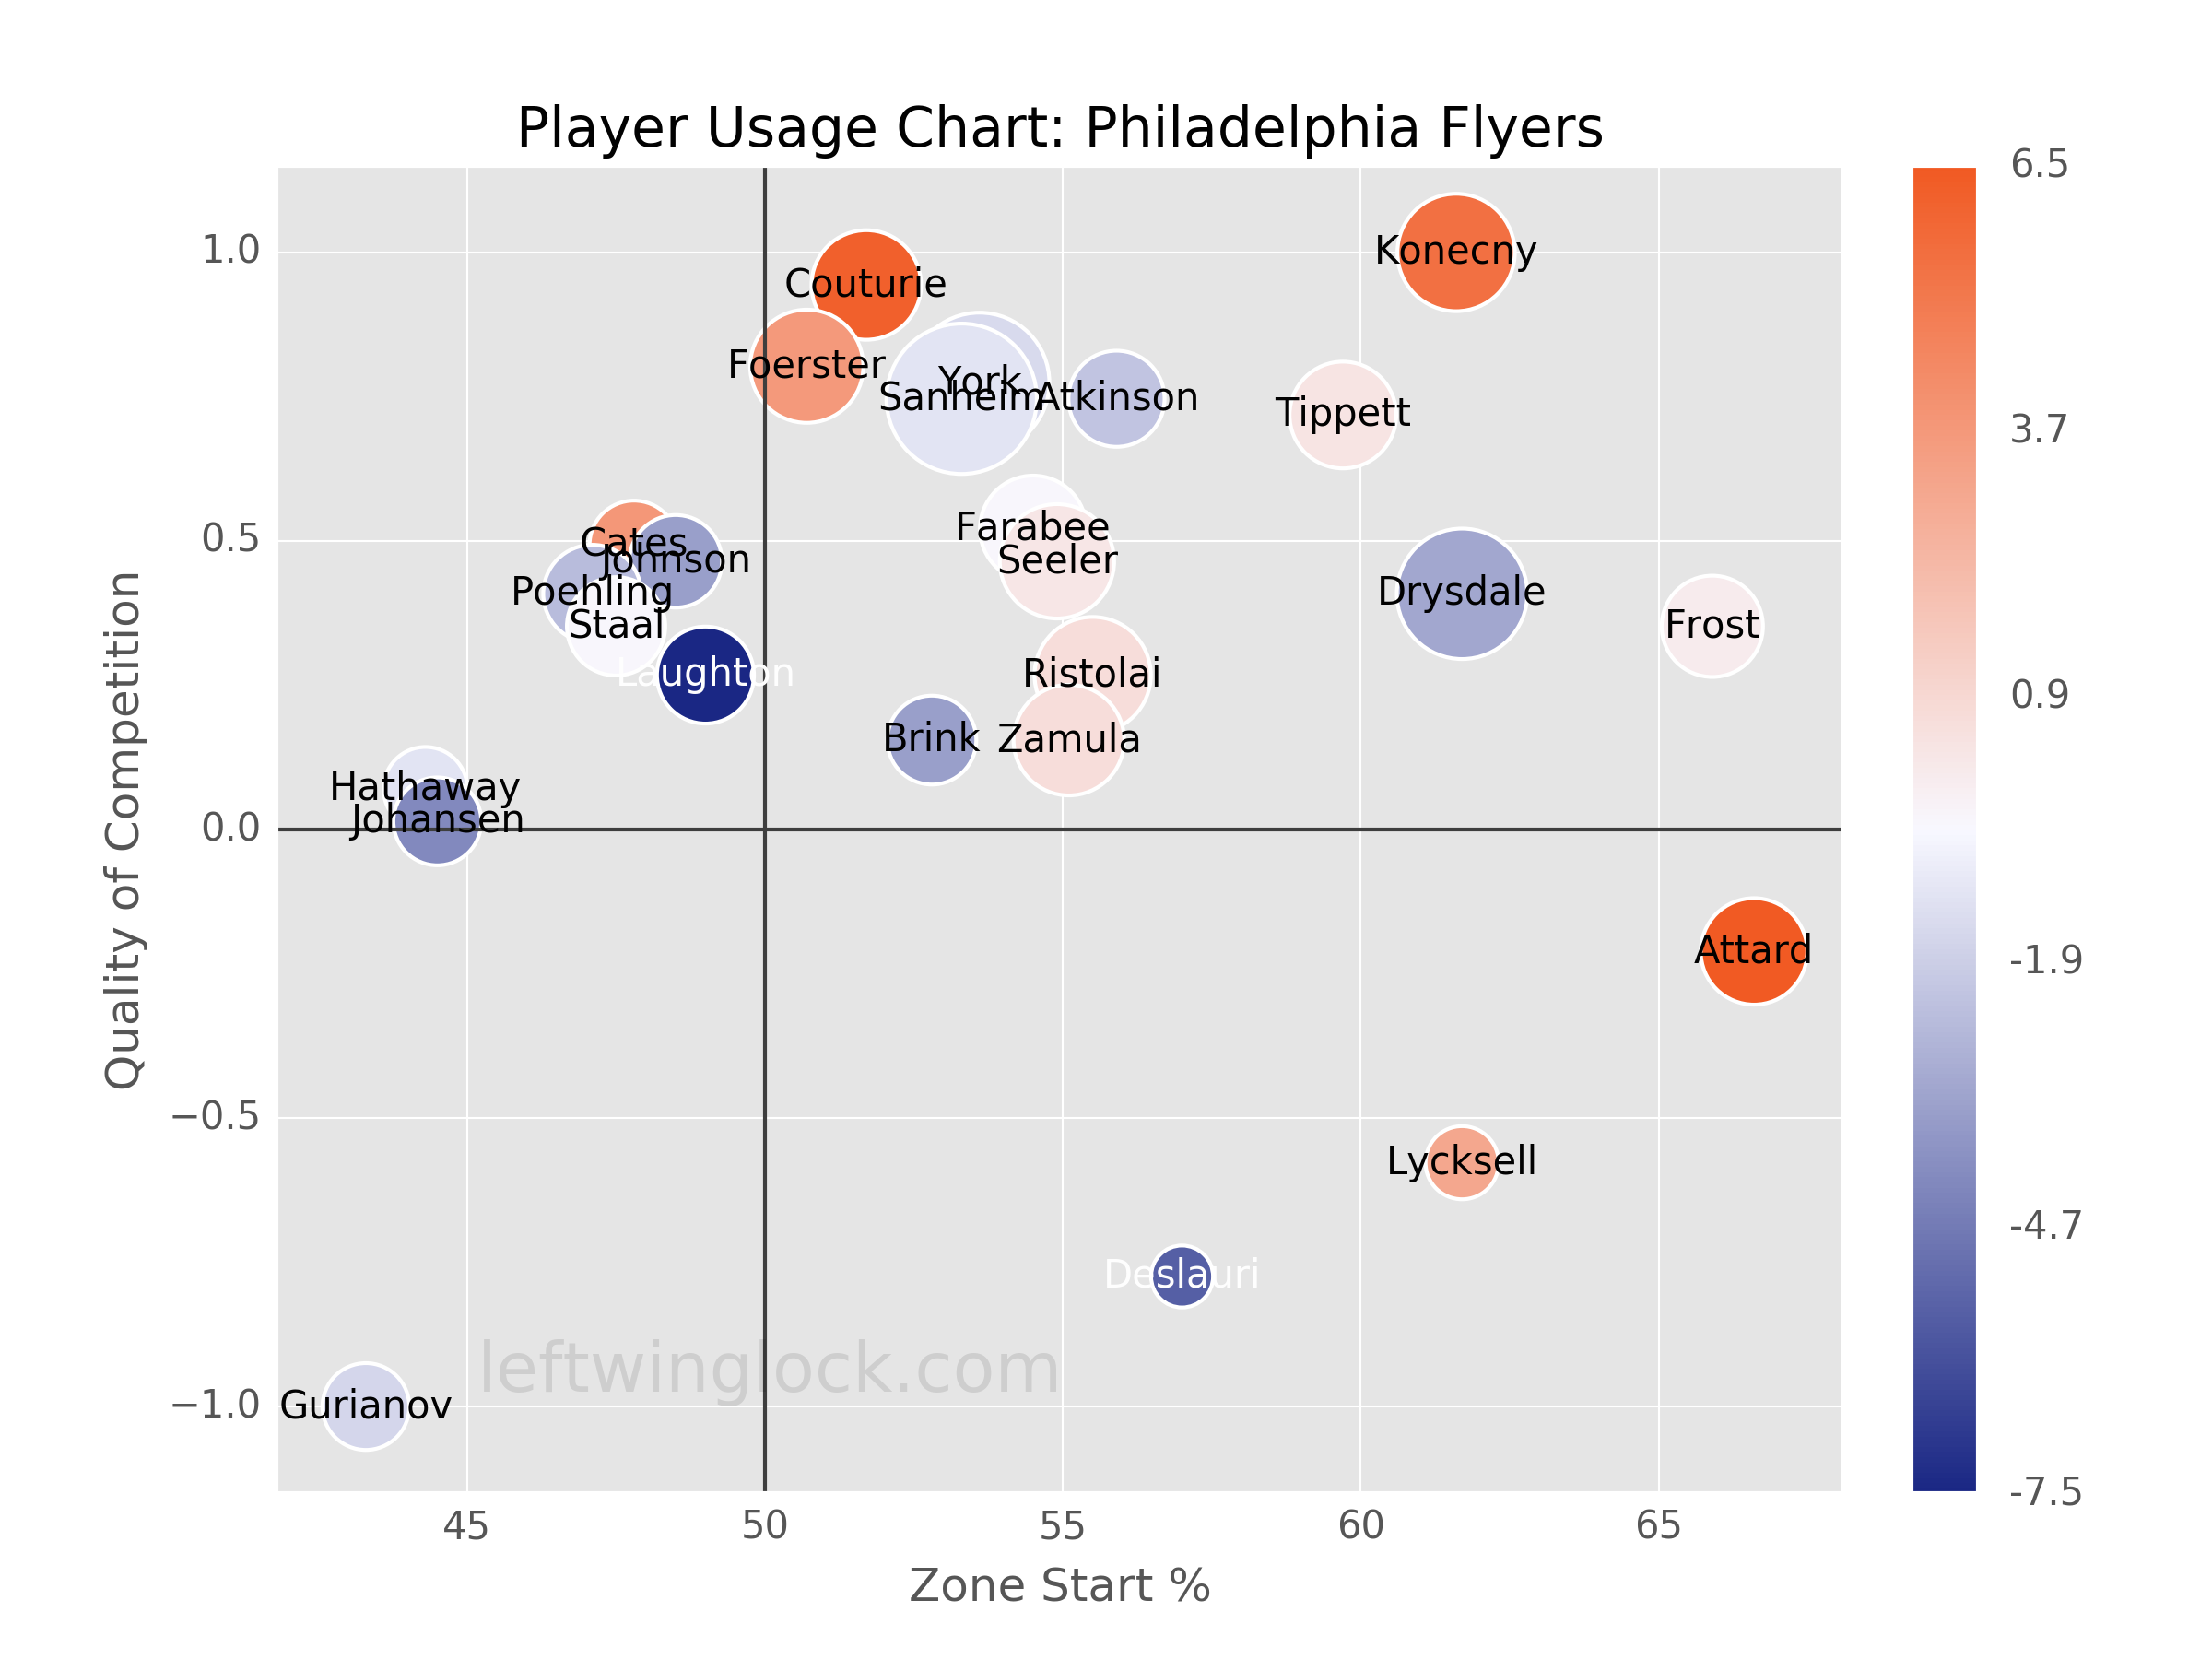
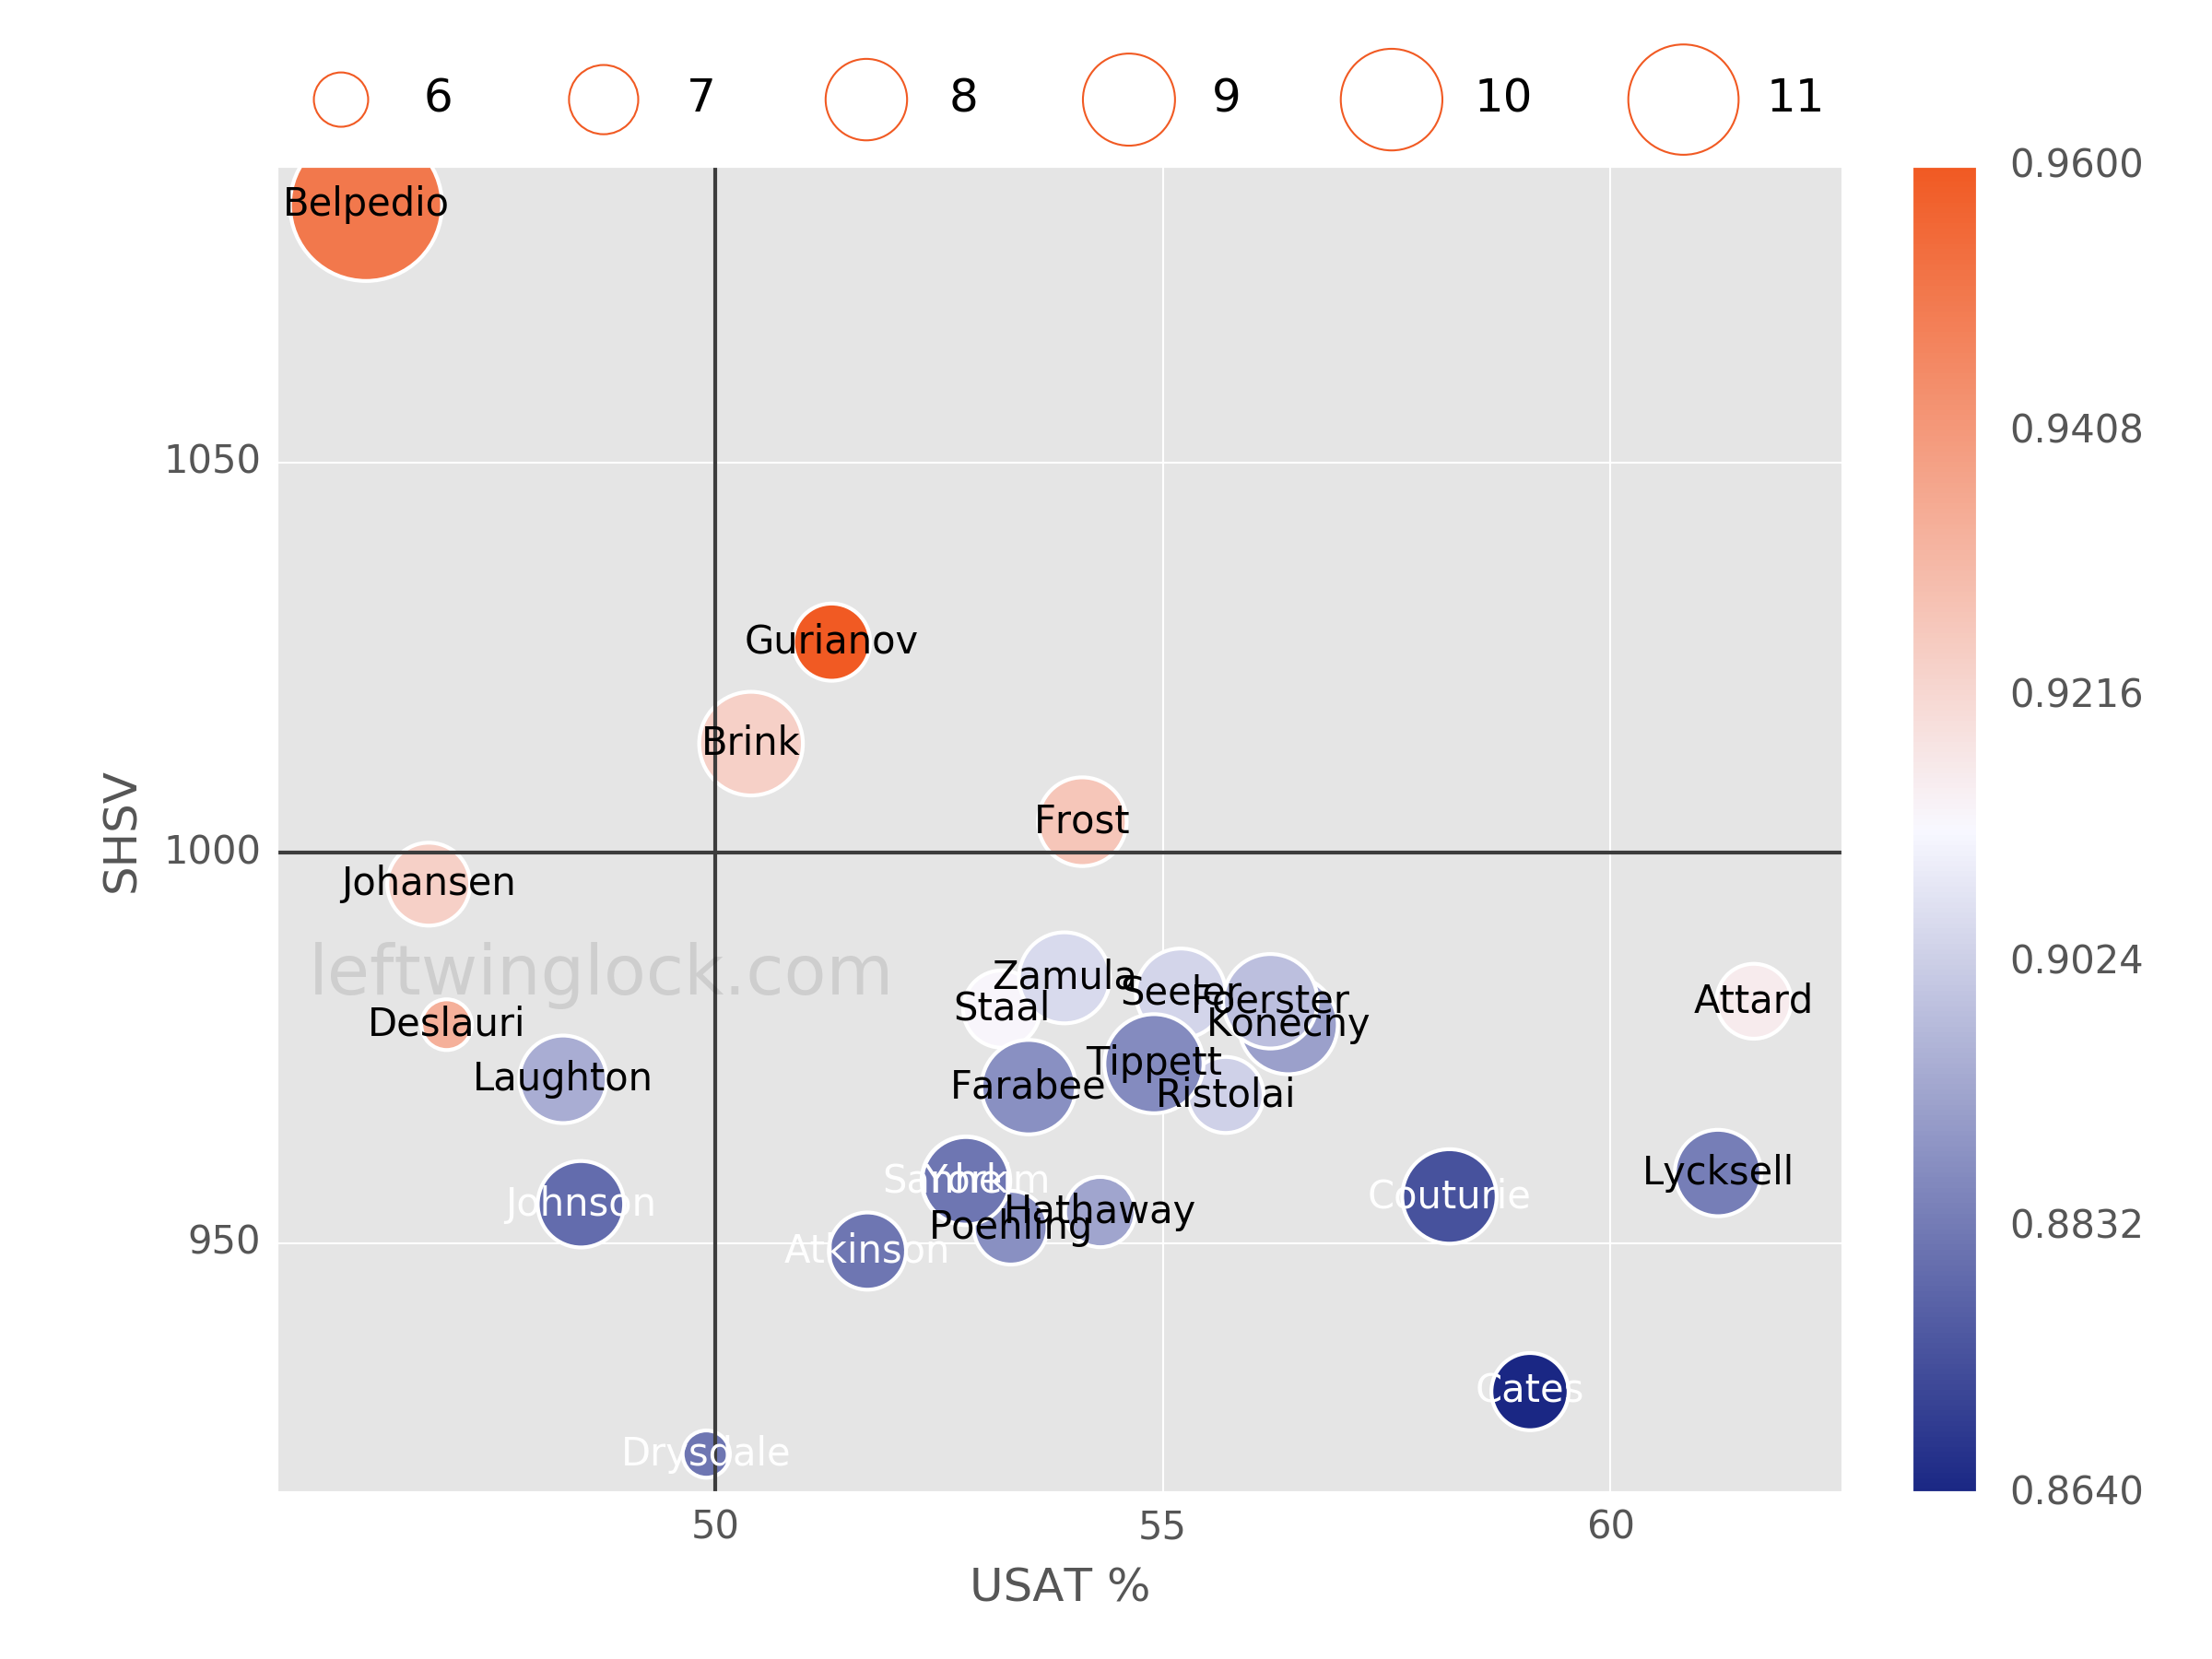
Player Usage Chart / Possession and Luck Chart