WADE ALLISON
Explore projections, stats, news, player usage charts, and line combinations for members of the Nashville Predators
-
Right Wing Leaders
2023 - 2024
Name PPG PPA PPP Nikita
Kucherov13 40 53 Mikko Rantanen 14 26 40 David Pastrnak 12 23 35 William Nylander 11 24 35 Mats Zuccarello 5 28 33 Clayton Keller 9 21 30 Mitch Marner 8 19 27 Adrian Kempe 5 22 27 Brock Boeser 16 9 25 Oliver Bjorkstrand 8 17 25 Drake Batherson 7 15 22 Valeri Nichushkin 16 5 21 -
Player Card
-
Nashville Predators Leaders
2023 - 2024
Name G A Pts Filip
Forsberg48 46 94 Roman Josi 23 62 85 Gustav Nyquist 23 52 75 Ryan O'Reilly 26 43 69 Tommy Novak 18 27 45 Luke Evangelista 16 23 39 Colton Sissons 15 20 35 Jason Zucker 14 18 32 Ryan McDonagh 3 29 32 Kiefer Sherwood 10 17 27 Cole Smith 9 14 23 Michael McCarron 12 10 22

News
-
Wade Allison
Has been traded to the Nashville Predators in exchange for Denis Gurianov.
Mar 8, 2024 - 1:45 pm -
Wade Allison
Is not expected to be in the lineup for today's game.
Jan 28, 2023 - 5:58 pm -
Wade Allison
Has suffered a lower-body injury and will not return to the game.
Jan 26, 2023 - 10:28 pm -
Wade Allison
Has been activated from IR.
Dec 20, 2022 - 4:35 pm
Feature
-
Trending
No articles available
Replies 0
Basic Stats
| Season | Team | GP | G | A | P | +/- | PIM | S | S/GP | SH% | PPP | H | BS | FW | FO% | TOI | EVTOI | PPTOI | PKTOI |
|---|---|---|---|---|---|---|---|---|---|---|---|---|---|---|---|---|---|---|---|
| 22-23 | PHI | 60 | 9 | 6 | 15 | -3 | 36 | 89 | 1.5 | 10.1 | 0 | 190 | 62 | 1 | 16.7 | 12.89 | 12.61 | 0.28 | 0.01 |
| 21-22 | PHI | 1 | 0 | 0 | 0 | -1 | 0 | 2 | 2 | 0.0 | 0 | 1 | 0 | 0 | 0.0 | 8.27 | 7.08 | 1.18 | 0.00 |
| 20-21 | PHI | 14 | 4 | 3 | 7 | 1 | 4 | 24 | 1.7 | 16.7 | 1 | 28 | 10 | 0 | 0.0 | 12.93 | 11.25 | 1.67 | 0.01 |
Enhanced Stats (5-on-5 unless denoted with *)
| Season | G/60 | A/60 | P/60 | IPP | ΔPEN/60 | 1A | 2A | EVS/60* | PPS/60* | SATF | SAT% | tEVSH% | tEVSV% | SHSV | ZS% |
|---|---|---|---|---|---|---|---|---|---|---|---|---|---|---|---|
| 22-23 | 0.72 | 0.40 | 1.12 | 61 | -0.31 | 1 | 4 | 7.0 | 7.3 | 687 | 46.6 | 5.7 | 0.935 | 992 | 46.9 |
| 21-22 | 0.00 | 0.00 | 0.00 | 0 | 0.00 | 0 | 0 | 0.0 | 0.0 | 8 | 61.5 | 0.0 | 0.666 | 0 | 66.6 |
| 20-21 | 0.77 | 1.16 | 1.93 | 100 | -0.33 | 2 | 1 | 7.3 | 10.3 | 141 | 53.8 | 6.1 | 0.933 | 994 | 50.0 |
Regression Meter
This meter measures whether or not a player's point production is being influenced by luck. Orange indicates the player has been lucky. Dark grey indicates the player has been unlucky.
2A/60
tEVSH%
SH%
IPP
PPSH%
Positional Data
| Season | Team | Left | Center | Right |
|---|---|---|---|---|
| 22-23 | PHI | 0 | 0 | 100 |
| 21-22 | PHI | 0 | 0 | 100 |
| 20-21 | PHI | 0 | 0 | 100 |
Most Common Linemates and Line Production
See also: Nashville Predators Line Combo Tool | Line Production Tool
| Team | F1 | F2 | F3 | GF | GA | GF% | SATF | SATA | SAT% | USATF | USATA | USAT% | SH% | SV% | SHSV | ZS% |
|---|
Most Recent 10 Games
| OPP | G | A | P | +/- | PIM | SOG | SH% | H | BS | FW | FL | FO% | TOI | EVTOI | PPTOI | PKTOI | ID |
|---|
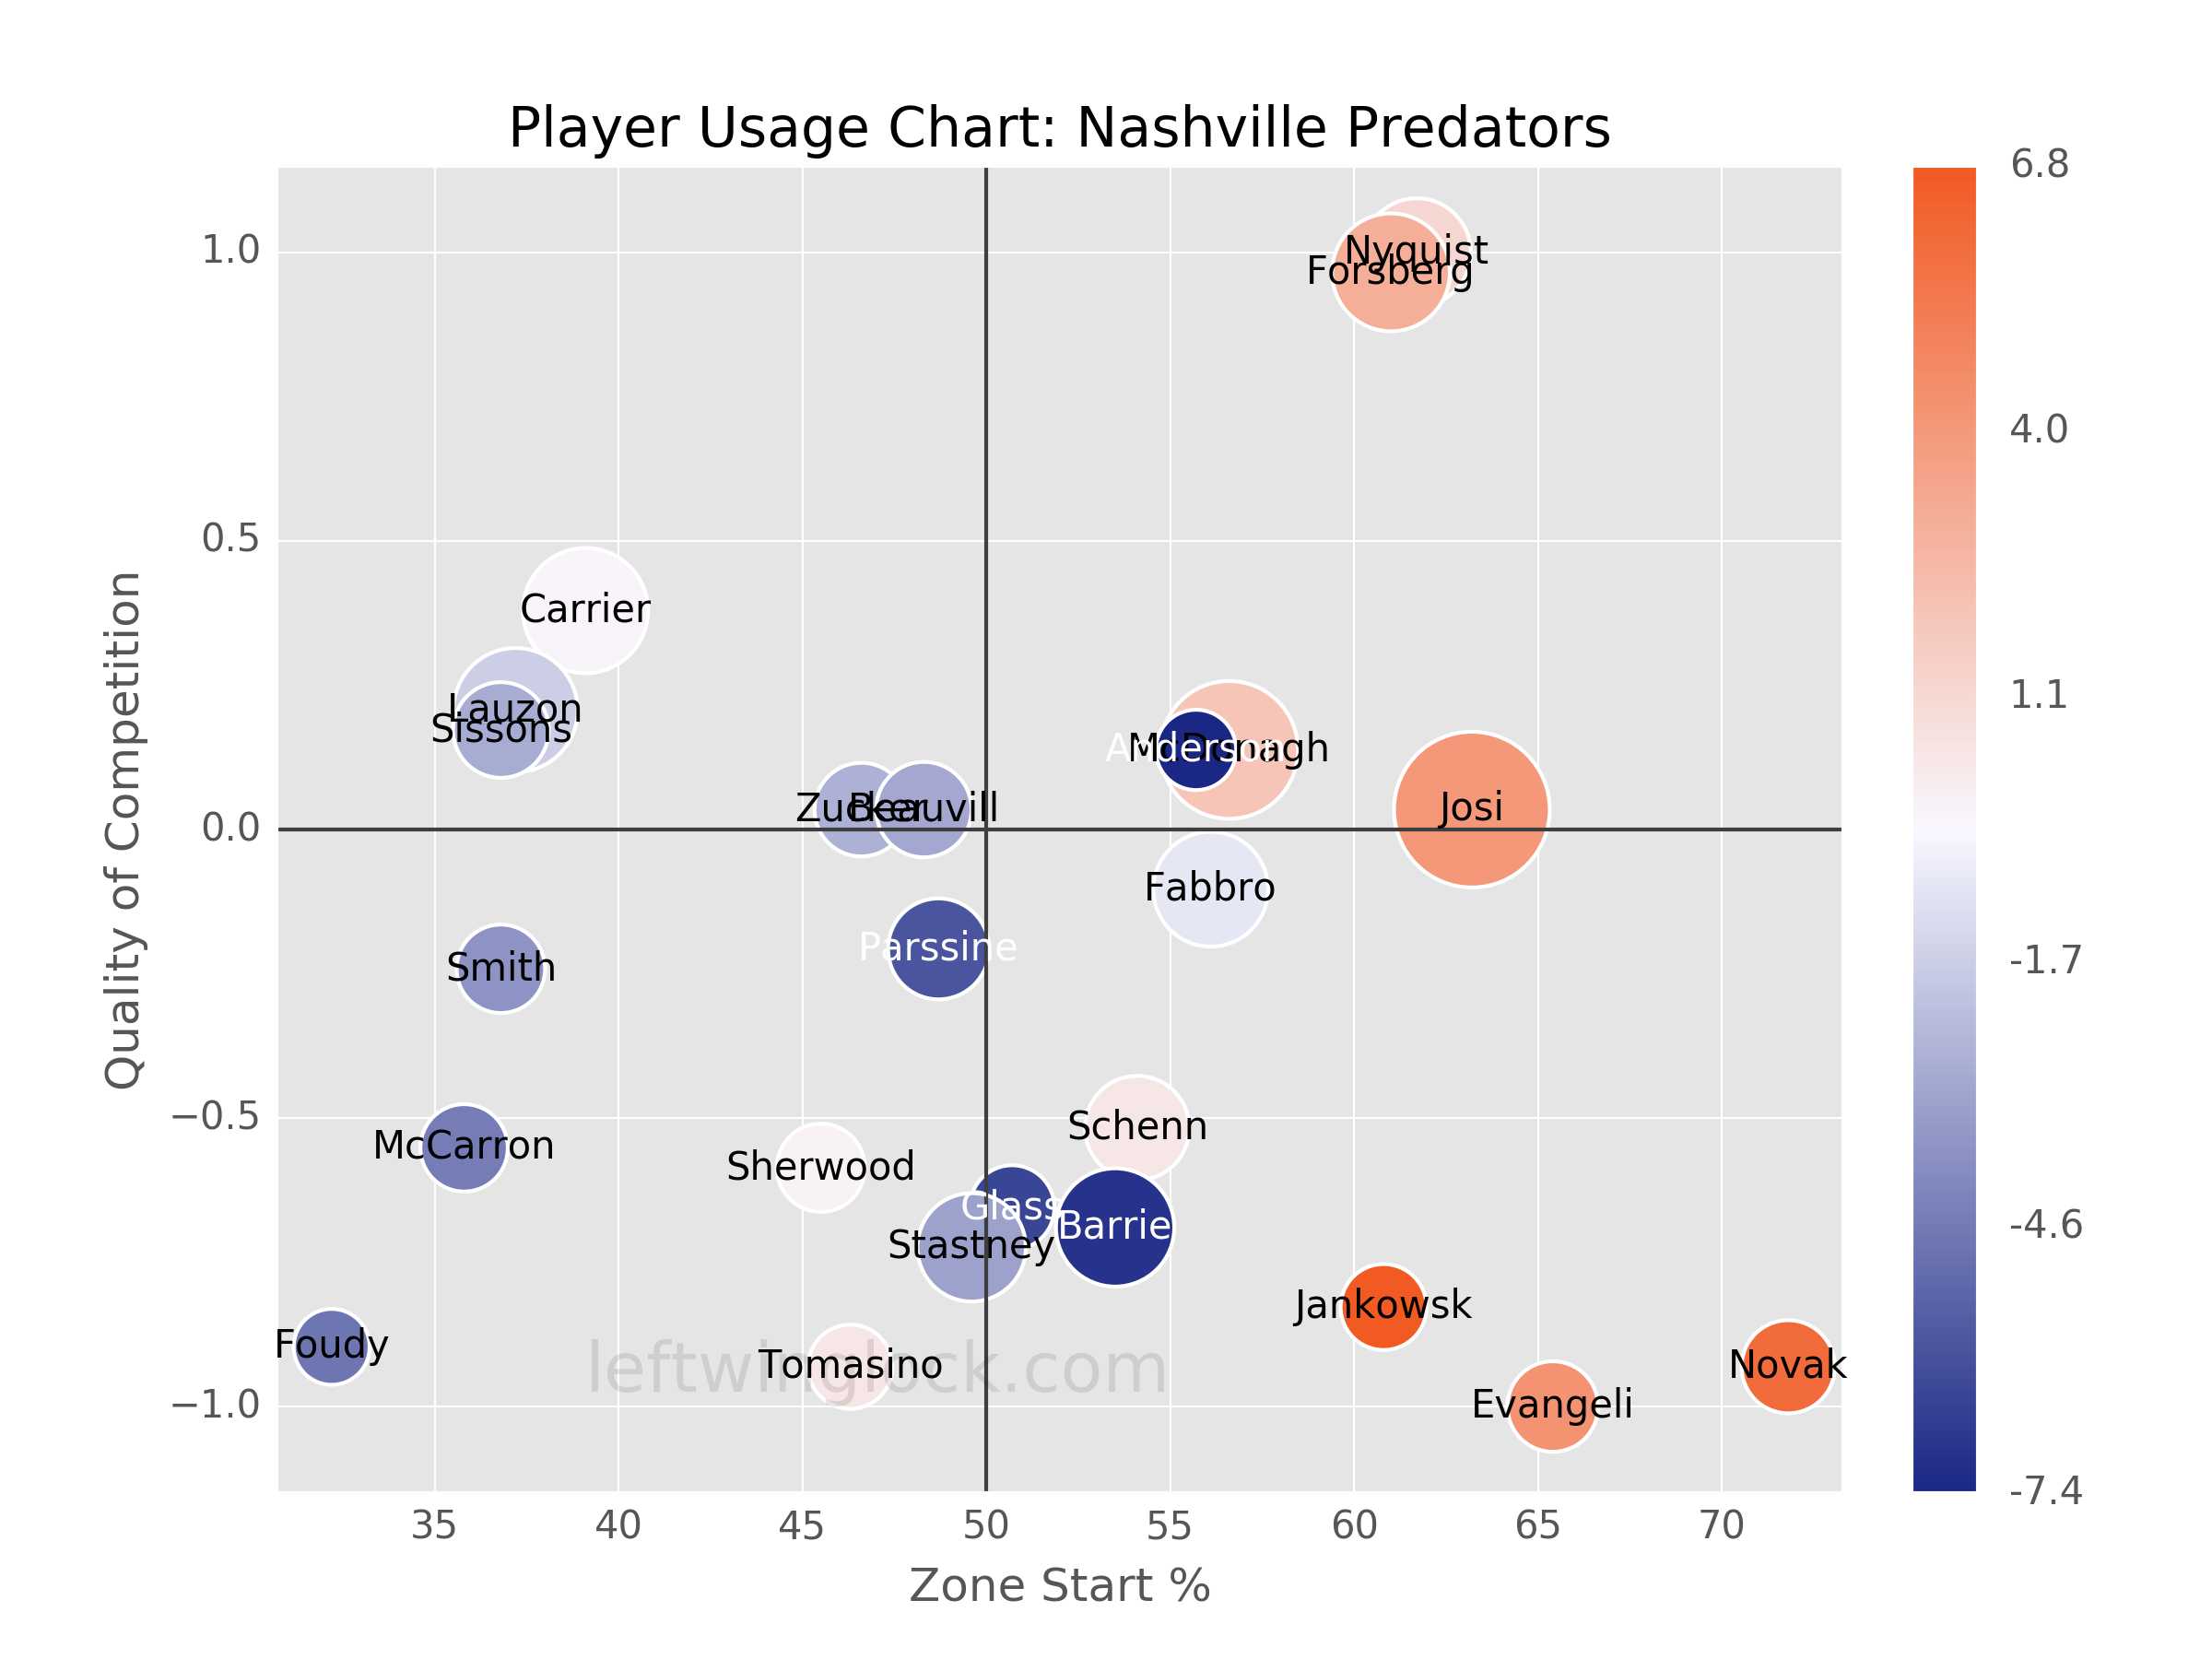
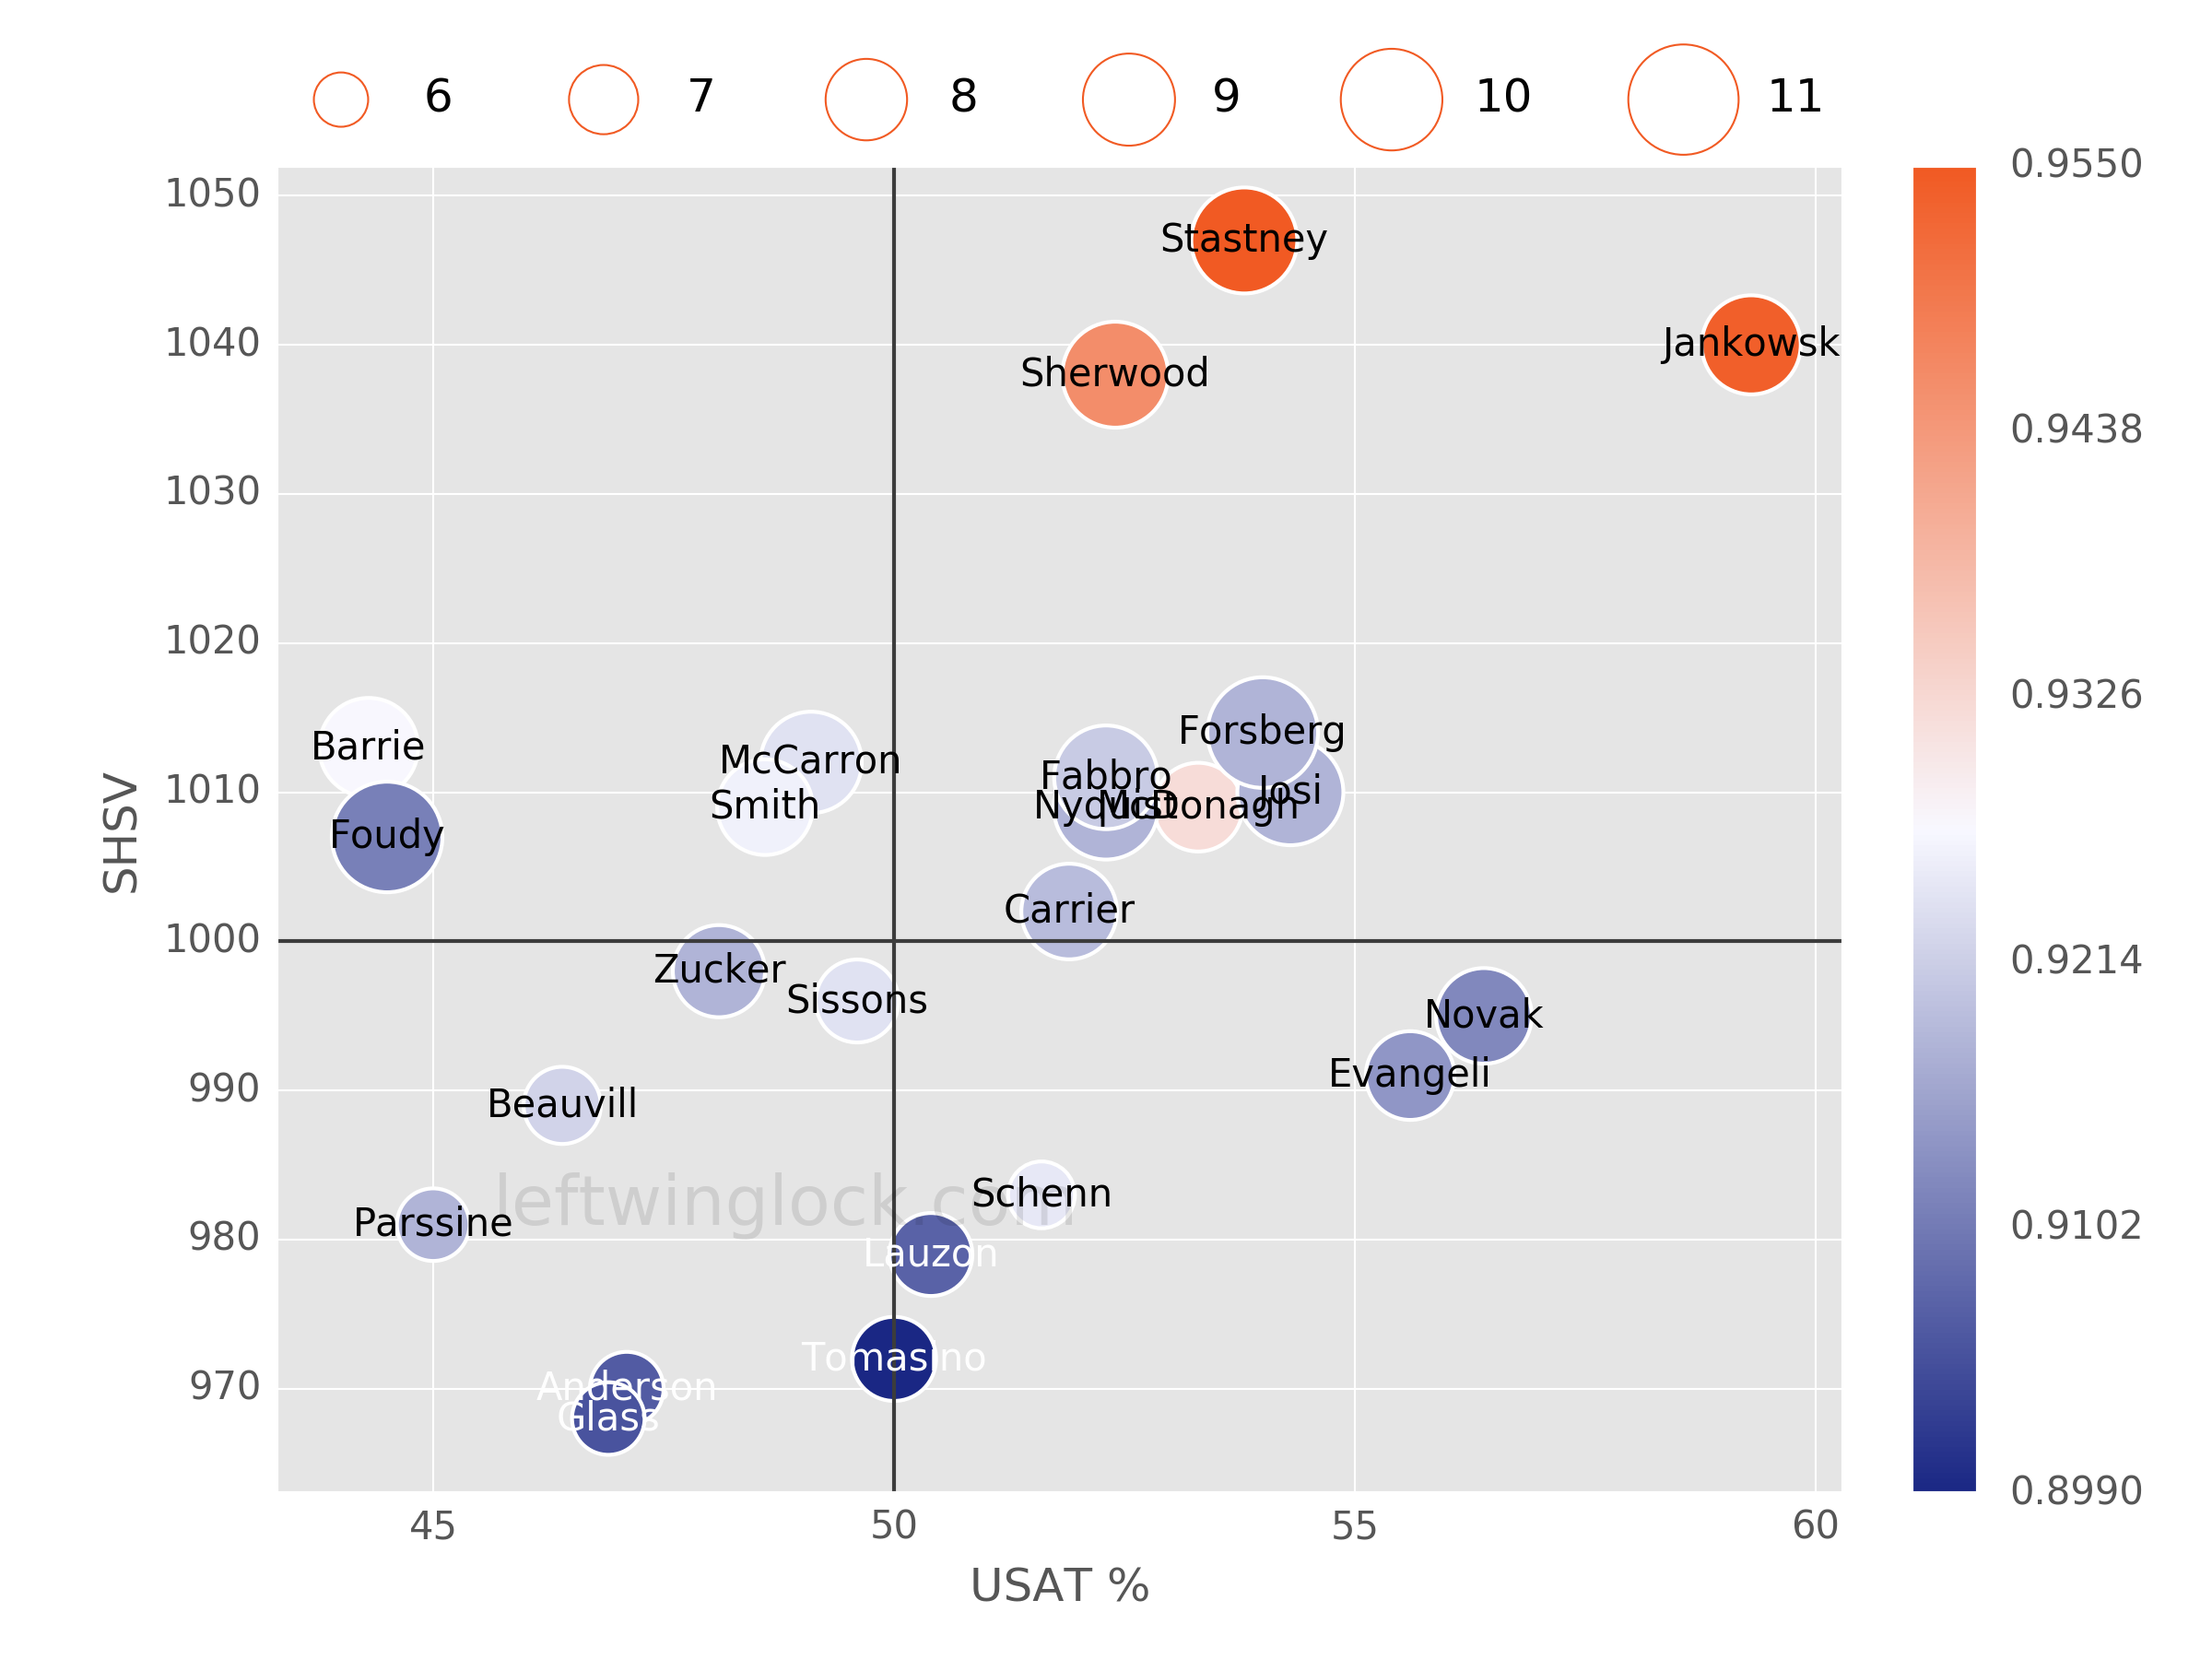
Player Usage Chart / Possession and Luck Chart