Trading van Riemsdyk
Introduction
On Thursday of the coming week, James van Riemsdyk of the Philadelphia Flyers will reach the midpoint of his season by playing in his 28th game. Through 24 games, he has amassed 11 goals and 16 assists - making him the 12th highest scoring forward in the NHL (as measured on a points per game basis for players with at least 20 games played).
van Riemsdyk is currently rostered in 85% of Yahoo fantasy leagues, but had an ownership rate of just 2% on opening night. The small number of managers who did draft van Riemsdyk stole him late with an average draft position of 166 (late in the 14th round). For those of you who gambled your late round pick on van Riemsdyk (or, more likely, grabbed him early off of waivers) - congratulations, you acquired one of the league's top scorers for nothing. And now it's time to trade him.
The Case: Goals
Assessing whether or not to trade a high scoring player in fantasy hockey begins with a look at some common offensive production metrics. The goal is to determine if the player is performing at a level inconsistent with his historical norms. If this is the case, then there is reason to believe that this player would be among a group of players expected to experience a slowdown in production during the remainder of the season. Let's get started.
For van Riemsdyk, the starting point is his shooting percentage (SH%). He's scoring on 20.0% of the shots he takes this season and we know this rate is abnormal for him since his career average is 12.2%. You should be aware that shooting percentages have been higher in recent seasons due to the changes in goalie equipment, so a more reasonable comparison for van Riemsdyk is closer to 14% (based upon the past two seasons). Thus, van Riemsdyk's 11 goals in 24 games are not a true indication of what to expect going forward. A luck-adjusted total would look more like 7-8 goals (over 24 games). Interestingly, van Riemsdyk's goal scoring luck is coming on the power play as opposed to even-strength. He's currently scoring on one out of every three shots on the power play (33.3%), while his even-strength shooting percentage is fairly normal (by his standards). You have to go back almost a decade to find a season where van Riemsdyk broke 19% efficiency on the power play. His five-year PPSH% average heading into this season was 14.7% - meaning he is currently scoring on the power play at a rate that is double what we'd expect to see.
The Case: Assists
We know van Riemsdyk's goals total is inflated by luck but what about his assists? There are a number of ways to analyze this, but here is a quick and easy method to apply to all players in the future: (1) check the team's even-strength shooting percentage with that player on the ice (tEVSH%) and (2) check if the player is being awarded points on the team's even-strength goals at an abnormal rate (individual points percentage - IPP). Let's check both numbers for van Riemsdyk (this data can be found on van Riemsdyk's profile page).
The tEVSH% (with van Riemsdyk on the ice) sits at 16.4%. This value is more typically 8-9% for forwards (with some outlier values reserved for elite players). With van Riemsdyk on the ice (at even-strength), the Flyers are scoring on one out of every six shots they put on net. This provides lots of opportunities for van Riemsdyk to earn assists. van Riemsdyk's IPP value is 79%. For every even-strength goal that the Flyers score (with van Riemsdyk on the ice), he earns a point on 79% of those goals. That's a little high (on average, the non-elite forwards come in around 70%), but not alarm-bell high.
Remember how we broke down van Riemsdyk's SH% into even-strength and power play portions? This is important; since his EVSH% is normal, it's not van Riemsdyk who is boosting the tEVSH%. The 16.4% tEVSH% is a result of his linemates scoring at abnormal rates at even-strength. A quick look at van Riemsdyk's most frequent linemates finds that Sean Couturier, Joel Farabee, and Scott Laughton are scoring on 17-21% of their shots on goal (these are abnormally high rates for all three players).
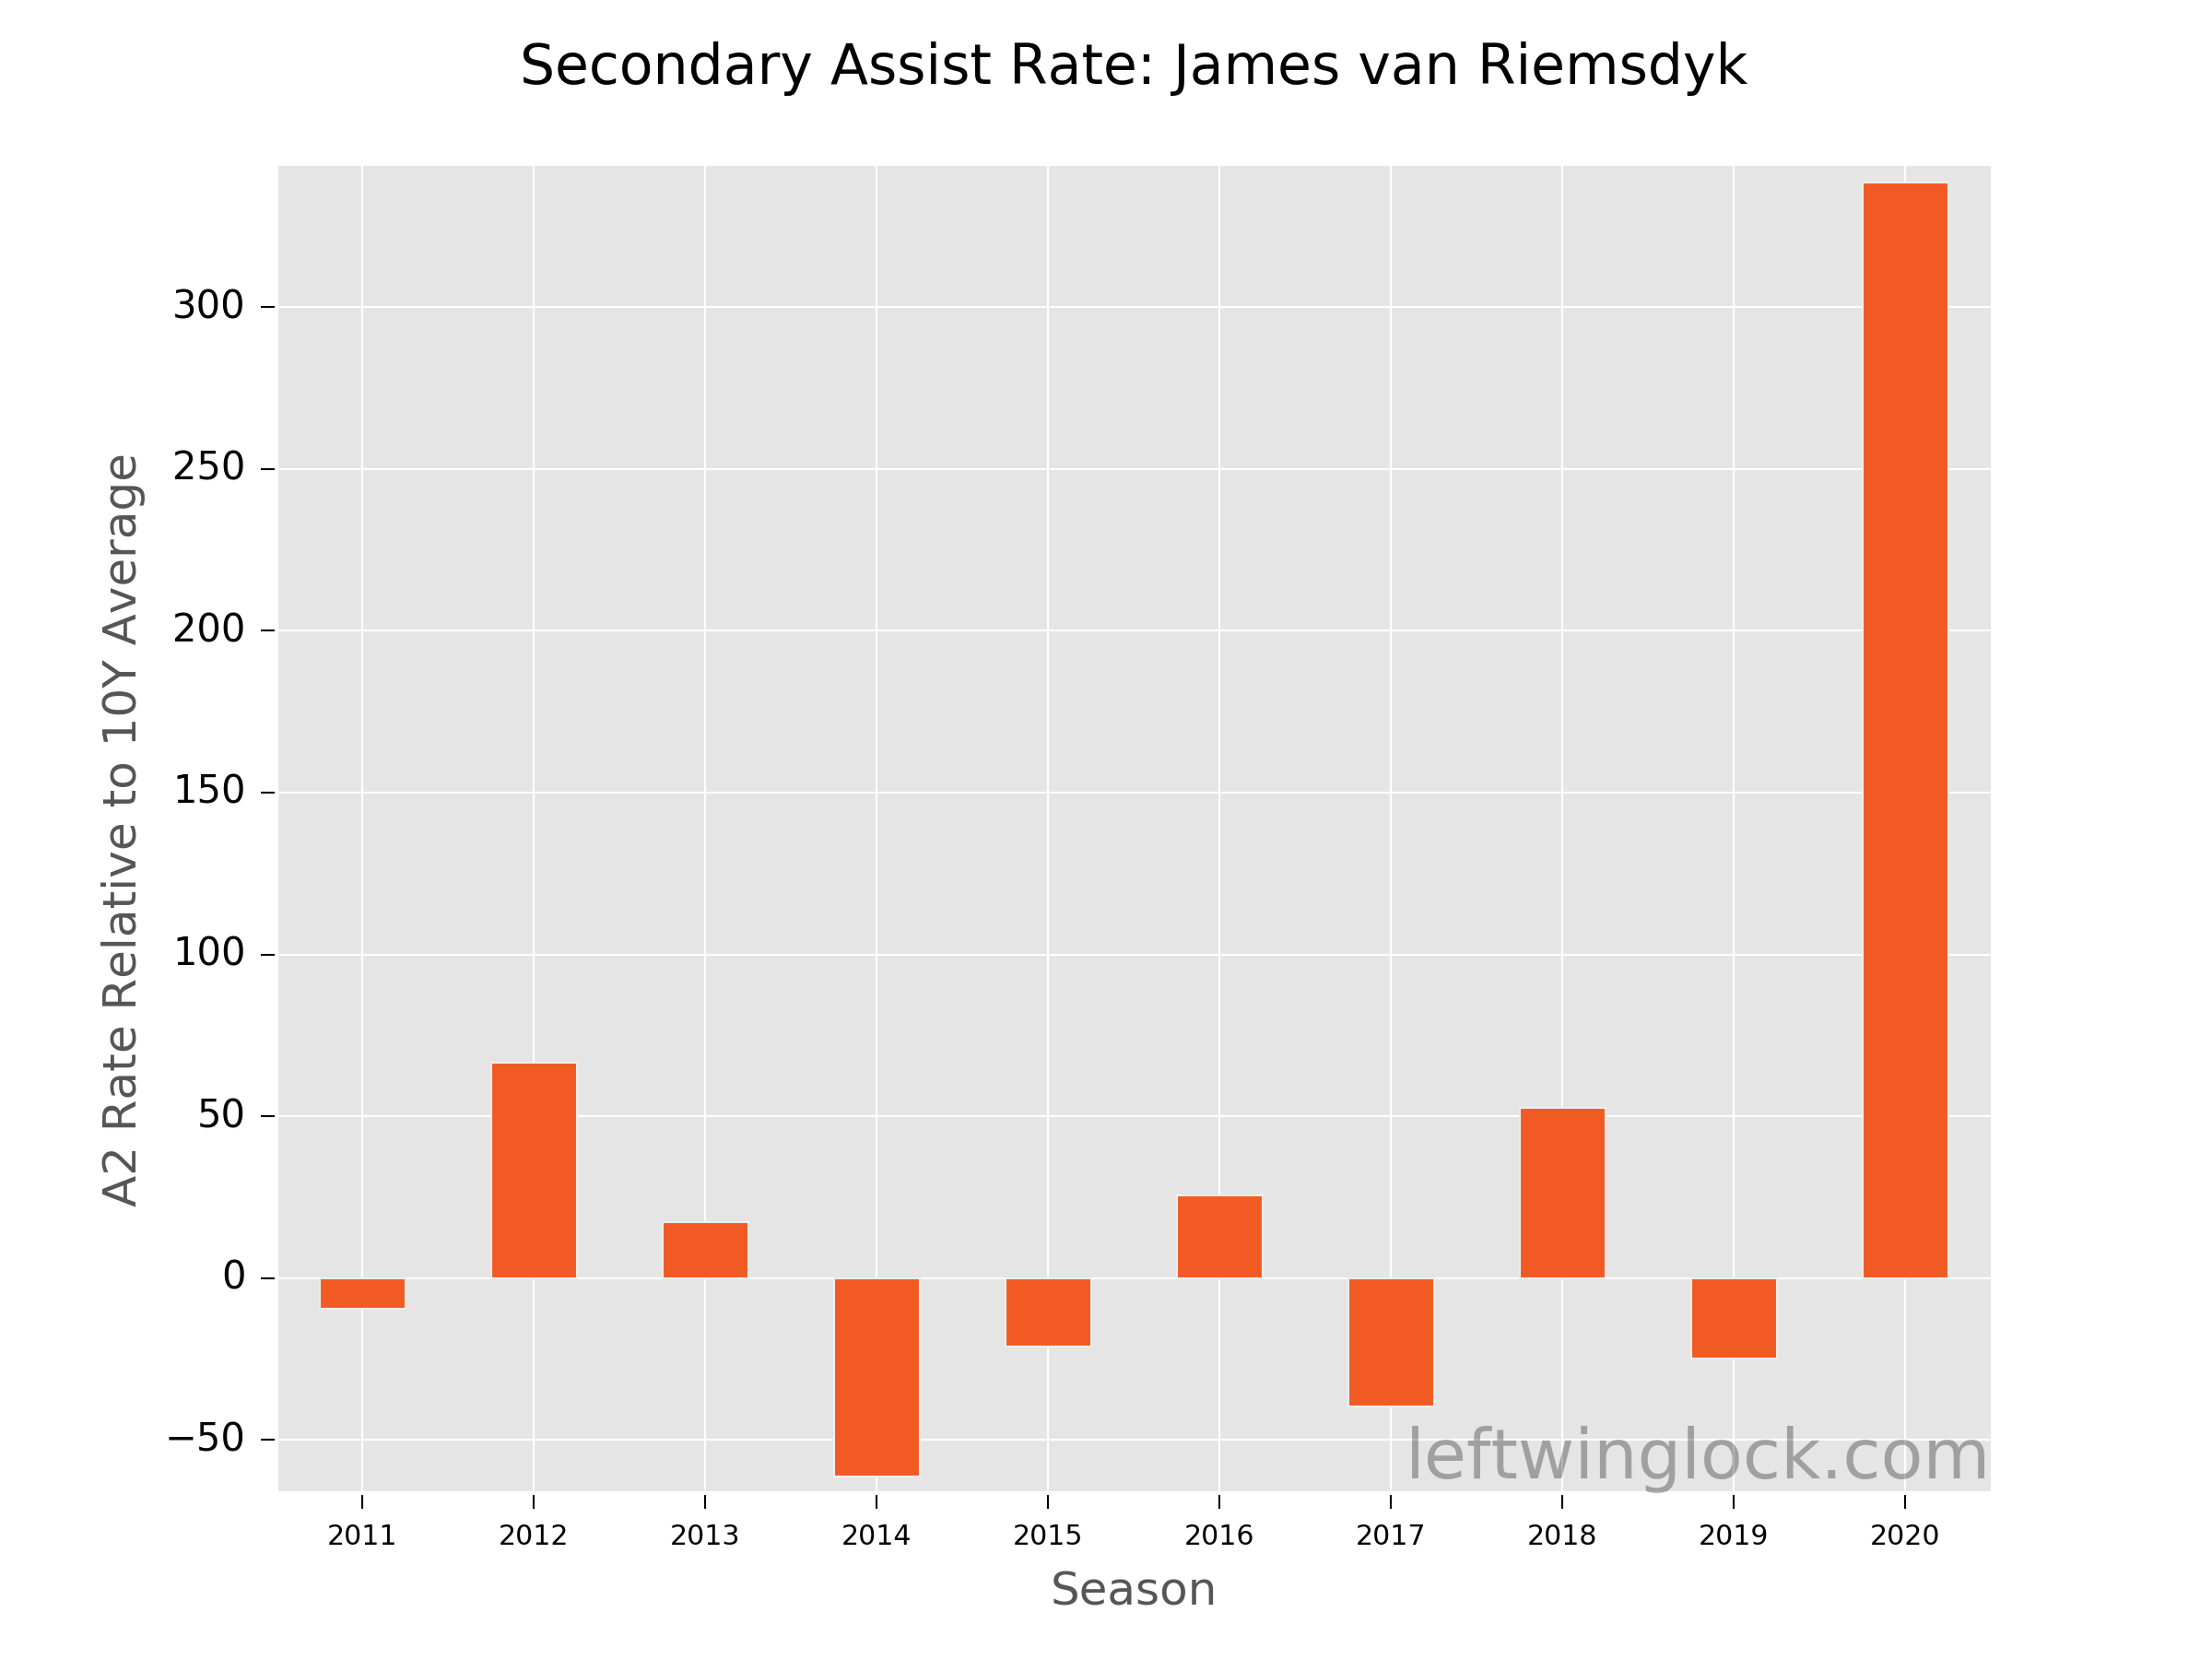
The tEVSH% tells us that van Riemsdyk's assist production is inflated by luck. But let's look at one more metric to hammer the point home: secondary assists per 60 minutes. The chart below shows van Riemsdyk's secondary assist rates over a 10-year period (and compares them to his 10-year average leading up to this season).
Take Action Today
It now becomes very clear that van Riemsdyk's production this season has been abnormally boosted by luck. He's scoring goals at a rate approximately 40% higher than normal. He is on pace to generate more secondary assists in this 56-game season than in his three previous seasons combined (213 games). You have a choice: (1) believe that van Riemsdyk's meteoric production will continue for the next 32 games or (2) trade this fantasy asset at peak value and get a player in return with production levels grounded in reality.
Want push notifications for starting goalies, player updates, line combinations, and a weekly schedule in the palm of your hand? Try our iPhone App for free for 30 days by clicking the image below:

Comments (1)
Leave a comment
In order to leave a comment, you must be a registered user at our website and logged in.
van Riemsdyk would score just two points in his next 25 games following this article. He generated just four more assists for the reminder of the season.