State of the League
Introduction
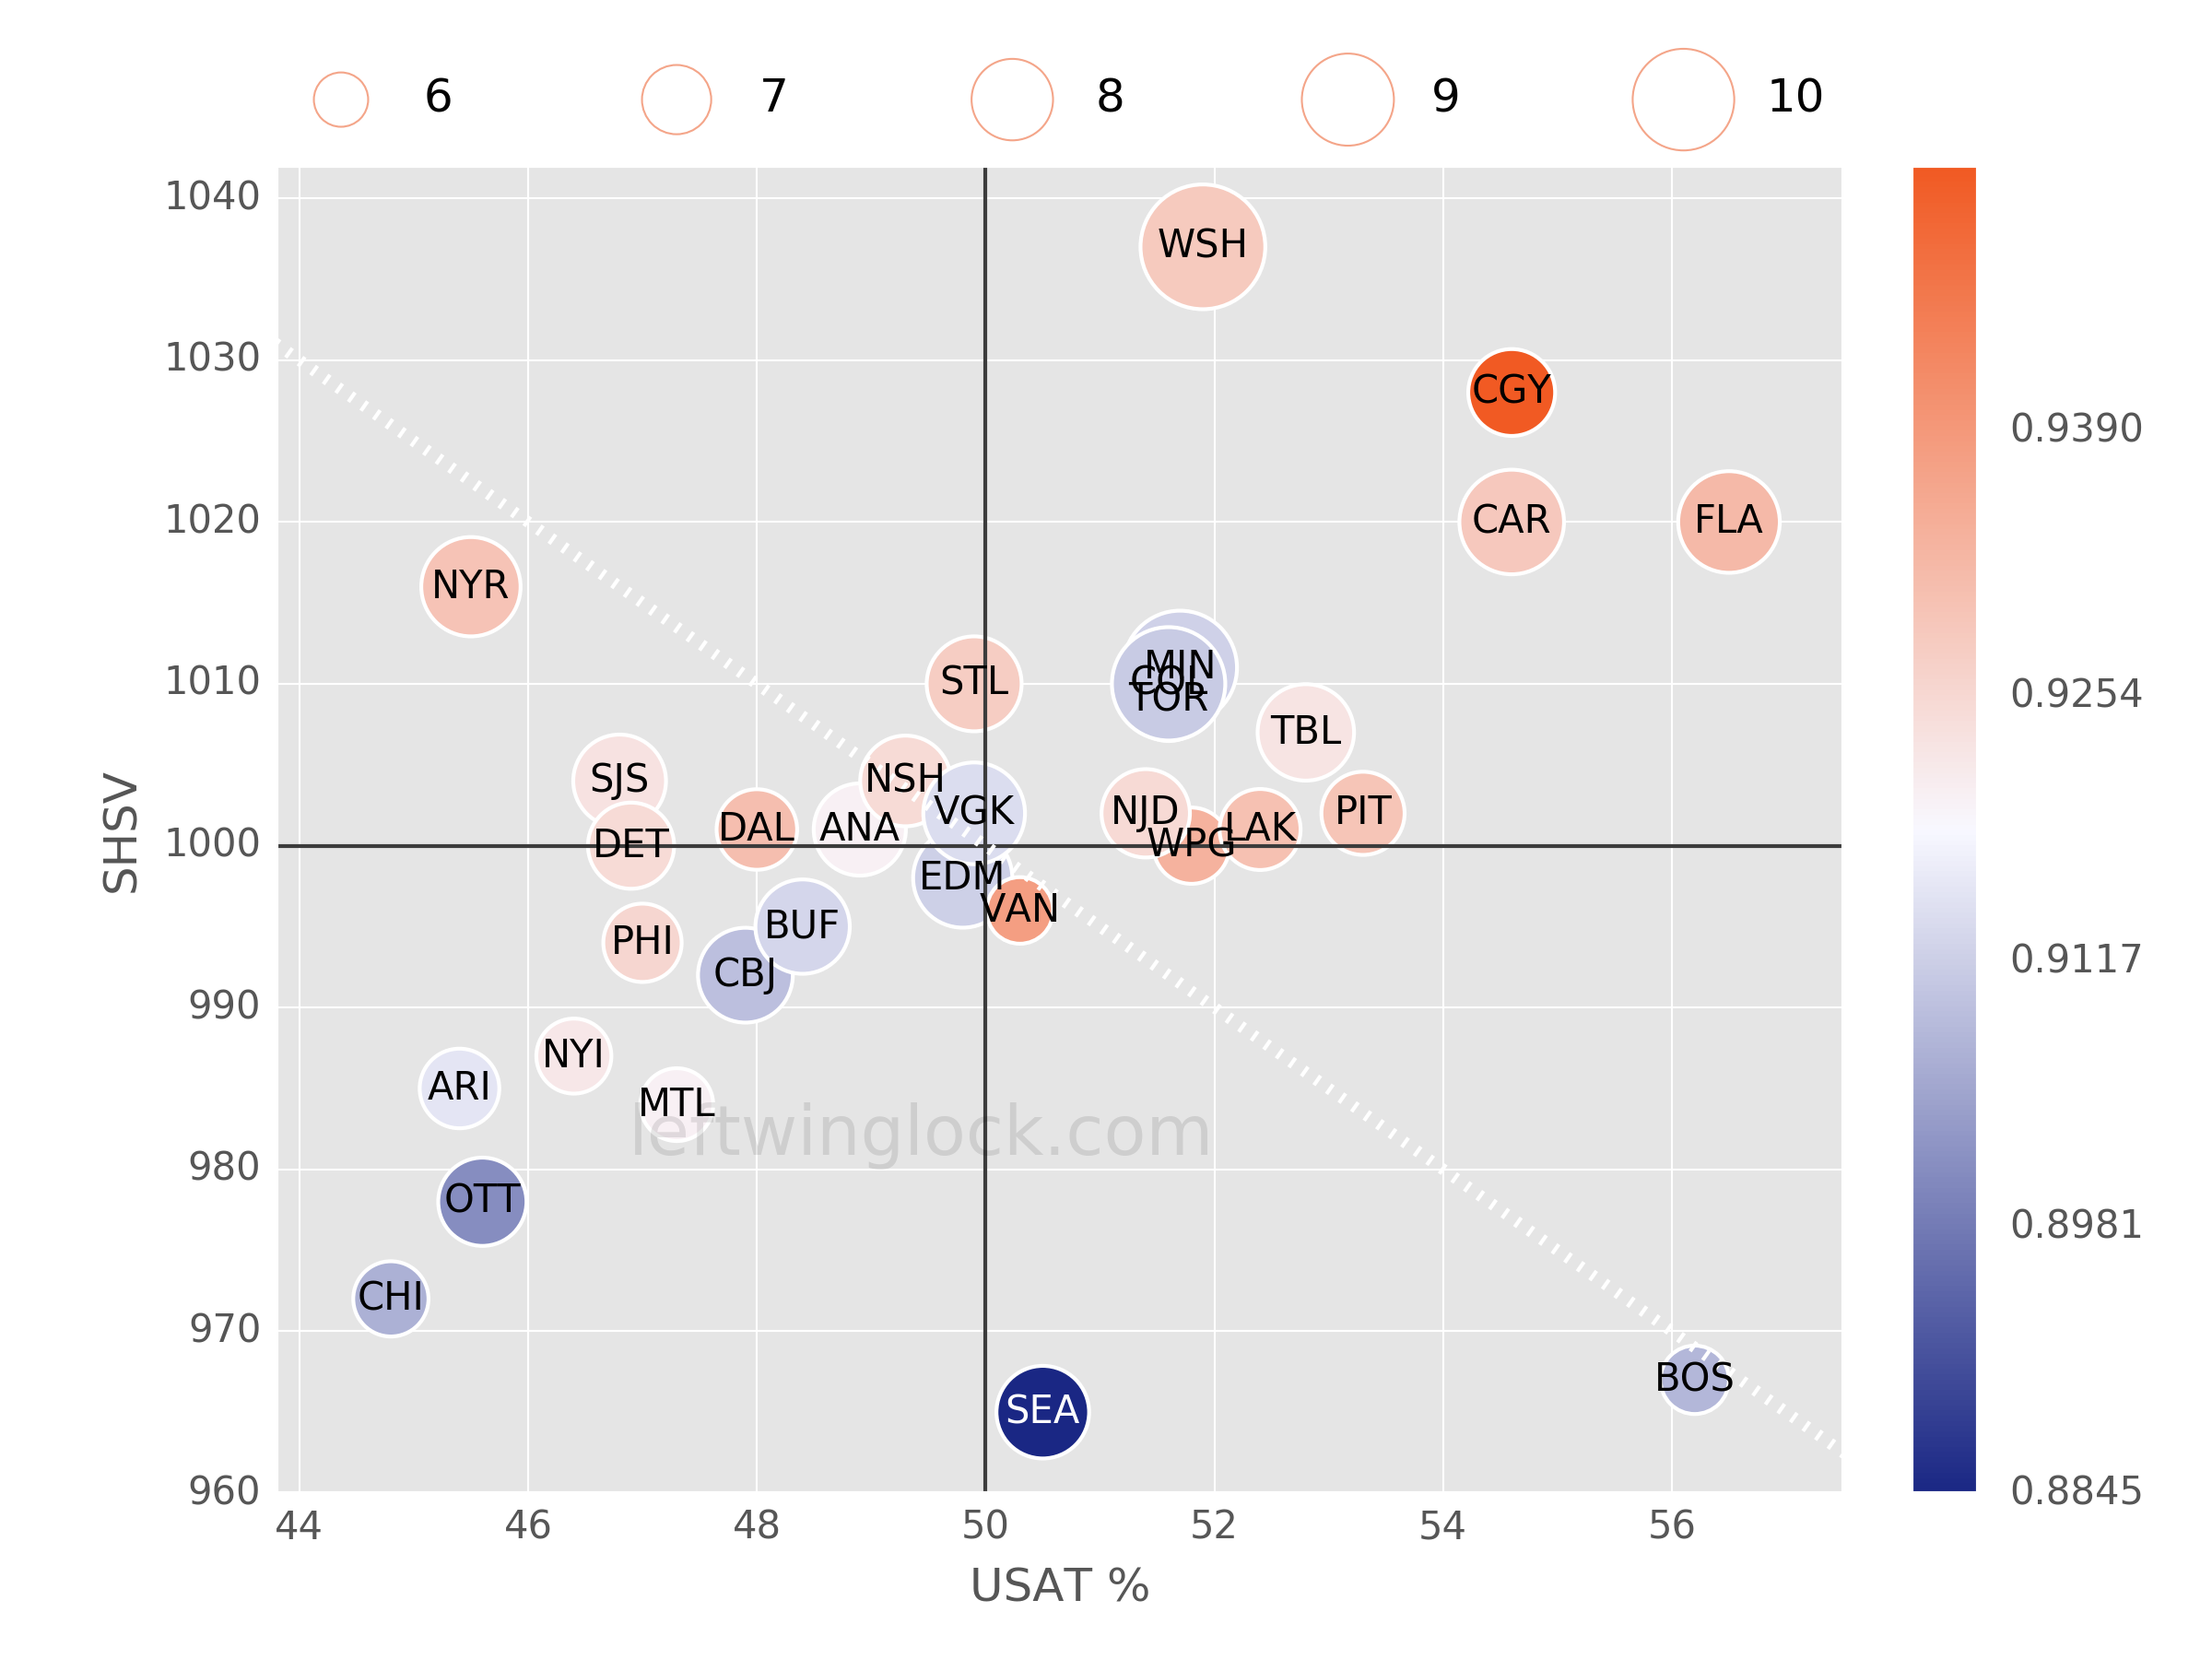
It is sometimes the case that early season results (standings position) do not match the process. As fantasy hockey managers, we can look for these mismatches to get the upperhand on our opponents. One method for finding these mismatches involves analysis of the possession and luck (PLUCK) chart. The PLUCK chart is a single graphic that shows you whether a team's results so far are driven by puck possession or luck (or both). Figure 1 is the PLUCK chart for all games through November 30:
Reading the Chart
BUBBLE HORIZONTAL POSITION
The x-axis measures puck possession and uses USAT% as the metric. USAT% is computed by finding what fraction of all unblocked shot attempts in games were generated by the team in question. A USAT% value greater than 50% suggests that a team is consistently outshooting their opponents.
BUBBLE VERTICAL POSITION
The y-axis measures luck at even-strength hockey and uses SHSV as the metric. SHSV is computed by using a team's even-strength shooting percentage and adding it to the team's even-strength save percentage (multiplied by 1000). Teams with values that stray significantly from 1000 are having their results influenced by luck.
BUBBLE SIZE
The size of each bubble measures the even-strength shooting percentage (EVSH%) of a team. The league average value (in recent years) is 8.3%.
BUBBLE COLOR
The color of each bubble measures the even-strength save percentage (EVSV%) of a team. The league average value (in recent years) is 0.917.
DASHED WHITE LINE
Historically, teams above the dashed white line are the most likely to qualify for the playoffs.
GENERAL COMMENTS
A team's vertical position can be an immediate tell that their results this season have been influenced by luck. But, it is the bubble size (EVSH%) and bubble color (EVSV%) that tell you what aspect of their game is being influenced by luck.
Bubbles to the right side of the chart (past the 50% USAT indicator) indicate that a team is outshooting their opponents on average at even-strength. This is usually where you want your team to live (but it's not the only way to win hockey games and it does not guarantee you'll win more often than you'll lose).
Very large bubbles are not a good thing. It means a team is benefitting from strong luck at even-strength (their shots are going into the net at a rate higher than normal). This is unsustainable over the course of a season and an indication that scoring is about to dry up.
Extreme data points (very large/small bubbles; dark orange/blue bubbles) may indicate a coming change (for better or for worse). For reference, the most extreme full-season values for SHSV (the vertical position of a team's bubble) over the past five years have been 987 (lowest) and 1017 (highest).
A significant majority of Stanley Cup winners have had season-ending bubbles that were found in the upper-right quadrant.
Mismatches
One mismatch that jumps out when viewing this chart is the Vancouver Canucks. They currently sit 15th overall in the Western Conference and approximately eight points out of a playoff spot. Their position on the PLUCK chart can be found at the approximate coordinates of (50.3, 996). What do their bubble characteristics tell us about this team? The smaller size suggests they have been unlucky at converting shots into goals at even-strength (their EVSH% is just 5.8%). The location to the right of the 50% USAT line suggests that they (slightly) outshoot their opponents. The vertical location (nearly at the league average of 1000) suggests that the even-strength results have not been heavily impacted by luck. So, why are the Vancouver Canucks in 15th place? The PLUCK chart, by design, focuses only on even-strength hockey. Since everything looks OK at even-strength, Vancouver's special teams must be the driving force behind their horrible start. As it turns out, Vancouver has the worst penalty kill in the league (63.4% success rate) and the 22nd ranked power play (16.9% success rate). If the Vancouver Canucks can fix their penalty kill, the PLUCK chart suggests that Thatcher Demko is a reasonably strong buy-low candidate in fantasy hockey.
The Calgary Flames lead the Western Conference with 31 points and their bubble can be found at the approximate coordinates of (54.6, 1028). While their EVSH% comes in a little low at 7.5%, it is their EVSV% that is responsible for how high their bubble sits on the PLUCK chart. Calgary goalies are currently stopping 95.3% of all shots they face at even-strength. This is an unsustainable level. So, while the Flames' standings position has a strong basis in puck possession (USAT: 54.6%), the rate at which they earn standings point is going to drop as their goaltending comes back down to Earth. We expect the save percentags for both Jacob Markstrom and Dan Vladar to drop; their winning percentages will follow.
The Boston Bruins bubble sure does look ripe for a Tuukka Rask return in January. They have excellent puck possession numbers (note how far to the right their bubble lives on the PLUCK chart) and a low EVSH% - and that's a recipe for future scoring. With neither Linus Ullmark nor Jeremy Swayman playing in a dominant fashion, a Rask pickup in your league could lead your team to victory.
Hey Flyers fans, don't inhale the smoke that Chuck Fletcher was blowing earlier this week about the team playing great hockey in the first 10 games of the season. Notice the Flyers bubble at the approximate coordinates of (47, 994)? That's a team that is getting heavily outshot at even-strength. What happens to teams that get heavily outshot at even-strength in the NHL? They lose more often than they win. The Flyers currently sit out of the playoffs and in 12th place in the Eastern Conference. Seems about right!
It's not clear what exactly is happening with the Seattle Kraken. Find their bubble at the approximate coordinates of (50.5, 965). The low, vertical location screams unlucky. As we noted above, the lowest, full-season SHSV value over the last five years is 987. It wouldn't be unreasonable to expect Seattle's bubble to rise by about 20 units from now through April. Since the Kraken's bubble size is already consistent with the league average (at about 8.0%), it is the color of the bubble (the EVSV%) that should drive the change. With the Kraken generally outshooting their opponents, this should mean good news for the 17 remaining owners of Philipp Grubauer.
Finally, ask yourself what you should expect from the Washington Capitals in the coming weeks and months. Find their bubble at the approximate coordinates of (51.9, 1037). The fact that their bubble has the highest vertical position on the chart indicates that their standings position is being driven, in part, by luck. The size of the bubble tells us that the Capitals are converting shots into goals at what is probably an unsustainable rate (10.8%). As this rate drops (along with the bubble's size and vertical position), what will happen to the Capitals' 1st place position in the Metropolitan Division? What will happen to Ilya Samsonov's winning percentage (which currently sits at 90%)?
Final Notes
The PLUCK chart can be used to better understand the relationship between a team's process and a team's results. And with that understanding comes the ability to potentially predict the direction a team is heading in the coming months. This knowledge should put you in a position to outwit your opponents in fantasy hockey, specifically when it comes to determining the future results of a team's goaltending.
The PLUCK chart in this article is for games through November 30. Our dynamic PLUCK chart is updated on a nightly basis.
Comments (0)
Leave a comment
In order to leave a comment, you must be a registered user at our website and logged in.