Antoine Roussel
Explore projections, stats, news, player usage charts, and line combinations for members of the Arizona Coyotes
-
Left Wing Leaders
2023 - 2024
Name PPG PPA PPP Artemi
Panarin11 33 44 Kirill Kaprizov 19 22 41 Filip Forsberg 13 19 32 Matthew Tkachuk 6 26 32 Kevin Fiala 11 19 30 Chris Kreider 18 11 29 Alex Ovechkin 13 15 28 Jason Robertson 9 19 28 Jesper Bratt 7 20 27 Brad Marchand 7 19 26 Matt Boldy 10 15 25 Jared McCann 9 14 23 -
Player Card
-
Arizona Coyotes Leaders
2023 - 2024
Name G A Pts Clayton
Keller33 43 76 Nick Schmaltz 22 39 61 Matias Maccelli 17 40 57 Nick Bjugstad 22 23 45 Alex Kerfoot 13 32 45 Logan Cooley 20 24 44 Lawson Crouse 23 19 42 Sean Durzi 9 32 41 Dylan Guenther 18 17 35 Michael Carcone 21 8 29 Jack McBain 8 18 26 J.J. Moser 5 21 26

News
-
Antoine Roussel
Will miss six weeks of action due to a lower-body injury.
Mar 8, 2022 - 12:00 pm -
Antoine Roussel
Is out of the COVID-related absence protocol.
Jan 25, 2022 - 11:23 am -
Antoine Roussel
Is in the COVID-related absence protocol.
Jan 18, 2022 - 12:31 pm -
Antoine Roussel
Is expected to be in the lineup for today's game.
Oct 18, 2021 - 2:37 pm
Feature
-
Trending
No articles available
Replies 0
Basic Stats
| Season | Team | GP | G | A | P | +/- | PIM | S | S/GP | SH% | PPP | H | BS | FW | FO% | TOI | EVTOI | PPTOI | PKTOI |
|---|---|---|---|---|---|---|---|---|---|---|---|---|---|---|---|---|---|---|---|
| 21-22 | ARI | 53 | 4 | 4 | 8 | -16 | 59 | 59 | 1.1 | 6.8 | 0 | 74 | 34 | 17 | 43.6 | 12.14 | 10.38 | 0.03 | 1.73 |
| 20-21 | VAN | 35 | 1 | 3 | 4 | 4 | 37 | 28 | 0.8 | 3.6 | 0 | 63 | 18 | 2 | 50.0 | 11.51 | 9.47 | 0.03 | 2.01 |
| 19-20 | VAN | 41 | 7 | 6 | 13 | 0 | 43 | 55 | 1.3 | 12.7 | 2 | 44 | 14 | 6 | 50.0 | 11.83 | 10.52 | 1.30 | 0.01 |
Enhanced Stats (5-on-5 unless denoted with *)
| Season | G/60 | A/60 | P/60 | IPP | ΔPEN/60 | 1A | 2A | EVS/60* | PPS/60* | SATF | SAT% | tEVSH% | tEVSV% | SHSV | ZS% |
|---|---|---|---|---|---|---|---|---|---|---|---|---|---|---|---|
| 21-22 | 0.44 | 0.44 | 0.89 | 67 | -0.28 | 4 | 0 | 6.2 | 0.0 | 426 | 43.2 | 5.2 | 0.921 | 973 | 35.6 |
| 20-21 | 0.18 | 0.37 | 0.55 | 33 | -1.19 | 2 | 0 | 4.0 | 0.0 | 286 | 47.1 | 5.5 | 0.956 | 1011 | 35.4 |
| 19-20 | 0.73 | 0.59 | 1.32 | 48 | -1.48 | 3 | 1 | 5.9 | 9.0 | 391 | 47.0 | 10.1 | 0.916 | 1017 | 51.8 |
Regression Meter
This meter measures whether or not a player's point production is being influenced by luck. Orange indicates the player has been lucky. Dark grey indicates the player has been unlucky.
2A/60
tEVSH%
SH%
IPP
PPSH%
Positional Data
| Season | Team | Left | Center | Right |
|---|---|---|---|---|
| 21-22 | ARI | 100 | 0 | 0 |
| 20-21 | VAN | 100 | 0 | 0 |
| 19-20 | VAN | 100 | 0 | 0 |
Most Common Linemates and Line Production
See also: Arizona Coyotes Line Combo Tool | Line Production Tool
| Team | F1 | F2 | F3 | GF | GA | GF% | SATF | SATA | SAT% | USATF | USATA | USAT% | SH% | SV% | SHSV | ZS% |
|---|
Most Recent 10 Games
| OPP | G | A | P | +/- | PIM | SOG | SH% | H | BS | FW | FL | FO% | TOI | EVTOI | PPTOI | PKTOI | ID |
|---|
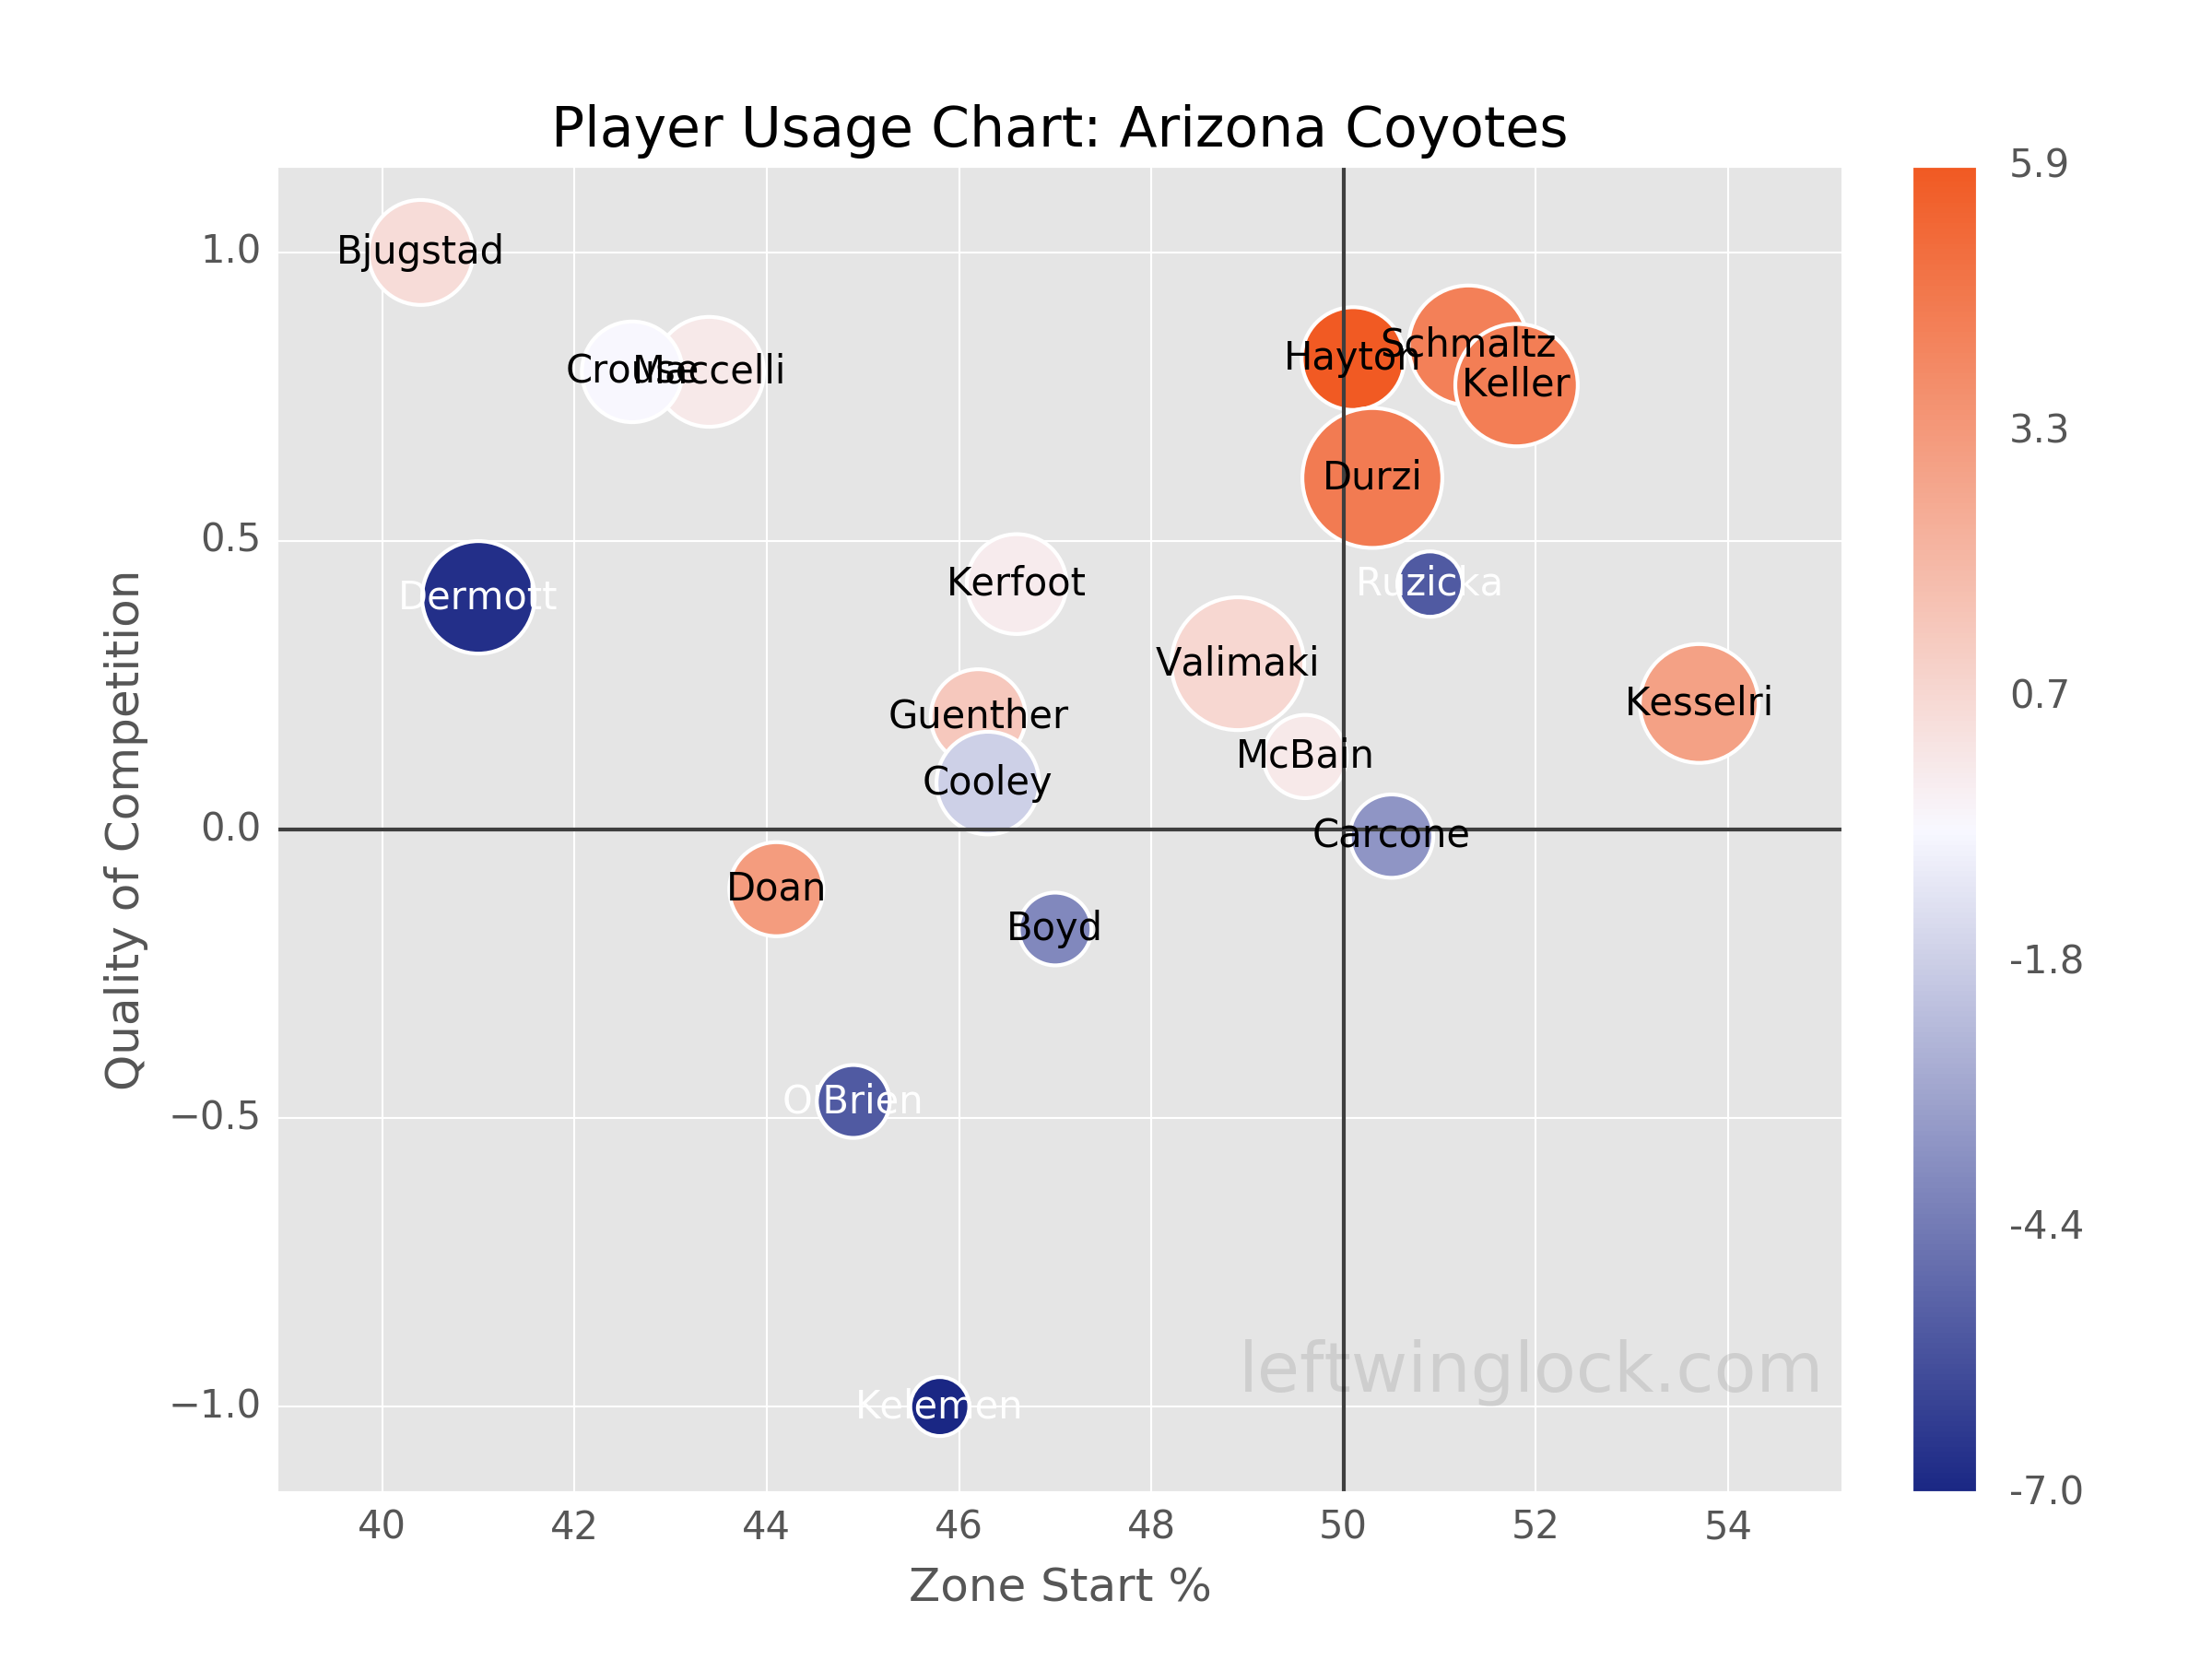
Player Usage Chart / Possession and Luck Chart