BRENT BURNS
Explore projections, stats, news, player usage charts, and line combinations for members of the Carolina Hurricanes
-
Defenseman Leaders
2023 - 2024
Name G A Pts Quinn
Hughes17 75 92 Cale Makar 21 69 90 Roman Josi 23 62 85 Evan Bouchard 18 64 82 Victor Hedman 13 63 76 Adam Fox 17 56 73 Noah Dobson 10 60 70 Josh Morrissey 10 59 69 Mike Matheson 11 51 62 Rasmus Dahlin 20 39 59 Morgan Rielly 7 51 58 Zach Werenski 11 46 57 -
Player Card
BRENT BURNS
Carolina Hurricanes2023 - 2024- G 10
- A 33
- PTS 43
- +/- 19
- PIM 20
- PPP 20
- SH% 5.4
- L 0%
- C 0%
- R 100%
-
Carolina Hurricanes Leaders
2023 - 2024
Name PPG PPA PPP Sebastian
Aho11 21 32 Jake Guentzel 5 17 22 Seth Jarvis 13 7 20 Brent Burns 4 16 20 Teuvo Teravainen 9 8 17 Andrei Svechnikov 5 12 17 Martin Necas 8 5 13 Brady Skjei 1 11 12 Stefan Noesen 3 8 11 Jack Drury 2 5 7 Evgeny Kuznetsov 1 6 7 Tony DeAngelo 2 4 6
News
-
Brent Burns
Is expected to be in the lineup for today's game.
Nov 15, 2023 - 11:16 am -
Brent Burns
Is not on the ice for the morning skate.
Nov 15, 2023 - 10:35 am -
Brent Burns
Has been traded to the Carolina Hurricanes, along with Lane Pederson, in exchange for Steven Lorentz, Eetu Makiniemi, and a 2023 3rd round draft pick.
Jul 13, 2022 - 12:56 pm -
Brent Burns
Is out of the COVID-related absence protocol.
Dec 27, 2021 - 3:15 pm
Feature
-
Trending
Finding Value at the D Position
Replies 0
Basic Stats
| Season | Team | GP | G | A | P | +/- | PIM | S | S/GP | SH% | PPP | H | BS | FW | FO% | TOI | EVTOI | PPTOI | PKTOI |
|---|---|---|---|---|---|---|---|---|---|---|---|---|---|---|---|---|---|---|---|
| 23-24 | CAR | 82 | 10 | 33 | 43 | 19 | 20 | 185 | 2.3 | 5.4 | 20 | 41 | 87 | 0 | 0.0 | 21.50 | 16.57 | 2.63 | 2.30 |
| 22-23 | CAR | 82 | 18 | 43 | 61 | 19 | 44 | 255 | 3.1 | 7.1 | 23 | 40 | 86 | 1 | 100.0 | 23.22 | 18.11 | 3.00 | 2.10 |
| 21-22 | SJS | 82 | 10 | 44 | 54 | -15 | 42 | 203 | 2.5 | 4.9 | 18 | 55 | 150 | 0 | 0.0 | 26.15 | 20.77 | 2.66 | 2.72 |
| 20-21 | SJS | 56 | 7 | 22 | 29 | -12 | 36 | 138 | 2.5 | 5.1 | 6 | 31 | 94 | 0 | 0.0 | 26.13 | 20.63 | 2.64 | 2.87 |
| 19-20 | SJS | 70 | 12 | 33 | 45 | -22 | 34 | 225 | 3.2 | 5.3 | 17 | 72 | 115 | 0 | 0.0 | 25.41 | 20.17 | 2.77 | 2.47 |
Enhanced Stats (5-on-5 unless denoted with *)
| Season | G/60 | A/60 | P/60 | IPP | ΔPEN/60 | 1A | 2A | EVS/60* | PPS/60* | SATF | SAT% | tEVSH% | tEVSV% | SHSV | ZS% |
|---|---|---|---|---|---|---|---|---|---|---|---|---|---|---|---|
| 23-24 | 0.23 | 0.56 | 0.80 | 28 | -0.10 | 5 | 7 | 6.3 | 11.4 | 1610 | 59.8 | 8.9 | 0.918 | 1007 | 52.2 |
| 22-23 | 0.52 | 0.78 | 1.29 | 51 | -0.44 | 13 | 5 | 7.9 | 12.7 | 1689 | 61.5 | 7.5 | 0.924 | 999 | 59.8 |
| 21-22 | 0.23 | 0.80 | 1.02 | 44 | -0.36 | 10 | 11 | 4.9 | 13.2 | 1364 | 45.0 | 9.4 | 0.921 | 1015 | 43.0 |
| 20-21 | 0.28 | 0.67 | 0.95 | 38 | -0.49 | 9 | 3 | 4.9 | 15.4 | 963 | 48.1 | 8.3 | 0.902 | 985 | 41.3 |
| 19-20 | 0.32 | 0.63 | 0.95 | 42 | -0.30 | 9 | 5 | 6.9 | 18.9 | 1254 | 49.6 | 8.9 | 0.902 | 991 | 50.6 |
Regression Meter
This meter measures whether or not a player's point production is being influenced by luck. Orange indicates the player has been lucky. Dark grey indicates the player has been unlucky.
Positional Data
| Season | Team | Left | Center | Right |
|---|---|---|---|---|
| 23-24 | CAR | 0 | 0 | 100 |
| 22-23 | CAR | 0 | 0 | 100 |
| 21-22 | CAR | 0 | 0 | 0 |
| 20-21 | SJ | 0 | 0 | 100 |
| 19-20 | SJ | 0 | 0 | 100 |
Most Common Pairings and Pair Production
See also: Carolina Hurricanes Line Combos | Line Production Tool
| Team | D1 | D2 | GF | GA | GF% | SATF | SATA | SAT% | USATF | USATA | USAT% | SH% | SV% | SHSV | ZS% |
|---|---|---|---|---|---|---|---|---|---|---|---|---|---|---|---|
| CAR | BRENT BURNS | JACCOB SLAVIN | 65 | 47 | 58.0 | 1667 | 1154 | 59.1 | 1161 | 850 | 57.7 | 8.8 | 0.918 | 1005 | 50.2 |
| CAR | BRENT BURNS | BRADY SKJEI | 2 | 0 | 100.0 | 48 | 30 | 61.5 | 27 | 20 | 57.4 | 10.0 | 1.000 | 1100 | 20.0 |
| CAR | DMITRY ORLOV | BRENT BURNS | 3 | 1 | 75.0 | 45 | 29 | 60.8 | 29 | 24 | 54.7 | 17.6 | 0.938 | 1114 | 20.0 |
Most Recent 10 Games
| OPP | G | A | P | +/- | PIM | SOG | SH% | H | BS | FW | FL | FO% | TOI | EVTOI | PPTOI | PKTOI | ID |
|---|---|---|---|---|---|---|---|---|---|---|---|---|---|---|---|---|---|
| NYR | 0 | 0 | 0 | -2 | 0 | 2 | 0 | 0 | 1 | 0 | 0 | 0 | 21:12 | 20:00 | 00:00 | 01:12 | 30226 |
| NYR | 0 | 0 | 0 | 1 | 0 | 0 | 0 | 0 | 1 | 0 | 0 | 0 | 21:51 | 15:38 | 03:44 | 02:29 | 30225 |
| NYR | 0 | 1 | 1 | 1 | 2 | 3 | 0 | 1 | 2 | 0 | 0 | 0 | 19:37 | 18:09 | 00:44 | 00:44 | 30224 |
| NYR | 0 | 0 | 0 | 0 | 0 | 3 | 0 | 1 | 1 | 0 | 0 | 0 | 20:18 | 13:51 | 03:00 | 03:27 | 30223 |
| NYR | 0 | 0 | 0 | -1 | 0 | 4 | 0 | 3 | 1 | 0 | 0 | 0 | 31:19 | 23:42 | 03:59 | 03:38 | 30222 |
| NYR | 0 | 1 | 1 | 2 | 0 | 2 | 0 | 0 | 2 | 0 | 0 | 0 | 22:54 | 18:42 | 03:58 | 00:14 | 30221 |
| NYI | 0 | 1 | 1 | 1 | 0 | 1 | 0 | 0 | 3 | 0 | 0 | 0 | 21:31 | 17:37 | 00:12 | 03:42 | 30145 |
| NYI | 0 | 0 | 0 | 0 | 0 | 4 | 0 | 1 | 3 | 0 | 0 | 0 | 26:53 | 22:15 | 03:05 | 01:33 | 30144 |
| NYI | 1 | 0 | 1 | 1 | 0 | 1 | 100 | 0 | 0 | 0 | 0 | 0 | 22:17 | 17:18 | 03:02 | 01:57 | 30143 |
| NYI | 0 | 0 | 0 | 2 | 0 | 4 | 0 | 0 | 0 | 0 | 0 | 0 | 22:25 | 17:51 | 03:51 | 00:43 | 30142 |
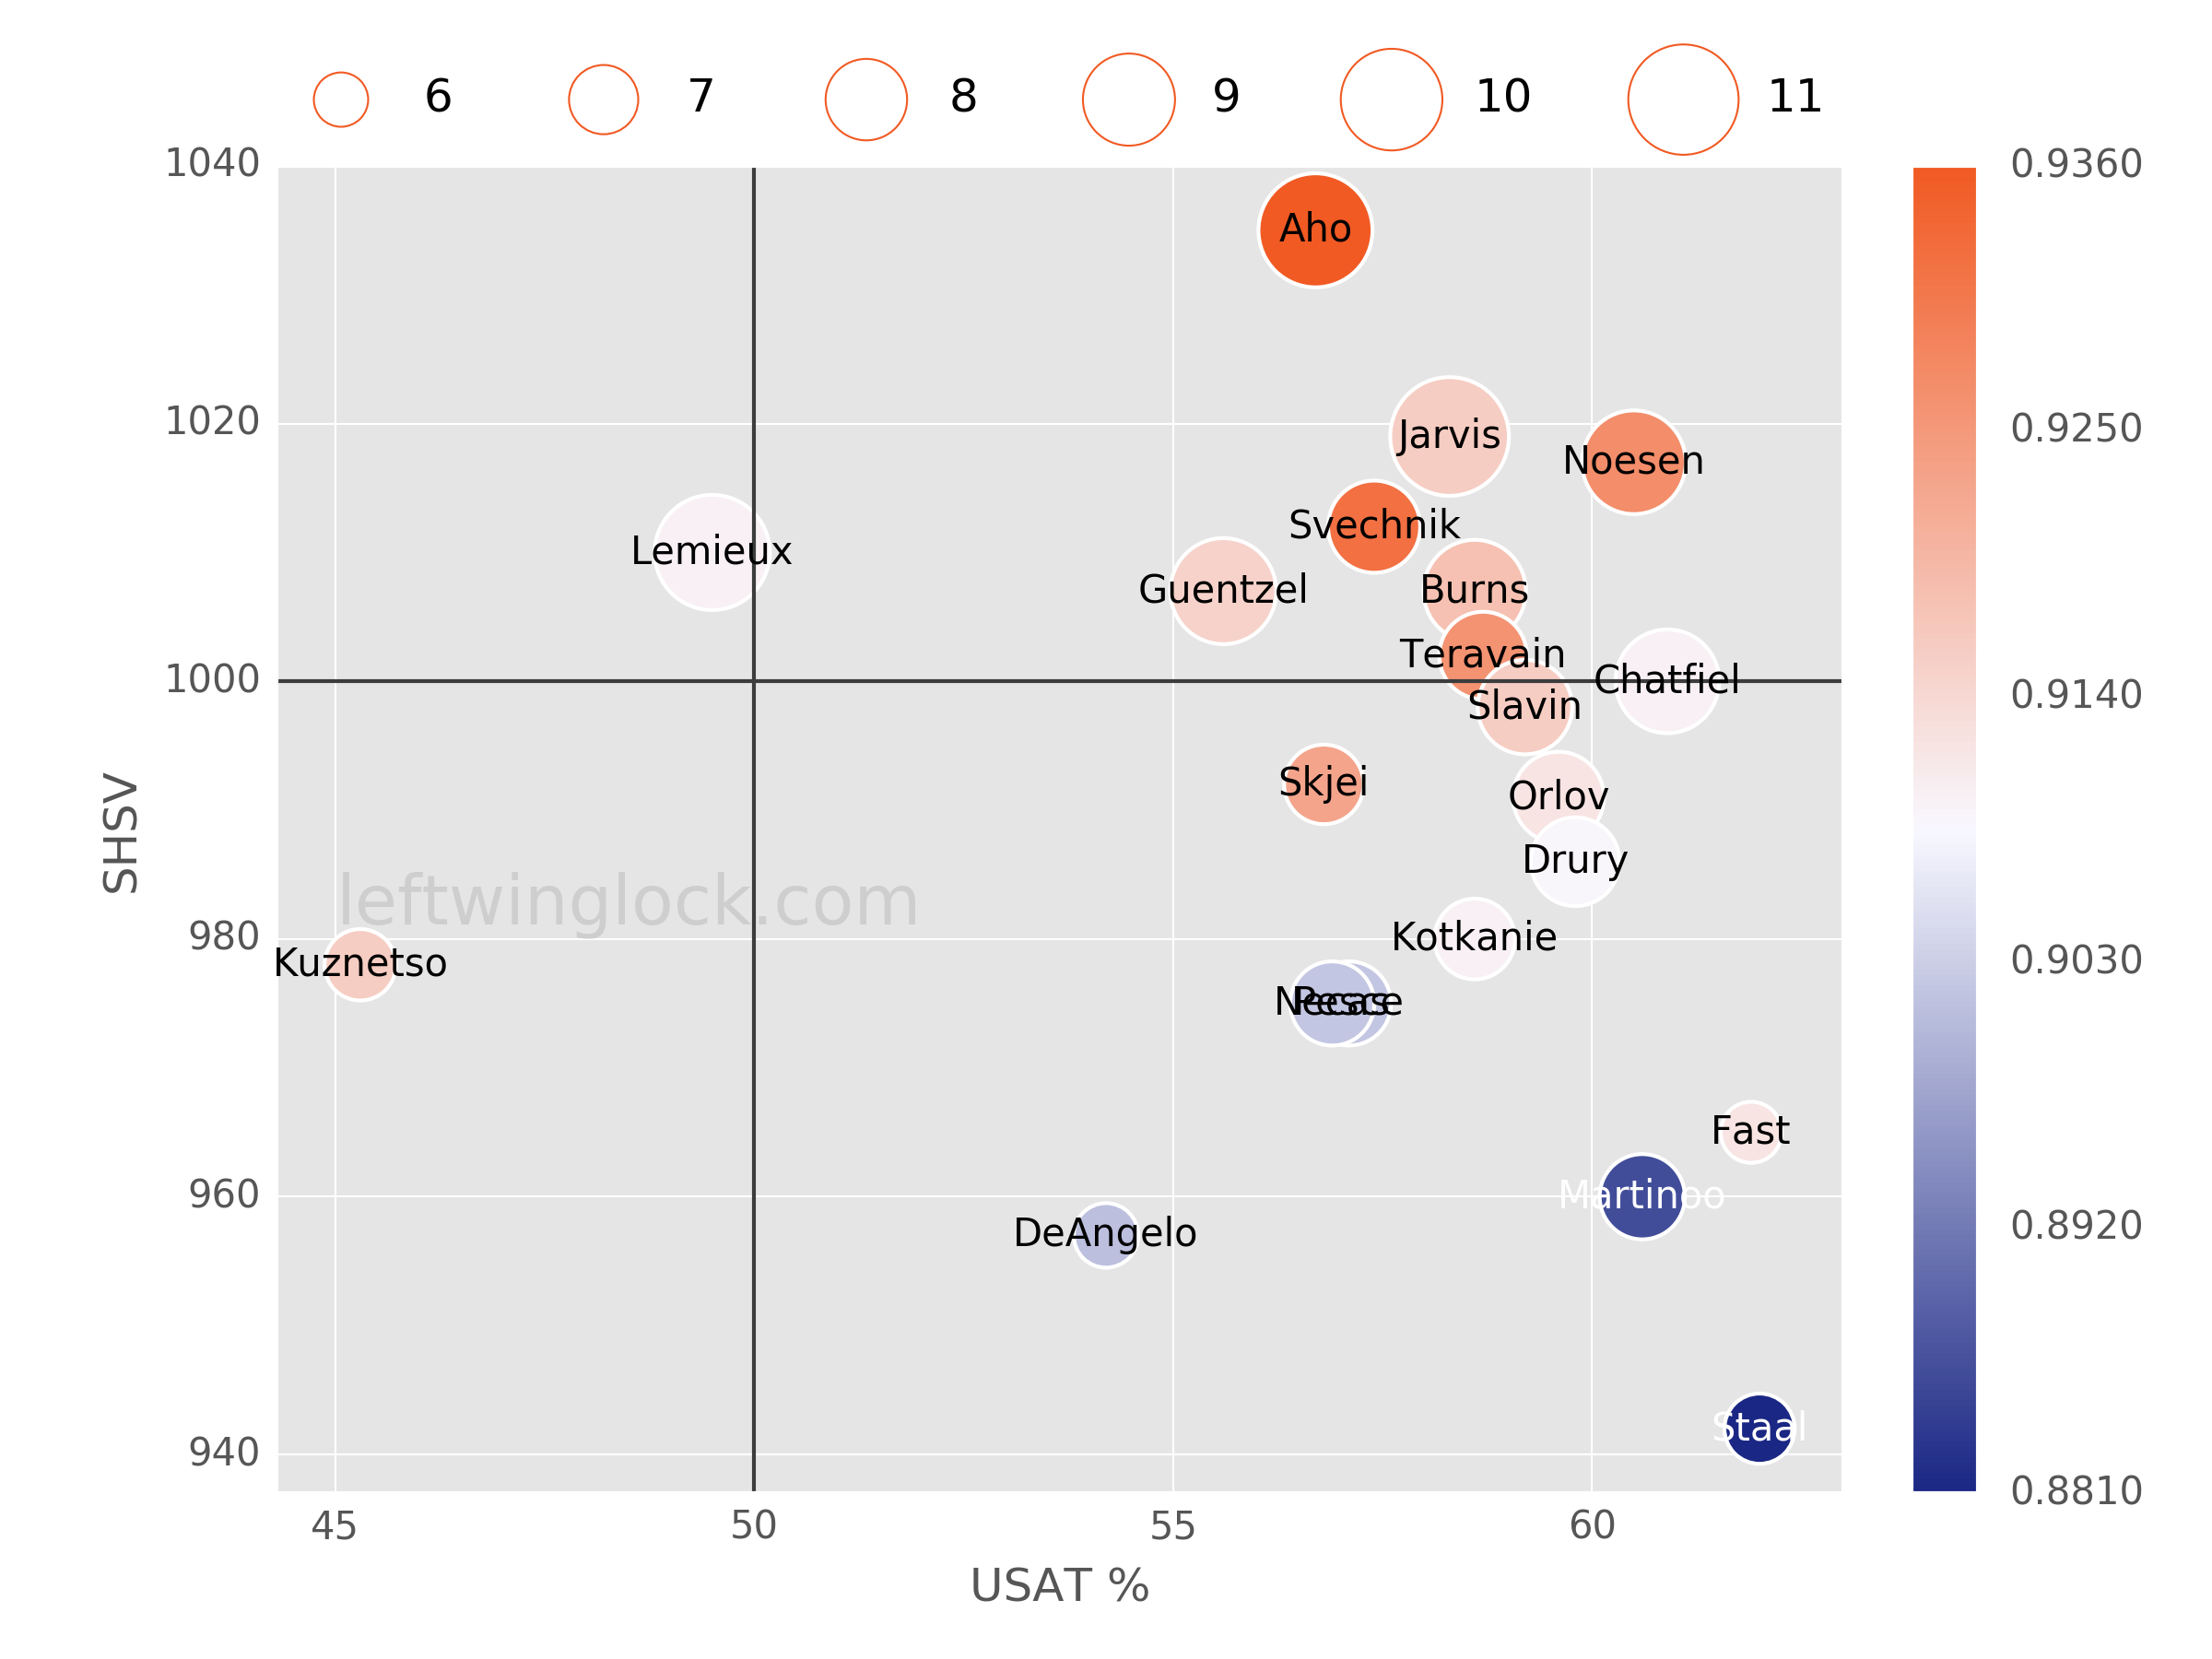
Player Usage Chart / Possession and Luck Chart