JAKUB VORACEK
Explore projections, stats, news, player usage charts, and line combinations for members of the Utah Utahs
-
Right Wing Leaders
2023 - 2024
Name G A Pts Nikita
Kucherov44 100 144 David Pastrnak 47 63 110 Mikko Rantanen 42 62 104 William Nylander 40 58 98 Mitchell Marner 26 59 85 Clayton Keller 33 43 76 Adrian Kempe 28 47 75 Brock Boeser 40 33 73 Jonathan Marchessault 42 27 69 Travis Konecny 33 35 68 Alex DeBrincat 27 40 67 Drake Batherson 28 38 66 -
Player Card
-
Utah Utahs Leaders

News
-
Jakub Voracek
Has been traded to the Arizona Coyotes, along with a 2023 6th round draft pick, in exchange for Jon Gillies.
Mar 2, 2023 - 1:01 pm -
Jakub Voracek
His chances of returning this season are considered slim. He is still dealing with concussion symptoms ...
Dec 5, 2022 - 11:06 am -
Jakub Voracek
Is not expected to be in the lineup for today's game.
Nov 10, 2022 - 10:33 am -
Jakub Voracek
Is not on the ice for practice.
Nov 8, 2022 - 11:02 am
Feature
-
Trending
Buy-Low and Sell-High: Skaters
Replies 0
Basic Stats
| Season | Team | GP | G | A | P | +/- | PIM | S | S/GP | SH% | PPP | H | BS | FW | FO% | TOI | EVTOI | PPTOI | PKTOI |
|---|---|---|---|---|---|---|---|---|---|---|---|---|---|---|---|---|---|---|---|
| 22-23 | ARI | 11 | 1 | 5 | 6 | -7 | 0 | 17 | 1.5 | 5.9 | 1 | 2 | 7 | 1 | 33.3 | 15.96 | 12.80 | 3.16 | 0.00 |
| 21-22 | CBJ | 79 | 6 | 56 | 62 | -13 | 44 | 147 | 1.9 | 4.1 | 25 | 27 | 28 | 5 | 15.2 | 17.46 | 14.22 | 3.21 | 0.02 |
| 20-21 | PHI | 53 | 9 | 34 | 43 | -12 | 18 | 104 | 2 | 8.7 | 8 | 17 | 20 | 7 | 41.2 | 16.92 | 14.29 | 2.60 | 0.03 |
| 19-20 | PHI | 69 | 12 | 44 | 56 | 14 | 31 | 132 | 1.9 | 9.1 | 17 | 17 | 21 | 7 | 35.0 | 17.04 | 14.07 | 2.95 | 0.03 |
Enhanced Stats (5-on-5 unless denoted with *)
| Season | G/60 | A/60 | P/60 | IPP | ΔPEN/60 | 1A | 2A | EVS/60* | PPS/60* | SATF | SAT% | tEVSH% | tEVSV% | SHSV | ZS% |
|---|---|---|---|---|---|---|---|---|---|---|---|---|---|---|---|
| 22-23 | 0.00 | 1.79 | 1.79 | 0 | 0.00 | 2 | 2 | 3.1 | 12.1 | 106 | 38.4 | 8.9 | 0.893 | 982 | 58.5 |
| 21-22 | 0.11 | 1.54 | 1.65 | 66 | 0.52 | 24 | 3 | 5.6 | 9.0 | 913 | 46.2 | 9.5 | 0.922 | 1017 | 58.4 |
| 20-21 | 0.68 | 1.70 | 2.38 | 79 | 0.74 | 11 | 9 | 6.5 | 10.0 | 668 | 51.9 | 10.6 | 0.873 | 979 | 56.1 |
| 19-20 | 0.40 | 1.79 | 2.19 | 76 | 0.20 | 18 | 9 | 6.1 | 10.0 | 842 | 52.9 | 10.2 | 0.924 | 1026 | 54.1 |
Regression Meter
This meter measures whether or not a player's point production is being influenced by luck. Orange indicates the player has been lucky. Dark grey indicates the player has been unlucky.
Positional Data
| Season | Team | Left | Center | Right |
|---|---|---|---|---|
| 22-23 | ARI | 0 | 0 | 0 |
| 21-22 | CBJ | 38 | 0 | 62 |
| 20-21 | PHI | 15 | 0 | 85 |
| 19-20 | PHI | 2 | 0 | 98 |
Most Common Linemates and Line Production
See also: Utah Utahs Line Combo Tool | Line Production Tool
| Team | F1 | F2 | F3 | GF | GA | GF% | SATF | SATA | SAT% | USATF | USATA | USAT% | SH% | SV% | SHSV | ZS% |
|---|
Most Recent 10 Games
| OPP | G | A | P | +/- | PIM | SOG | SH% | H | BS | FW | FL | FO% | TOI | EVTOI | PPTOI | PKTOI | ID |
|---|
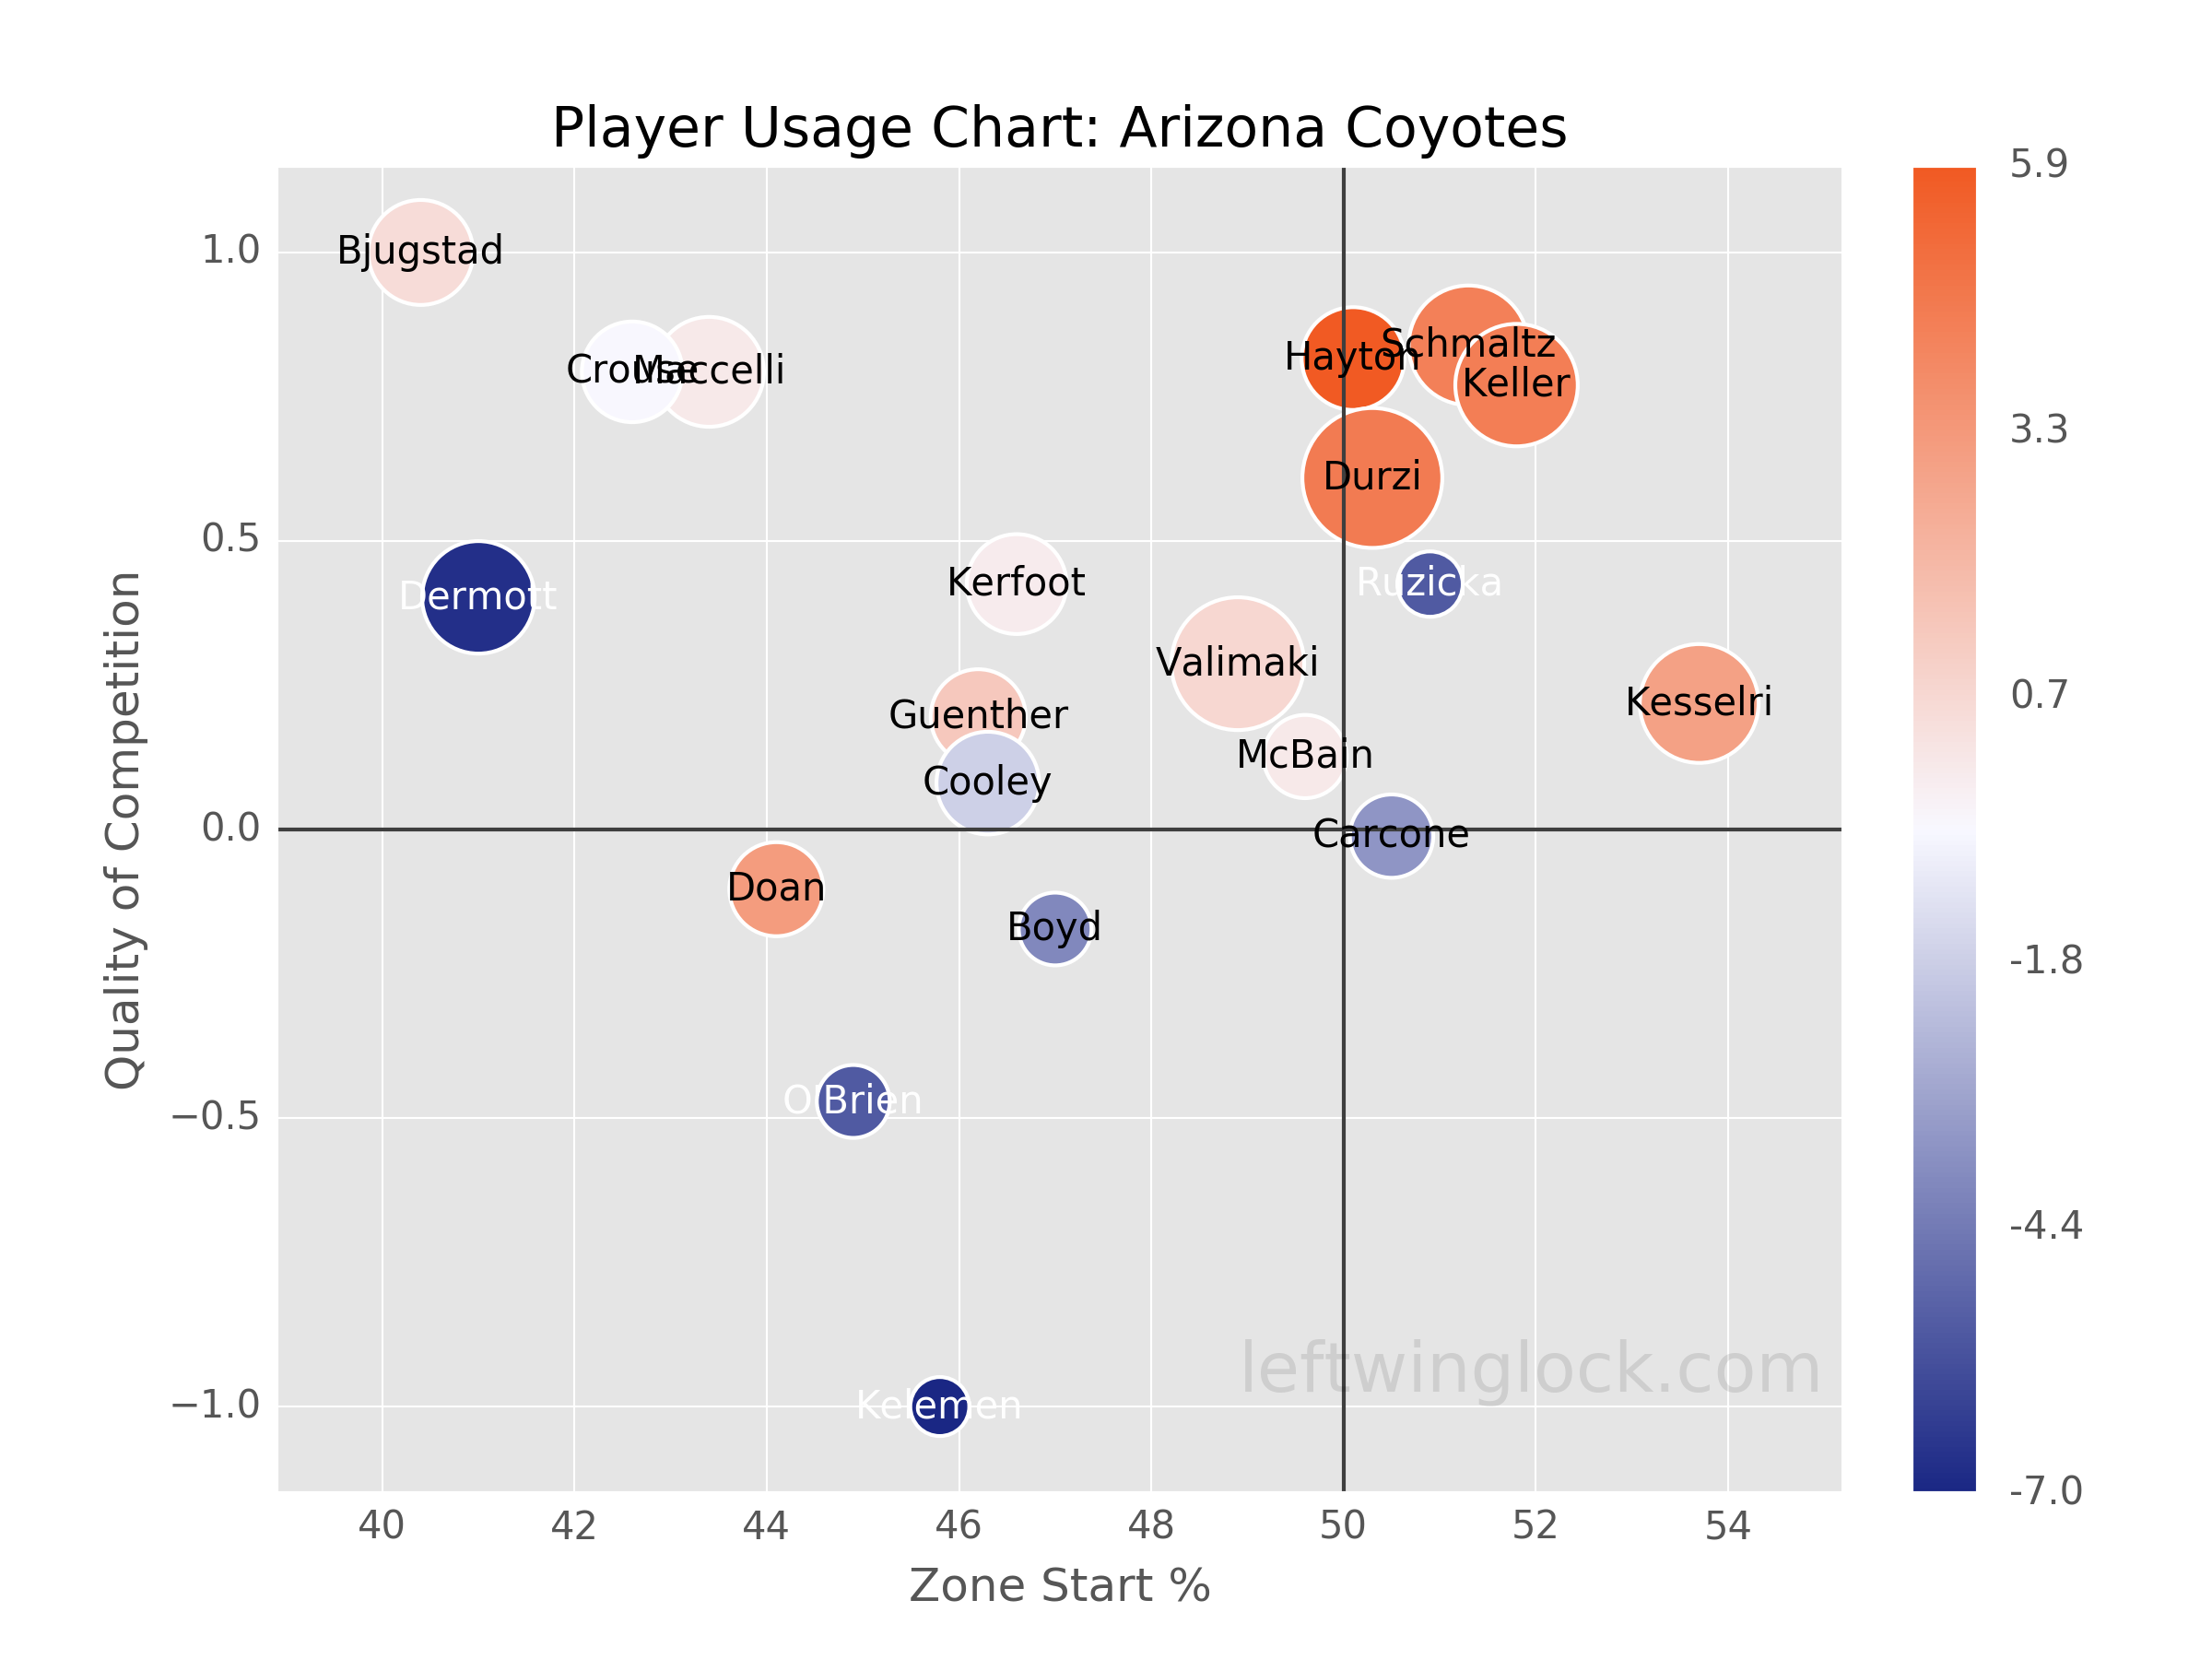
Player Usage Chart / Possession and Luck Chart