LUKE WITKOWSKI
Explore projections, stats, news, player usage charts, and line combinations for members of the St. Louis Blues
-
Defenseman Leaders
2023 - 2024
Name G A Pts Quinn
Hughes17 75 92 Cale Makar 21 69 90 Roman Josi 23 62 85 Evan Bouchard 18 64 82 Victor Hedman 13 63 76 Adam Fox 17 56 73 Noah Dobson 10 60 70 Josh Morrissey 10 59 69 Mike Matheson 11 51 62 Rasmus Dahlin 20 39 59 Morgan Rielly 7 51 58 Zach Werenski 11 46 57 -
Player Card
-
St. Louis Blues Leaders
2023 - 2024
Name G A Pts Robert
Thomas26 60 86 Jordan Kyrou 31 36 67 Pavel Buchnevich 27 36 63 Brayden Schenn 20 26 46 Brandon Saad 26 16 42 Torey Krug 4 35 39 Jake Neighbours 27 11 38 Justin Faulk 2 28 30 Kevin Hayes 13 16 29 Nick Leddy 3 25 28 Colton Parayko 10 16 26 Kasperi Kapanen 6 16 22

News
-
Luke Witkowski
Has been traded to the St. Louis Blues, along with Nick Leddy, in exchange for Oskar Sundqvist, Jake Walman, and a 2023 2nd round draft pick.
Mar 21, 2022 - 2:08 pm -
Luke Witkowski
Has been reassigned to the AHL.
Dec 10, 2021 - 5:23 pm -
Luke Witkowski
Has been recalled from the AHL.
Dec 7, 2021 - 10:48 am -
Luke Witkowski
Has been placed on waivers.
Nov 2, 2019 - 12:12 pm
Feature
-
Trending
No articles available
Replies 0
Basic Stats
| Season | Team | GP | G | A | P | +/- | PIM | S | S/GP | SH% | PPP | H | BS | FW | FO% | TOI | EVTOI | PPTOI | PKTOI |
|---|---|---|---|---|---|---|---|---|---|---|---|---|---|---|---|---|---|---|---|
| 21-22 | STL | 1 | 0 | 0 | 0 | 0 | 0 | 0 | 0 | 0.0 | 0 | 1 | 0 | 0 | 0.0 | 9.30 | 9.30 | 0.00 | 0.00 |
| 19-20 | TBL | 12 | 1 | 2 | 3 | -4 | 13 | 10 | 0.8 | 10.0 | 0 | 38 | 3 | 0 | 0.0 | 8.80 | 8.66 | 0.05 | 0.09 |
Enhanced Stats (5-on-5 unless denoted with *)
| Season | G/60 | A/60 | P/60 | IPP | ΔPEN/60 | 1A | 2A | EVS/60* | PPS/60* | SATF | SAT% | tEVSH% | tEVSV% | SHSV | ZS% |
|---|---|---|---|---|---|---|---|---|---|---|---|---|---|---|---|
| 21-22 | 0.00 | 0.00 | 0.00 | 0 | 6.45 | 0 | 0 | 0.0 | 0.0 | 5 | 29.4 | 0.0 | 0.000 | 0 | 20.0 |
| 19-20 | 0.51 | 1.03 | 1.54 | 100 | -1.70 | 1 | 1 | 5.1 | 0.0 | 71 | 36.7 | 6.9 | 0.913 | 982 | 63.1 |
Regression Meter
This meter measures whether or not a player's point production is being influenced by luck. Orange indicates the player has been lucky. Dark grey indicates the player has been unlucky.
2A/60
tEVSH%
SH%
IPP
PPSH%
Positional Data
| Season | Team | Left | Center | Right |
|---|---|---|---|---|
| 21-22 | STL | 0 | 0 | 0 |
| 19-20 | TB | 0 | 0 | 100 |
Most Common Pairings and Pair Production
See also: St. Louis Blues Line Combos | Line Production Tool
| Team | D1 | D2 | GF | GA | GF% | SATF | SATA | SAT% | USATF | USATA | USAT% | SH% | SV% | SHSV | ZS% |
|---|
Most Recent 10 Games
| OPP | G | A | P | +/- | PIM | SOG | SH% | H | BS | FW | FL | FO% | TOI | EVTOI | PPTOI | PKTOI | ID |
|---|
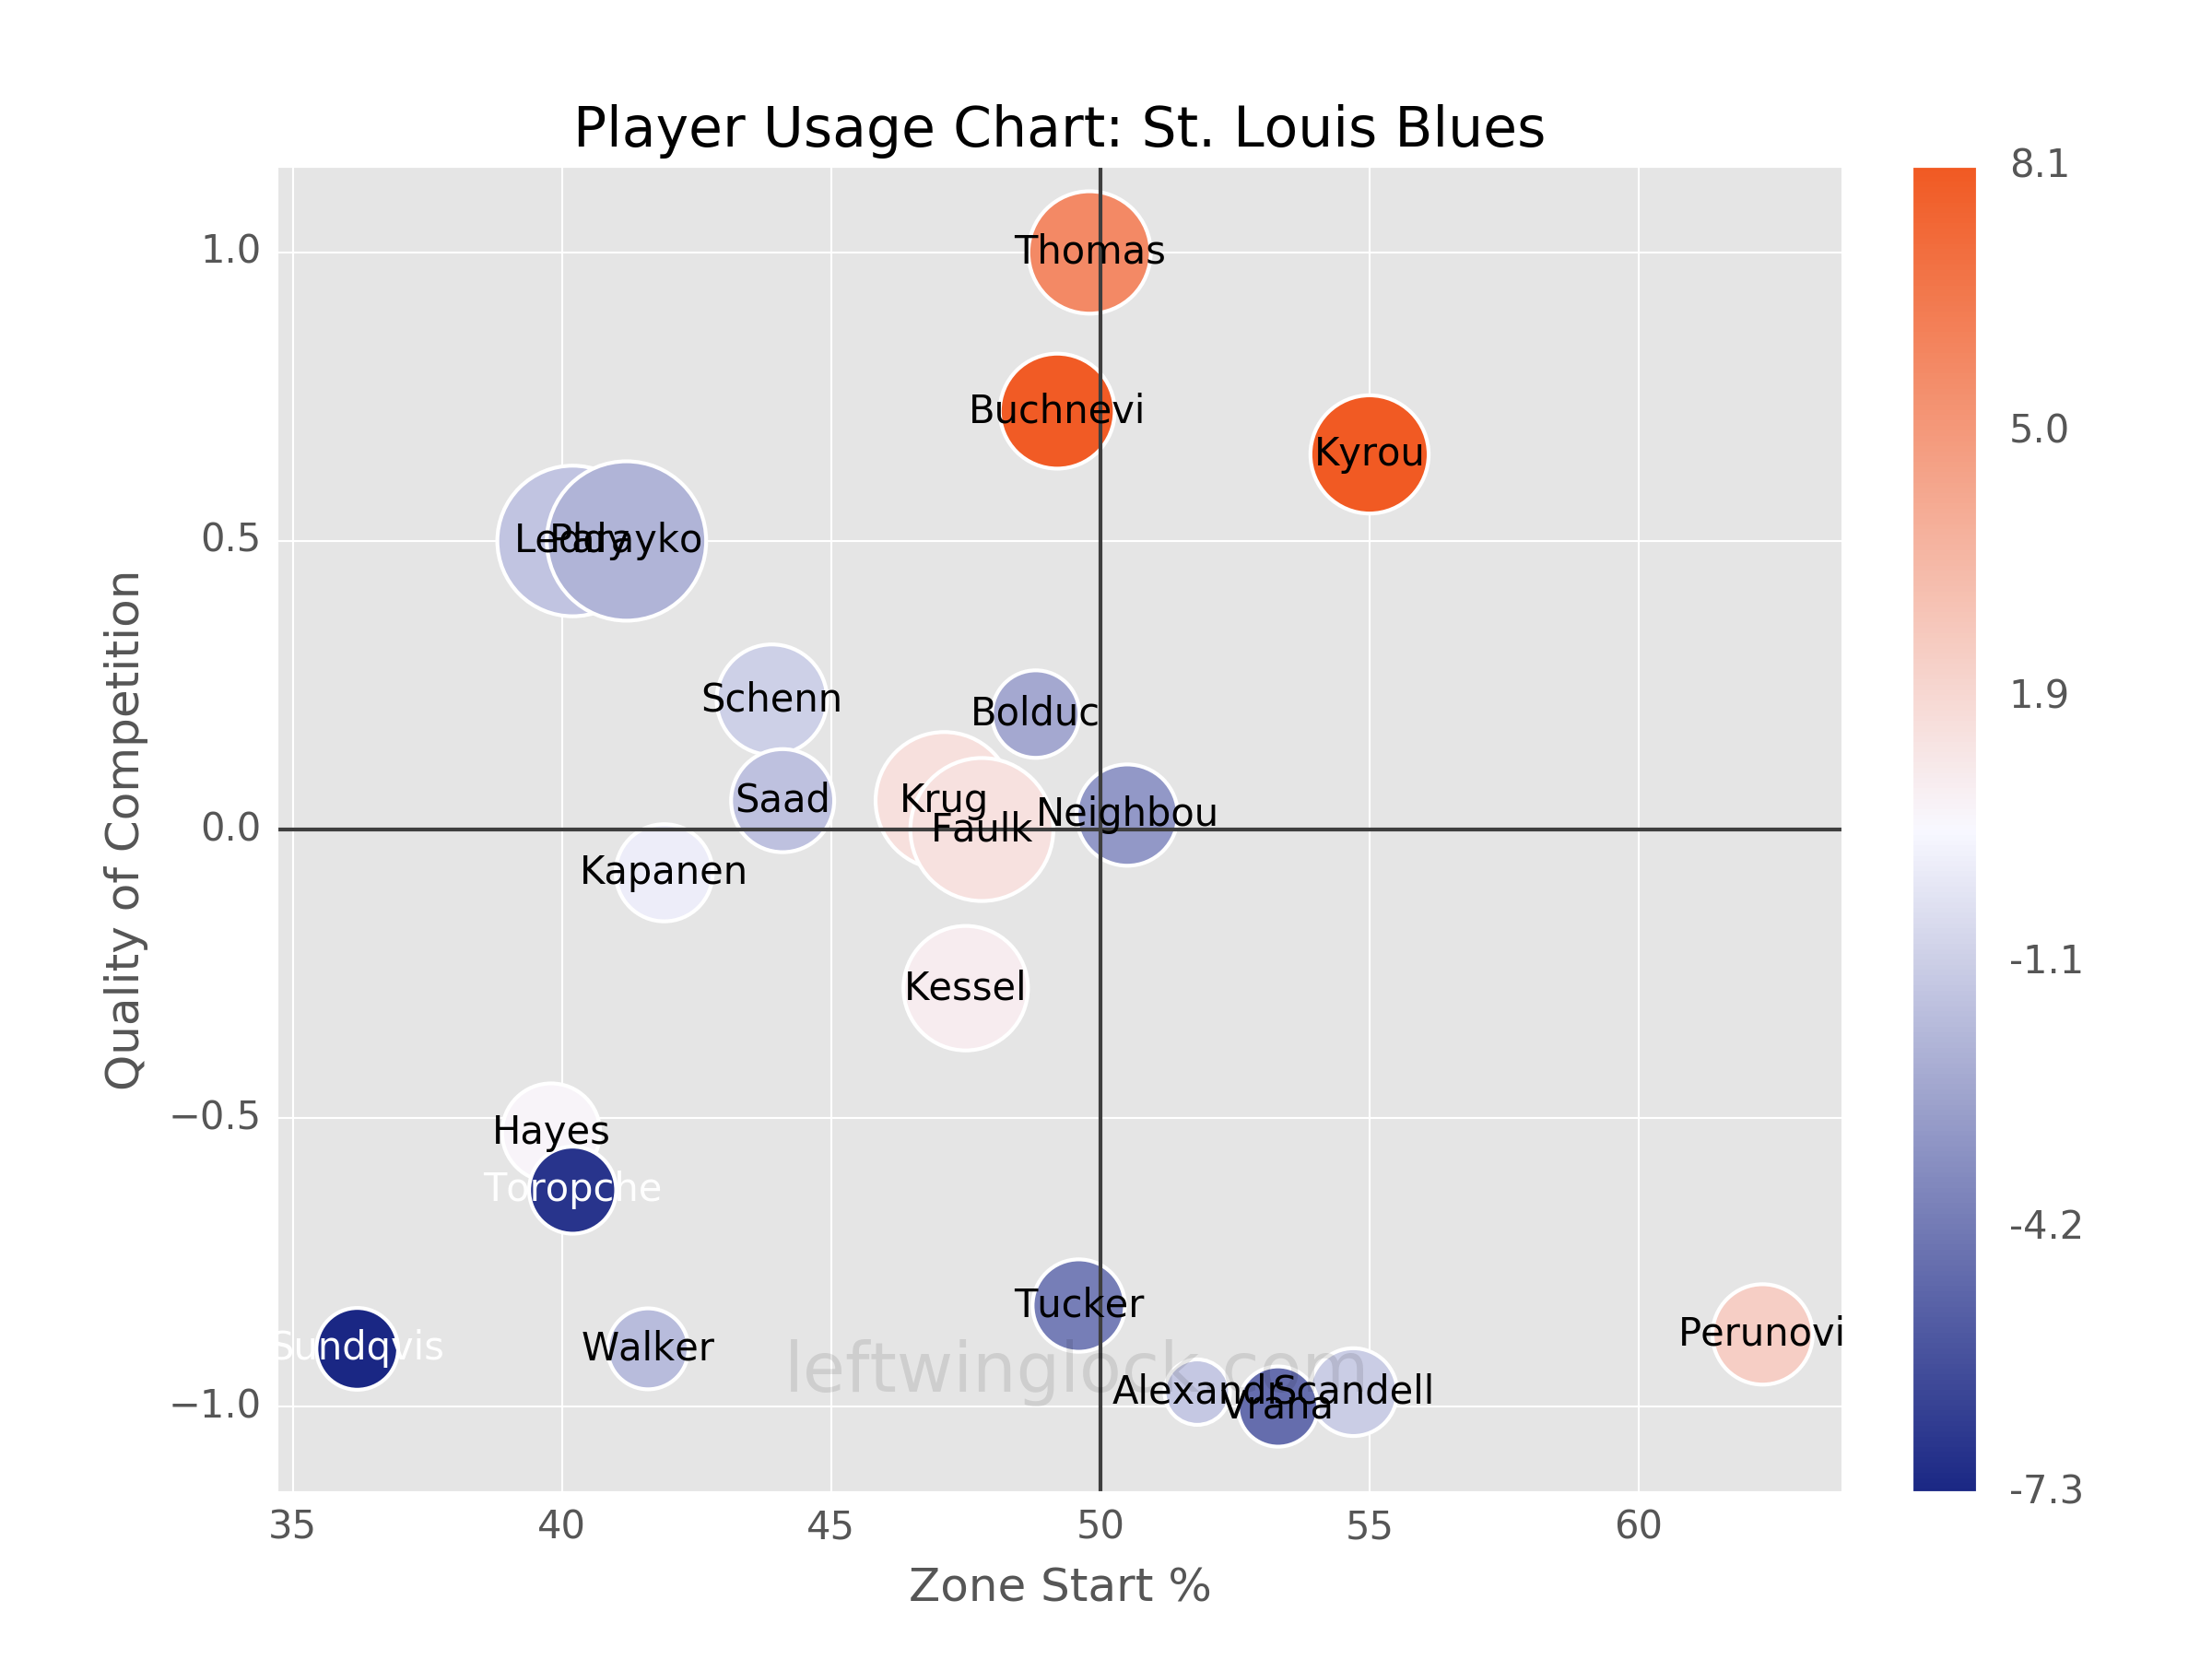
Player Usage Chart / Possession and Luck Chart