Wayne Simmonds
Explore projections, stats, news, player usage charts, and line combinations for members of the Toronto Maple Leafs
-
Right Wing Leaders
2023 - 2024
Name G A Pts Nikita
Kucherov44 100 144 David Pastrnak 47 63 110 Mikko Rantanen 42 62 104 William Nylander 40 58 98 Mitchell Marner 26 59 85 Clayton Keller 33 43 76 Adrian Kempe 28 47 75 Brock Boeser 40 33 73 Jonathan Marchessault 42 27 69 Travis Konecny 33 35 68 Alex DeBrincat 27 40 67 Drake Batherson 28 38 66 -
Player Card
-
Toronto Maple Leafs Leaders
2023 - 2024
Name G A Pts Auston
Matthews69 38 107 William Nylander 40 58 98 Mitchell Marner 26 59 85 John Tavares 29 36 65 Morgan Rielly 7 51 58 Max Domi 9 38 47 Tyler Bertuzzi 21 22 43 Matthew Knies 15 20 35 Jake McCabe 8 20 28 Nicholas Robertson 14 13 27 TJ Brodie 1 25 26 Bobby McMann 15 9 24

News
-
Wayne Simmonds
Is expected to be in the lineup for today's game.
Apr 2, 2023 - 11:55 am -
Wayne Simmonds
Is on the ice for warmups.
Mar 26, 2023 - 5:31 pm -
Wayne Simmonds
Is expected to be in the lineup for today's game.
Mar 18, 2023 - 12:45 pm -
Wayne Simmonds
Has cleared waivers.
Feb 15, 2023 - 2:02 pm
Feature
-
Trending
Buy-Low and Sell-High: Skaters
Replies 0
Basic Stats
| Season | Team | GP | G | A | P | +/- | PIM | S | S/GP | SH% | PPP | H | BS | FW | FO% | TOI | EVTOI | PPTOI | PKTOI |
|---|---|---|---|---|---|---|---|---|---|---|---|---|---|---|---|---|---|---|---|
| 22-23 | TOR | 18 | 0 | 2 | 2 | 1 | 49 | 9 | 0.5 | 0.0 | 0 | 44 | 7 | 4 | 100.0 | 7.45 | 7.42 | 0.03 | 0.00 |
| 21-22 | TOR | 72 | 5 | 11 | 16 | -7 | 96 | 79 | 1.1 | 6.3 | 1 | 148 | 11 | 3 | 50.0 | 9.33 | 9.10 | 0.22 | 0.01 |
| 20-21 | TOR | 38 | 7 | 2 | 9 | -3 | 45 | 62 | 1.6 | 11.3 | 3 | 64 | 15 | 6 | 50.0 | 11.99 | 10.20 | 1.79 | 0.00 |
| 19-20 | NJD | 68 | 8 | 17 | 25 | -21 | 66 | 119 | 1.8 | 6.7 | 9 | 145 | 29 | 29 | 39.2 | 14.92 | 12.33 | 2.59 | 0.00 |
Enhanced Stats (5-on-5 unless denoted with *)
| Season | G/60 | A/60 | P/60 | IPP | ΔPEN/60 | 1A | 2A | EVS/60* | PPS/60* | SATF | SAT% | tEVSH% | tEVSV% | SHSV | ZS% |
|---|---|---|---|---|---|---|---|---|---|---|---|---|---|---|---|
| 22-23 | 0.00 | 0.91 | 0.91 | 50 | -3.13 | 1 | 1 | 4.1 | 0.0 | 111 | 47.2 | 8.3 | 0.952 | 1035 | 58.4 |
| 21-22 | 0.46 | 0.93 | 1.39 | 65 | -0.18 | 4 | 6 | 7.2 | 3.8 | 577 | 49.5 | 7.2 | 0.918 | 990 | 56.3 |
| 20-21 | 0.62 | 0.31 | 0.94 | 78 | -0.40 | 0 | 2 | 8.3 | 8.0 | 352 | 52.2 | 4.5 | 0.950 | 995 | 49.7 |
| 19-20 | 0.22 | 0.74 | 0.97 | 60 | -0.53 | 6 | 4 | 6.3 | 11.9 | 732 | 46.7 | 5.6 | 0.919 | 975 | 47.0 |
Regression Meter
This meter measures whether or not a player's point production is being influenced by luck. Orange indicates the player has been lucky. Dark grey indicates the player has been unlucky.
2A/60
tEVSH%
SH%
IPP
PPSH%
Positional Data
| Season | Team | Left | Center | Right |
|---|---|---|---|---|
| 22-23 | TOR | 6 | 0 | 94 |
| 21-22 | TOR | 7 | 0 | 93 |
| 20-21 | TOR | 14 | 0 | 86 |
| 19-20 | NJ | 5 | 0 | 95 |
Most Common Linemates and Line Production
See also: Toronto Maple Leafs Line Combo Tool | Line Production Tool
| Team | F1 | F2 | F3 | GF | GA | GF% | SATF | SATA | SAT% | USATF | USATA | USAT% | SH% | SV% | SHSV | ZS% |
|---|
Most Recent 10 Games
| OPP | G | A | P | +/- | PIM | SOG | SH% | H | BS | FW | FL | FO% | TOI | EVTOI | PPTOI | PKTOI | ID |
|---|
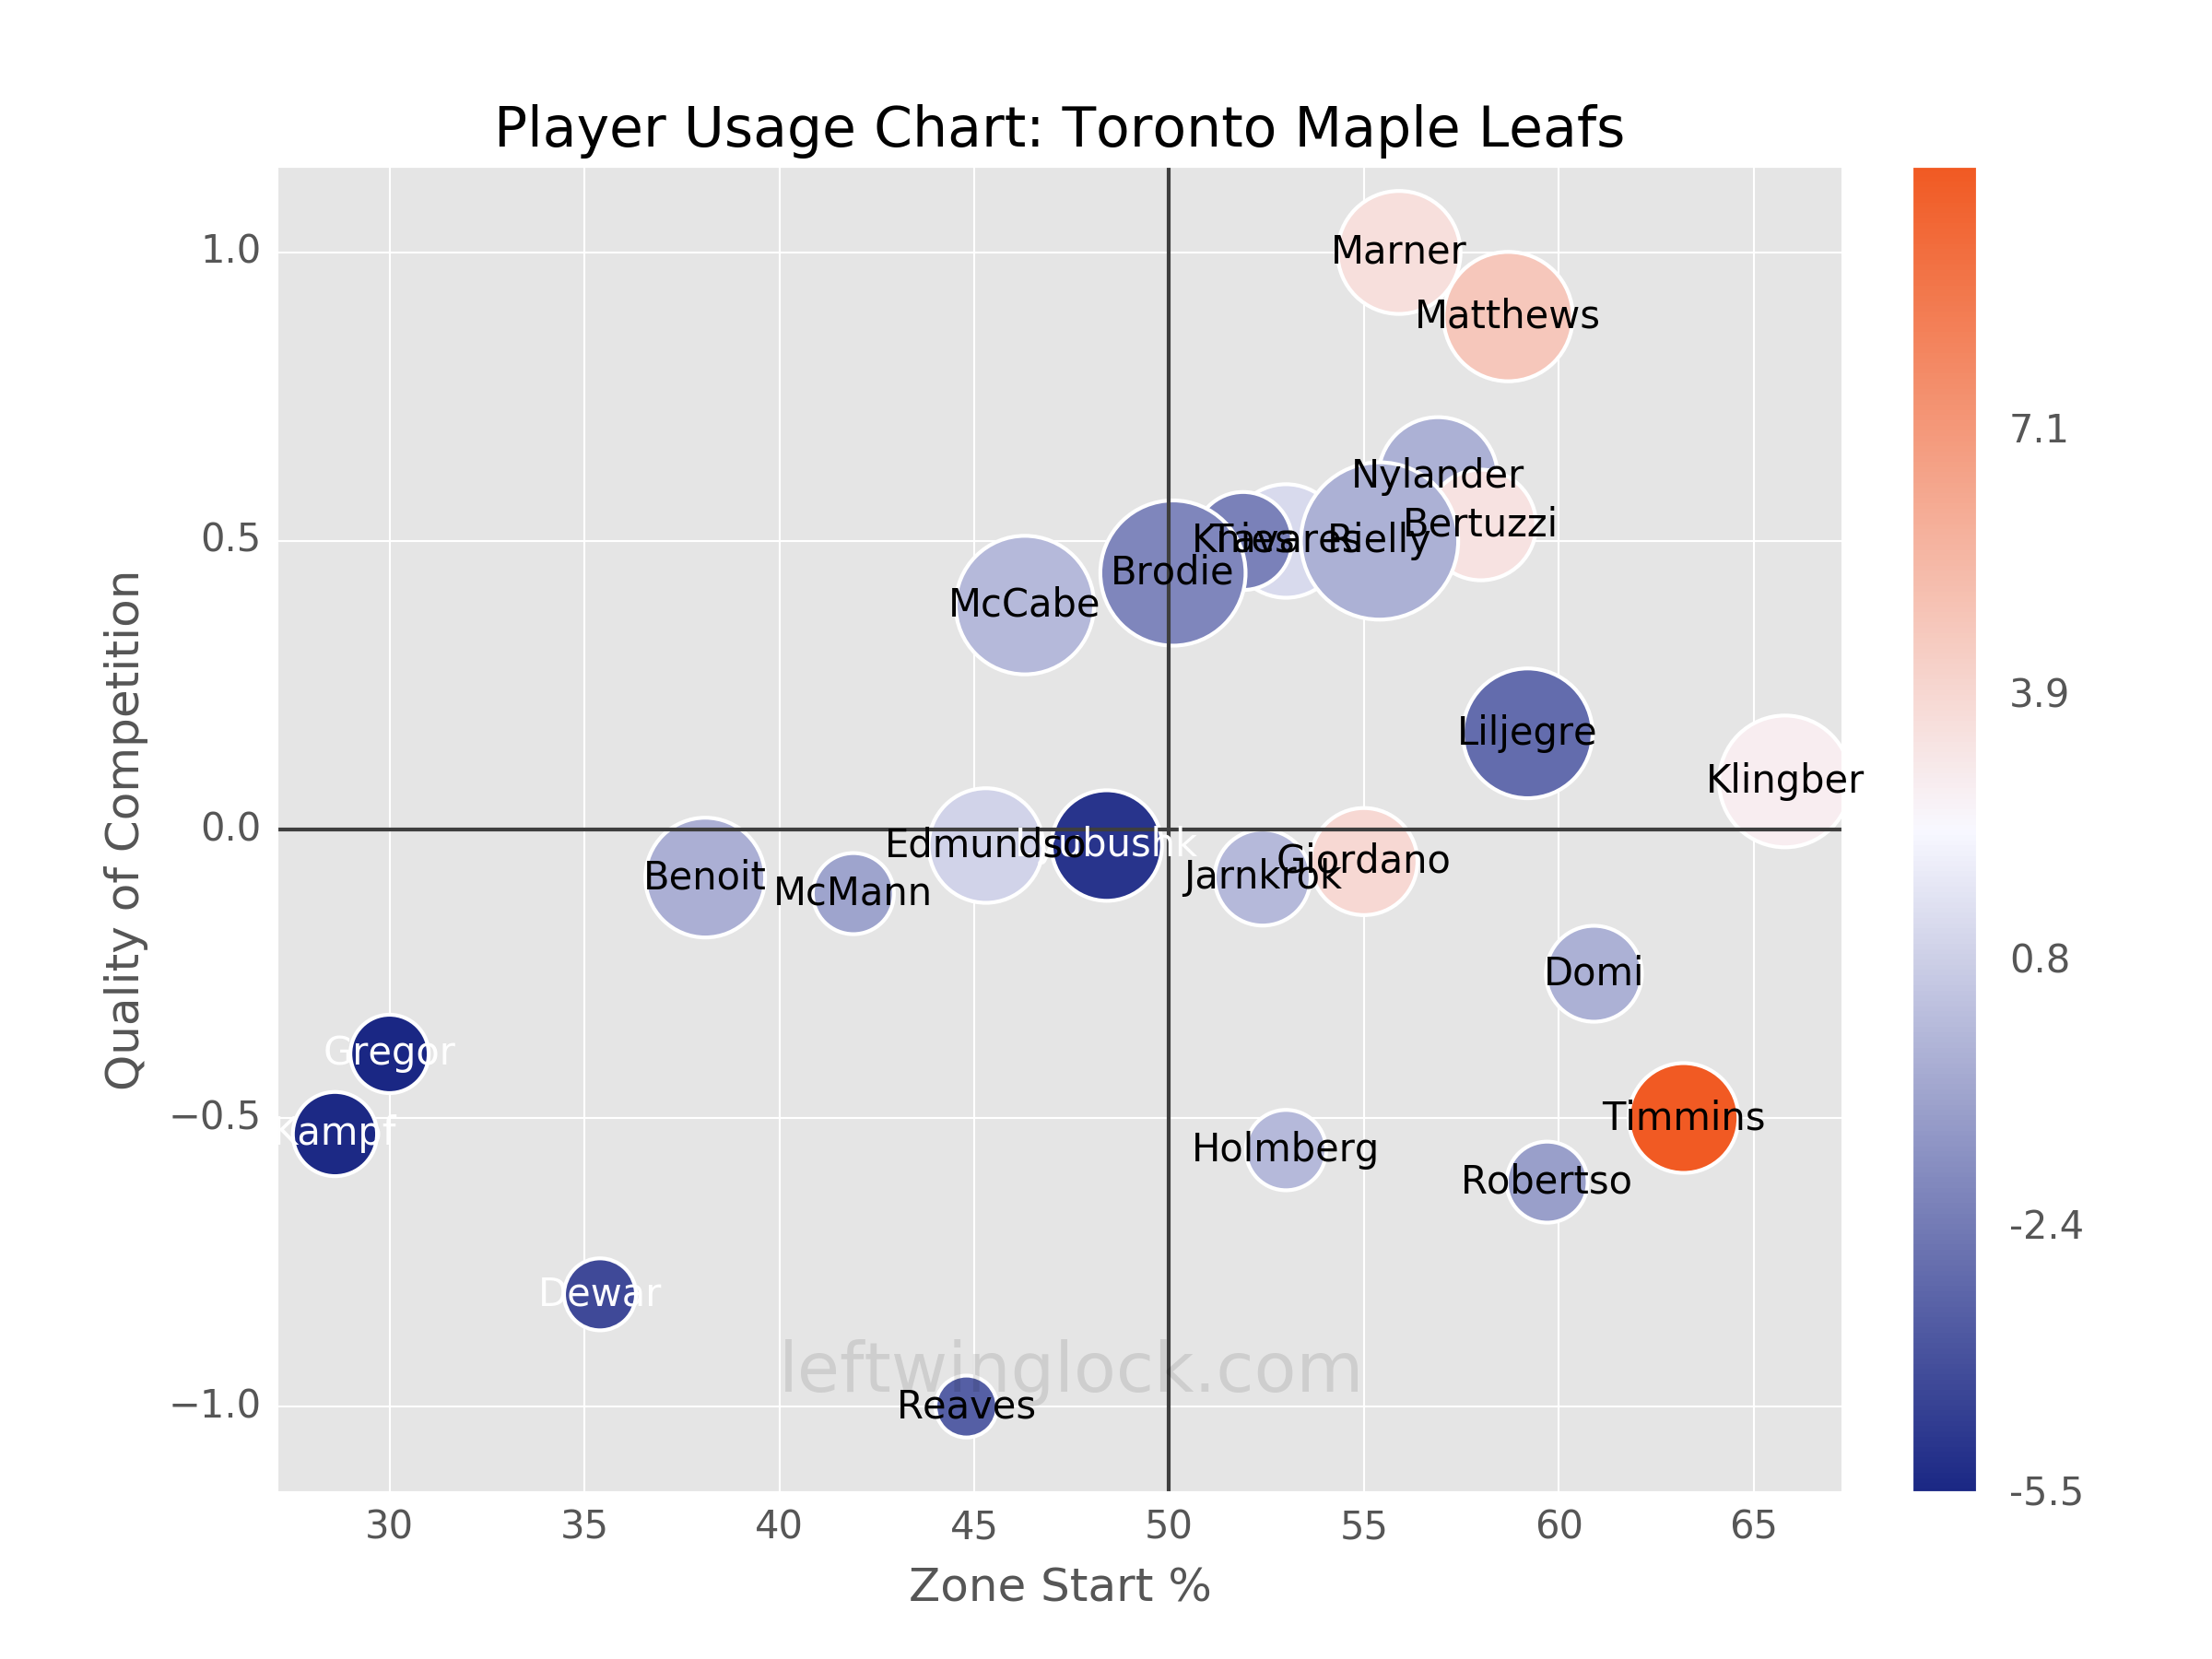
Player Usage Chart / Possession and Luck Chart