State of the League
Introduction
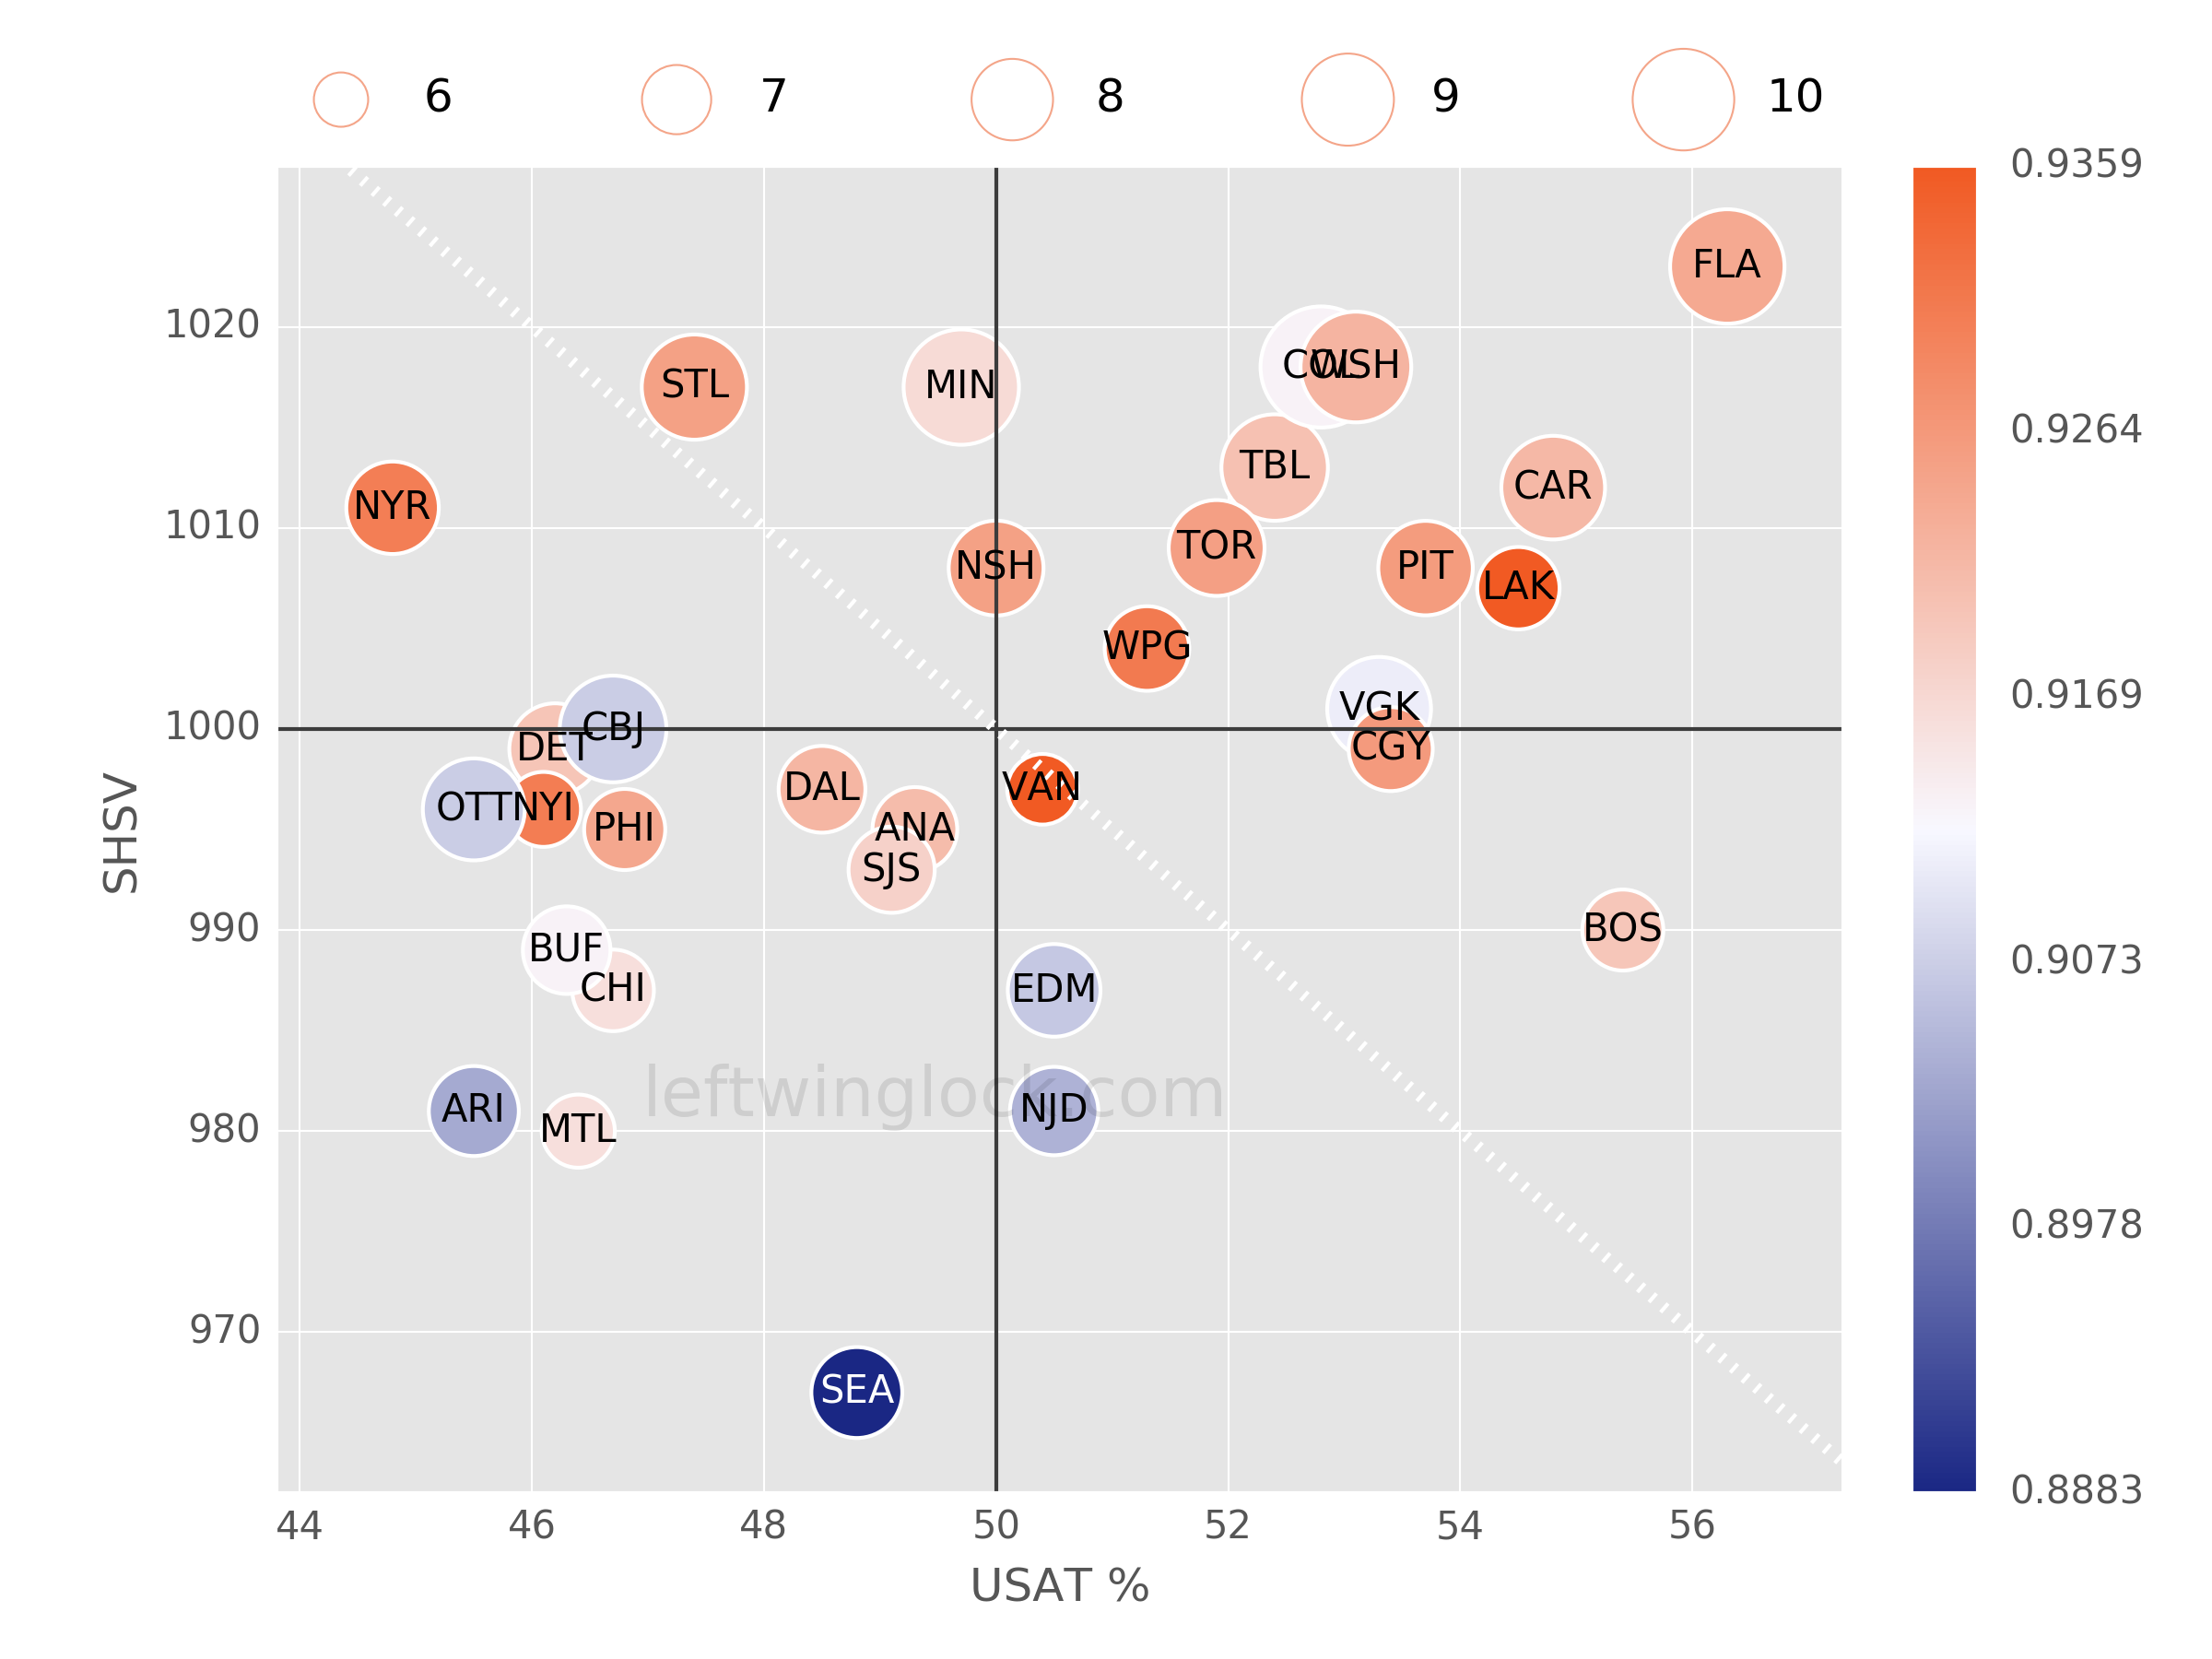
In our December 1 article, State of the League, we used our Possession and Luck (PLUCK) chart to find mismatches between a team's process and a team's standings placement. These mismatches created opportunities for fantasy hockey managers to make trades to improve their teams. As we approach the halfway point of the NHL season, we'd like to use the PLUCK chart again to find value for our fantasy hockey teams. Let's jump in. The PLUCK chart is a single graphic that shows you whether a team's results so far are driven by puck possession or luck (or both). Figure 1 is the PLUCK chart for all games through January 15:
Reading the Chart
BUBBLE HORIZONTAL POSITION
The x-axis measures puck possession and uses USAT% as the metric. USAT% is computed by finding what fraction of all unblocked shot attempts in games were generated by the team in question. A USAT% value greater than 50% suggests that a team is consistently outshooting their opponents.
BUBBLE VERTICAL POSITION
The y-axis measures luck at even-strength hockey and uses SHSV as the metric. SHSV is computed by using a team's even-strength shooting percentage and adding it to the team's even-strength save percentage (multiplied by 1000). Teams with values that stray significantly from 1000 are having their results influenced by luck.
BUBBLE SIZE
The size of each bubble measures the even-strength shooting percentage (EVSH%) of a team. The league average value (in recent years) is 8.3%.
BUBBLE COLOR
The color of each bubble measures the even-strength save percentage (EVSV%) of a team. The league average value (in recent years) is 0.917.
DASHED WHITE LINE
Historically, teams above the dashed white line are the most likely to qualify for the playoffs.
GENERAL COMMENTS
A team's vertical position can be an immediate tell that their results this season have been influenced by luck. But, it is the bubble size (EVSH%) and bubble color (EVSV%) that tell you what aspect of their game is being influenced by luck.
Bubbles to the right side of the chart (past the 50% USAT indicator) indicate that a team is outshooting their opponents on average at even-strength. This is usually where you want your team to live (but it's not the only way to win hockey games and it does not guarantee you'll win more often than you'll lose).
Very large bubbles are not a good thing. It means a team is benefitting from strong luck at even-strength (their shots are going into the net at a rate higher than normal). This is unsustainable over the course of a season and an indication that scoring is about to dry up.
Extreme data points (very large/small bubbles; dark orange/blue bubbles) may indicate a coming change (for better or for worse). For reference, the most extreme full-season values for SHSV (the vertical position of a team's bubble) over the past five years have been 987 (lowest) and 1017 (highest).
A significant majority of Stanley Cup winners have had season-ending bubbles that were found in the upper-right quadrant.
Mismatches
The Eastern Conference playoffs are already settled. The seven Eastern Conference teams above the dashed white line in Figure 1 are playoff locks; the New York Rangers, found at the approximate coordinates (45,1010) make eight. While the Rangers are in no danger of falling out of playoff contention, their bubble placement prompts further sturdy. Why is a team that has horrible puck possession metrics near the top of their division in the standings? The bubble's color gives us a clue; the Rangers are getting outstanding goaltending at even-strength. But that can't be the entire story. The New York Islanders, who also have great even-strength goaltending and weak puck possession metrics have very little chance of making the playoffs (even with 4-8 games in hand over teams above them, the Islanders are unlikely to catch their opponents). The limits of the PLUCK chart should motivate you to dig into other aspects of the Rangers' game. One such aspect worth exploring is Igor Shesterkin's penalty-kill save percentage (PKSV%) of 0.946. The highest PKSV% since 2000-2001 is 0.919 (minimum 60 starts to make sure we're looking at starting goalies). If you lower the minimum starts to 50, you find just two goalies (in 20+ years) who have exceeded 0.919. Shesterkin is getting lucky on the penalty kill; this luck drives his save percentage up and leads to the Rangers winning more games than expected. Fantasy hockey managers should bet on the most likely outcome here: Shesterkin's PKSV% will drop in the second half of the season and the Rangers will win games at a decreased rate.
The San Jose Sharks went 9-7-1 since our December 1 article. They are one of many teams in the hunt for a Western Conference wildcard spot. Does their recent surge in the standings match the process? On December 1, the Sharks had possession stats below 47%. Figure 1 shows that San Jose's season-long possession stats now sit at about 49%. That's a big jump; since the Sharks had played 23 games by December 1 (and 17 games since), it's clear that their recent possession game is strong (51% since December 1). Notably, the Sharks' bubble size and color did not change significantly during this span, indicating that the results are possession-driven as opposed to luck-driven. In this case, the process does match the results and the Sharks are a legitimate contender for a wildcard spot.
Through their first 18 games, the Colorado Avalanche were shooting with 9.8% success at even-strength (the league average sits at 8.3%). Since our December 1 article, the Avalanche have converted 11.0% of their even-strength shots into goals. This can be seen easily in Figure 1 as Colorado now has the largest bubble on the chart. They've won 14 of 18 games since December 1 and these results have been partially driven by a lucky shooting percentage. Expect Colorado to cool off just a bit going forward; this might put more pressure on the Colorado goaltending which has been average (at best) to date.
The Chicago Blackhawks, who were the league's worst puck possession team at the time of our December 1 article, have made significant strides in turning around that aspect of their game (Chicago made a coaching change on November 6). Since December 1, the team has a USAT% of 48.1% (ranked 20th in the league); compare that to their league-worst value of 44.8% back on December 1. The Blackhawks have won eight of 18 games since December 1 due, in part, to their improvement in puck possession. Also of interest is the change in the team's bubble size and color. Their EVSH% has improved from 6.5% to 7.8%, while their EVSV% improved from 0.907 to 0.927 (these are pre-December 1 to post-December 1 comparisons). So, while the team has been a little luckier than usual as of late, owners of Marc-Andre Fleury can be comfortable in the knowledge that the team's recent run is based in possession moreso than in luck.
The change in the horizontal position of the Vegas Golden Knights' bubble from December 1 to January 15 should scare the hell out of the NHL. Since December 1, the Golden Knights have played with a USAT% of 57.3% (second only to the Los Angeles Kings at 57.6% over that same span). They've accomplished this turnaround despite not having Max Pacioretty in the lineup since December 28. The Golden Knights will soon add Jack Eichel to their active roster. If it weren't for substandard goaltending by Robin Lehner, Vegas would be running away with the Western Conference title by now. Be afraid, NHL; this Golden Knights team is much better than their 1st place spot in the Pacific Division indicates.
Finally, if you're interested in betting on the NHL, you should know that 82% of Stanley Cup champions from the past 11 years had a bubble that lived in the upper-right quadrant of the PLUCK chart. No Cup winner has had a bubble below the white-dotted line (looking at you, New York Rangers).
Review of December 1 Predictions
What good is a tool if it can't make accurate predictions? In our December 1 article, State of the League, we explored six ideas using the PLUCK chart as our guide. First, we noted that the Vancouver Canucks' standings position did not match their process. We promoted Thatcher Demko as a buy-low target. Demko proceeded to earn nine wins in 13 starts; he posted a 0.925 SV%, a 2.29 GAA, and a shutout. Across these metrics for starting goalies, Demko finished in the Top-3 in the league during this time frame.
We predicted that the Calgary Flames goalies would suffer a noticeable drop in their save percentages, leading to a drop in wins for the team as a whole. During this time frame, Jacob Markstrom posted a SV% of 0.898 and Dan Vladar posted a SV% of 0.869. The Flames won just four of their 12 games.
Tuukka Rask has started just one game, so it's not yet fair to evaluate our Boston statement.
Flyers GM Chuck Fletcher noted that the team was more accurately assessed by their first 10 games of the season. We disagreed and expected the Flyers to continue on a path that kept them out of the playoffs. Since that time, the Flyers have won just five of 17 games and have been outscored by opponents to the tune of 18 goals.
We expected the vertical position of Seattle's bubble to rise about 20 units (from 965) by the end of the season. The bubble has hardly budged to a value of 967. We still expect this bubble to rise, but the pace so far has been anemic.
Finally, we predicted that the Washington Capitals would start to lose games at a higher frequency as their even-strength scoring began an expected descent. Notably, Ilya Samsonov's winning percentage went from 90%, noted in our article, to just 44%. Washington's tEVSH%, which was 10.8% prior to our article, came in at just 7.4% since December 1.
Final Notes
The PLUCK chart can be used to better understand the relationship between a team's process and a team's results. And with that understanding comes the ability to potentially predict the direction a team is heading in the coming months. This knowledge should put you in a position to outwit your opponents in fantasy hockey, specifically when it comes to determining the future results of a team's goaltending.
The PLUCK chart in this article is for games through January 15. Our dynamic PLUCK chart is updated on a nightly basis.
Comments (0)
Leave a comment
In order to leave a comment, you must be a registered user at our website and logged in.