Trading William Karlsson
Introduction
The Vegas Golden Knights are primed to play in their 20th game of the season Wednesday night against the Dallas Stars in a battle of the top Western Conference teams. William Karlsson leads the Golden Knights in both goals (9) and points (20) through their first 19 games of the season. The 30-year-old forward has nine points (six goals) in his most recent nine games despite averaging just 12.5 minutes of even-strength ice time per game. Through Monday's games, Karlsson is ranked in the Top-20 of goal scorers in the NHL.
Karlsson is currently rostered in 81% of Yahoo fantasy leagues, but had an ownership rate of just 3% on opening night. His average draft position (ADP) was 161.8 which translates to the middle of the 14th round in standard 12-team leagues. Karlsson has returned incredible value for managers who drafted him or grabbed him off the waiver wire early in the season. But the time has come to realize that Karlsson's production is about to decline; your window to trade him for a player of value is closing and you must act soon.
The Regression Meter
In deciding whether or not to trade a player on your fantasy hockey roster, you need to determine if the player's production is sustainable. There are a number of useful metrics to apply when making this decision and they can be found on numerous websites. The problem is, these metrics are never found in the same place. Our team fixed this problem more than a year ago by designing a new tool called the regression meter. On every NHL skater's player profile page at this website, a regression meter is published. These meters provide you with an "at a glance" view of a player's luck metrics so you can quickly determine if a player's performance has been boosted by luck. The meter reveals how a player's current performance compares to his career averages in five luck-influenced metrics: secondary assist rate (2A/60), team shooting percentage at even-strength (tEVSH%), individual shooting percentage (SH%), individual points percentage (IPP), and power play shooting percentage (PPSH%). If the meter is orange (above the midpoint representing his career average), the player has been lucky; if the meter is dark grey (below the midpoint), the player has been unlucky. It's that simple to use! Below is Karlsson's meter for the 2023-2024 season:
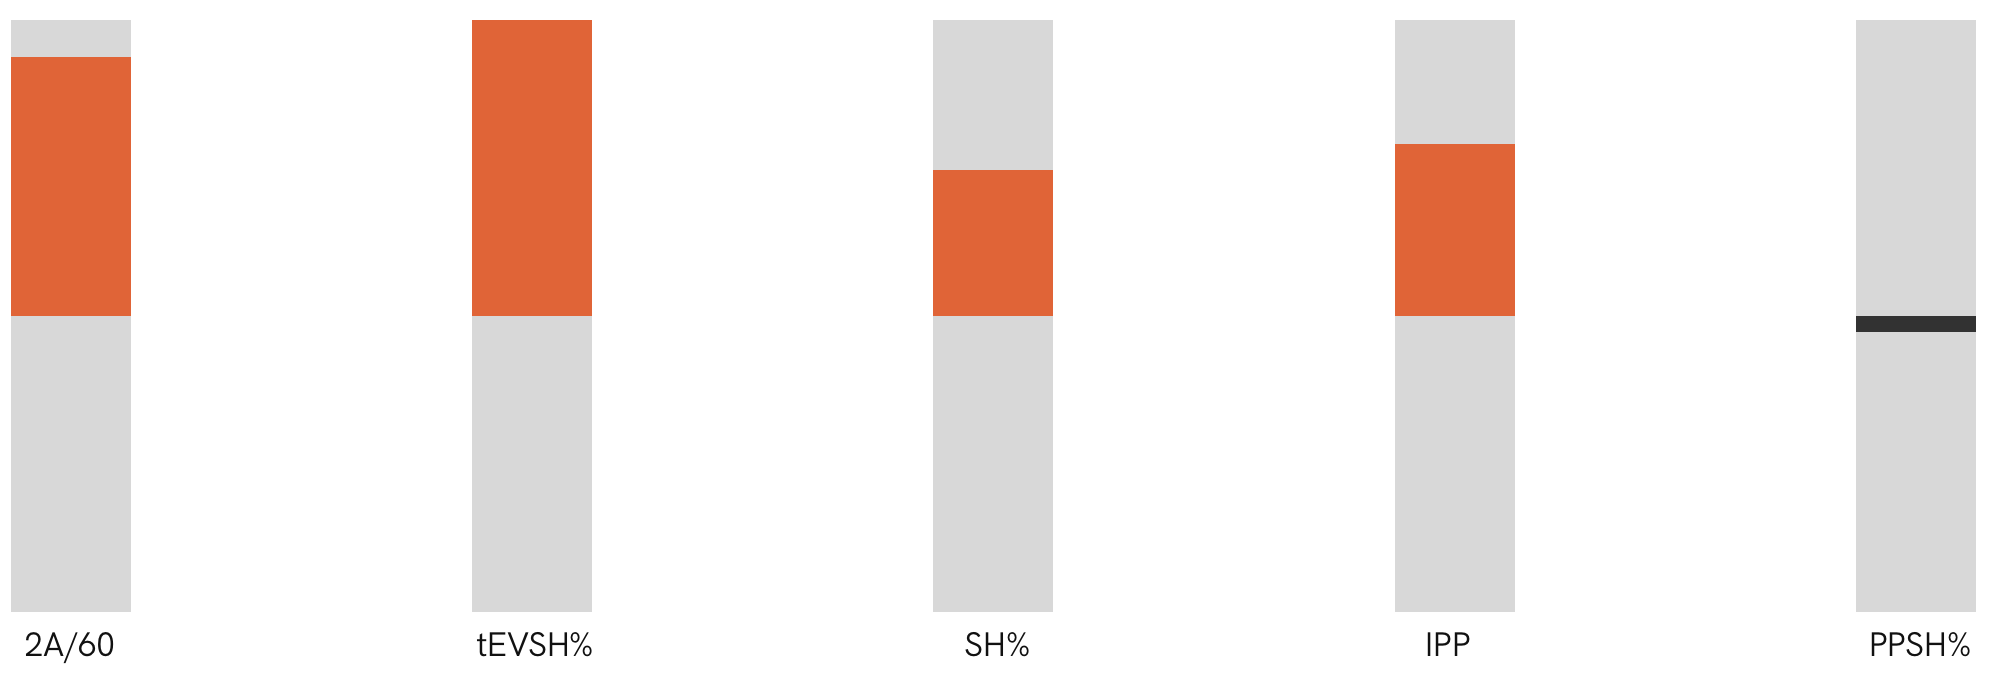
Figure 1 reveals that Karlsson's production has been boosted by luck. Notably, the tEVSH% suggests that Vegas is scoring goals at an abnormally high rate with Karlsson on the ice and the IPP value suggests that, on those inflated goals, Karlsson is being awarded points at an abnormally high rate. Typically, when both a player's tEVSH% and IPP are elevated, his secondary assist rate is elevated as well (and that is the case here for Karlsson). You might be surprised to learn that Karlsson's neutral PPSH% is one of the more interesting data points in the regression meter. Why would that be?
Digging Deeper
We know from the regression meter in Figure 1 that Karlsson's shooting percentage is significantly higher than usual. It sits at 20% for a player with a career average of 12.7%. But the regression meter also tells us that Karlsson's shooting percentage on the power play is normal (a thin grey bar suggests that it's just slightly below normal). If a player's SH% is high and his PPSH% is normal, than his EVSH% must be enormous. Such is the case for Karlsson who has converted 25% of his even-strength shots into goals. To put this value into the proper context, we've plotted Karlsson's EVSH% in each of his nine seasons as a percentage compared to his career average (see Figure 2).

Immediately, we find that Karlsson's EVSH% in the current season is more than double his career average of 11.5%. This is unsustainable and you should expect this number to drop precipitously. This inflated even-strength shooting percentage is responsible for at least four of Karlsson's nine goals so far this season. But that's not all; we still have to account for the elevated assist rate seen in the regression meter (Figure 1). The result of these luck adjustments is a player with five goals and seven assists (or, 12 points in 19 games played). This is the real William Karlsson that you're holding; you need to trade him while your opponents think he's the 20-point William Karlsson.
Potential Return Targets
It's not enough to know that you need to trade away a specific player due to a lucky start. You need specific return targets in mind that will give you future production that is greater than what you can expect from a luck-adjusted Karlsson. The trick here, of course, is to determine Karlsson's most likely point production when adjusted for luck. He's clearly not a point-per-game player; his inflated SH%, tEVSH%, and IPP virtually guarantee it. If you make adjustments for luck (email us for pointers on how to do this), you'll find that Karlsson's expected production through the first 19 games lands in the neighborhood of 12 points (or 0.63 points per game). As a sanity check, Karlsson's average point production in the three seasons leading up to 2023-2024 was 0.62 points per game; we seem to be on the right path with our calculations.
What type of player are we looking to get in return? First, it is imperative that you seek out a player with greater shot production than Karlsson's (2.37 shots per game). Shots lead to goals and assists (via rebounds); healthy shot production provides insulation against drops in shooting percentage (like the one Karlsson is about to experience). Outside of injury replacement, Karlsson plays on the second power play unit. He has four power play points to date, so we'll make sure our targets can match or exceed this value. Finally, and coincidentally, Karlsson's peripheral stats of Hits and Shot Blocks mimic his scoring rate (approximately 0.6 per game). If your league uses these categories, you'll want to keep that in mind while assembling your target list (you can use that data as tiebreakers or boosters to players who make the list). The list below is an abbreviated collection of players who meet the above requirements (some of these players are considerably more likely to be dealt than others).
Karlsson generates approximately eight face-off wins per game. If your league uses this category, and you can't take a loss here, consider omitting these players from the target list: Fiala, Keller, Verhaeghe, Caufield, Buchnevich, and Necas.
Trade Karlsson Today
Four of the five major luck metrics (displayed in his regression meter of Figure 1) reveal that William Karlsson is likely headed for significant regression. Adjusting for luck has led to the conclusion that Karlsson is very likely a 0.63 points-per-game player masquerading as a point-per-game player. Use this to your advantage and trade Karlsson today.
Special Offer
Want push notifications for starting goalies, player updates, line combinations, and a weekly schedule in the palm of your hand? Try our iPhone App for free for 30 days by clicking the image below:

Comments (0)
Leave a comment
In order to leave a comment, you must be a registered user at our website and logged in.