Players to Trade in the Coming Week
Introduction
On Saturday, the NHL reached (and passed) the halfway point of the 2023-2024 season. For most players, we now have 41 games of data -- a strong enough signal to determine whether or not their current production is sustainable. Now is the perfect time for this evaluation as the default trade deadline in Yahoo leagues is February 28 and the NHL's trade deadline lands just over a week later on March 8.
You might be thinking that having six (or more) weeks to manufacture trades is plenty of time; but, you would be wrong. The players that you're holding with unsustainable production will begin to crash long before those deadlines. If you don't get out in front of these crashes, you'll be left holding the bag on players headed for a significant scoring drought. This article highlights several of these players (in no particular order) and provides you with return targets (from the moonshots to the more reasonable) in potential trades. We strongly recommend that you act quickly to trade these players. All data used in this article was sourced from tools at Left Wing Lock and was accurate heading into games on January 15. Note: if you're in a points-style league (e.g., goals are assigned 3.0 fantasy points, assists are assigned 2.2 fantasy points, etc.), the unsustainability remarks in this article are pertinent but you'll need to consult your scoring details to find appropriate trade returns.
J.T. Miller - Vancouver Canucks
We've been sounding the alarm on J.T. Miller for several weeks here at Left Wing Lock. His current SH% sits at 20.7% (compared to a three-year average of 14.8%); his current shot production is just 2.1 shots per game. This combination of a high SH% and low shot volume can be especially volatile. When the luck runs out on the SH%, there aren't enough shots to mask the low SH%; this leads to a significant drop in goals. Miller has another downward pressure point on his production: the Canucks are scoring on 15.1% of their shots (at even strength) with him on the ice (his career value for this metric, labeled as tEVSH%, is 9.1%, while the league average typically sits around 8.8%). With the Canucks scoring at an abnormally high rate with Miller on the ice, there are more opportunities than expected for him to earn assists. As a result, we find that Miller's secondary assist rate is 72% higher than his career average.
Miller currently has 58 points in 43 games. If you were to adjust these totals for luck (given the parameters above), you'd find Miller's luck-adjusted production to fall below 40 points.
Potential targets: because Miller contributes to both the Hits and Face-off Wins categories, finding the right targets for a return will be highly league-specific. Let's ignore those categories (momentarily) to get a first approximation of Miller's true value. To start with, you need to limit your targets to players who take more than 2.1 shots per game (there is no sense in trading for a guy with fewer lottery tickets than Miller). Next, you'll want a player with luck-adjusted point production of at least one point per game. We choose this level because it is the bare minimum production necessary to match Miller's expected second-half production. Don't lose sight of the goal: you want a player who will outscore Miller in the second half of the season; you don't need a player to match Miller's production from the first half. With these numbers in place as our foundation, you can now sprinkle in other categories that are important to you in your league's scoring format. Below, we offer up a handful of potential trade targets based on these parameters:
| Player | GP | G | A | P | SOG/GP | PPP | HIT/60 | BS/60 | FOW/GP |
|---|---|---|---|---|---|---|---|---|---|
| Filip Forsberg | 43 | 22 | 26 | 48 | 3.86 | 16 | 5.12 | 1.41 | 0.2 |
| Sidney Crosby | 41 | 24 | 20 | 44 | 3.61 | 10 | 3.18 | 1.37 | 13.7 |
| Vincent Trocheck | 42 | 13 | 29 | 42 | 2.57 | 15 | 4.13 | 2.57 | 11.3 |
| Matthew Tkachuk | 42 | 12 | 29 | 41 | 3.74 | 15 | 3.68 | 1.12 | 0.1 |
Quinn Hughes - Vancouver Canucks
Not to be outmatched by Miller, Quinn Hughes is currently sitting on a tEVSH% of 15.2%. Of all players in the NHL with at least 30 games played so far this season, Hughes' tEVSH% value ranks third overall. You might not be shocked to learn that the top five values in the league are held by Vancouver Canucks. Four of these five Canucks (including Hughes) make up the top four values for tEVSH% in NHL history (for players with at least 30 games played in a single season). What you are witnessing with the Canucks is historic; and the fact that four Canucks are setting league-record values for tEVSH% should scare the shit out of you -- if you are rostering them on your fantasy team. Let's put Hughes' 15.2% in a broader context: only two players in the 15-year history of the NHL tracking the tEVSH% metric have been able to maintain a tEVSH% above 13.1% in a single season (with at least 70 games played). If your immediate reaction to this data is to think that a handful of Canucks will set NHL records for the tEVSH% metric, you're probabaly thinking about this in the wrong way. Instead, the most likely outcome here is that Hughes' (and many other Canucks') tEVSH% values will drop sharply in the second half of the season. Let's tackle the tEVSH% number from another angle. Let's assume that Hughes (and maybe other Canucks) post the third-highest tEVSH% in NHL history for a single season at 13.2%. By how much will the Canucks' even-strength scoring need to drop in the second half to hit this target? The answer is 26%. Say that to yourself aloud: even if Hughes posts the third-highest tEVSH% value in NHL history, the Canucks will score 26% fewer goals in the second half of the season than they did in the first half of the season (with Hughes on the ice).
Let's not get too hung up on the tEVSH% metric. Hughes is best examined by using the regression meter here at Left Wing Lock. This meter is available for every player on their individual player profile page (Hughes' is linked above). The regression meter allows for a quick, visual interpretation of the impact luck is having on a player's season. Orange bars above the midpoint indicate that a player is posting values above his career averages (he has been lucky); grey bars below the midpoint indicate that a player is posting values below his career averages (he has been unlucky). Figure 1 is Hughes' regression meter for the 2023-2024 season:

For each metric in the regression meter, a player's in-season value is compared to his career average. If the bar is maxed out in color (orange or grey), then the player's in-season value is three standard deviations away from the average (an indication that the event is unlikely or unsustainable). For Hughes, we find that his secondary assist rate (0.99), his tEVSH% (15.2%), and his SH% (10.7%) are all at or near three standard deviations from the average. His IPP (53%) is nearly two standard deviations from the average. Consider the following: events that are distributed two or more standard deviations from the average happen in just 5% of instances (or, for a long NHL career, they happen once in a career). To believe that Hughes' production is sustainable, you have to believe that he's hitting once-in-a-career levels in secondary assists, tEVSH%, and SH% simultaneously!
Hughes' PPSH% is just a bit above normal. You would think that this is ok; it's the only luck metric that is near his career average. But, the combination of a very high SH% with a normal PPSH% should alert you to a bigger problem. If Hughes' SH% is high, but his PPSH% is normal, than his shooting percentage at even strength (EVSH%) must be enormous. In fact, Hughes' EVSH% is 12.7% -- a full 80% higher than his career average. Be sure to put that number into proper context: Hughes is scoring at a higher rate at even-strength than many forwards do even when you include their power play rates. It is highly unlikely to continue.
Hughes currently has 51 points in 43 games. If you were to adjust these totals for luck (given the parameters above), you'd find Hughes' luck-adjusted production to fall below 40 points.
Potential targets: Hughes' contributions in fantasy hockey are largely due to scoring. This fact makes coming up with trade targets much easier. Presumably, you would want a defenseman in return and the non-scoring stats (hits, blocked shots) warrant little consideration. A key trading rule here at Left Wing Lock is to never trade down in shots -- especially when you're using regression as the basis for the trade. Hughes is generating 2.4 shots per game, his luck-adjusted point production is under a point-per-game (~0.85), and he's on the top power play unit for Vancouver. All potential trade targets need to meet these minimum requirements (after being adjusted for luck). There is only one such target in the NHL:
| Player | GP | G | A | P | SOG/GP | PPP | HIT | BS | FOW |
|---|---|---|---|---|---|---|---|---|---|
| Cale Makar | 38 | 9 | 39 | 48 | 3.00 | 22 | 1.14 | 4.38 | 0.0 |
Brock Boeser - Vancouver Canucks
Our team at Left Wing Lock is famous for stating "there is no such thing as a 20% shooter." Occasionally, social media reply guys will point to a player (usually with lower shot volume) that exceeds the 20% mark during a single season. This does happen from time to time; there are 10 or so instances over the last 20 years (for players who take at least two shots per game). But getting into the weeds misses the beauty of our quote. Check the composite shooting percentages of every NHL player who has taken at least 200 shots over the past 30 years and you won't find a single player with a 20% shooting percentage. The idea behind this maxim is to get you to see shooting percentages above 20% as red flags in fantasy hockey.
Brock Boeser has scored 27 goals in 43 games and his shot production (2.70 shots per game) is in line with his career average (2.75 shots per game). He is currently shooting with 23.3% success on 116 shots. The problem here is that Boeser's career shooting percentage (the best measure of his shooting talent) is 13.7% (using his three-year average of 12.5% makes the comparison look even more lopsided). At even strength, Boeser is shooting at twice his career average. The most likely scenario going forward is that Boeser's shooting percentage drops, leading to fewer goals in the second half. But Boeser's production is boosted not only by a lucky SH%, but a lucky tEVSH% as well. The Canucks are converting 14.5% of their shots into goals at even strength with Boeser on the ice. As such, Boeser's primary assist rate is inflated due to the abnormally high number of opportunities to earn a point on a Vancouver goal.
Boeser currently has 46 points in 43 games. If you were to adjust these totals for luck (given the parameters above), you'd find Boser's luck-adjusted production to fall below 40 points.
Potential targets: because Boeser's fantasy production is limited to shooting and scoring, it is a straightforward exercise to find return targets in a trade. Boeser does not hit; he does not block shots; he does not take face-offs, and he doesn't take penalties. We simply need to find a list of players who take at least 2.7 shots per game and will score a luck-adjusted total of at least 30 points in the second half of the season. Below, you'll find an abbreviated list of players who meet these constraints:
| Player | GP | G | A | P | SOG/GP | PPP | HIT | BS | FOW |
|---|---|---|---|---|---|---|---|---|---|
| Sidney Crosby | 41 | 24 | 20 | 44 | 3.61 | 10 | 3.18 | 1.37 | 13.7 |
| Jason Robertson | 42 | 15 | 28 | 43 | 2.93 | 15 | 2.19 | 1.33 | 0.0 |
| Steven Stamkos | 41 | 18 | 23 | 41 | 3.07 | 24 | 2.19 | 1.17 | 4.0 |
| Bo Horvat | 41 | 17 | 23 | 40 | 2.95 | 12 | 2.35 | 1.82 | 8.9 |
| Matthew Tkachuk | 42 | 12 | 29 | 41 | 3.74 | 15 | 3.68 | 1.12 | 0.1 |
| Kevin Fiala | 39 | 10 | 27 | 37 | 2.77 | 15 | 1.58 | 1.49 | 0.2 |
| Brad Marchand | 42 | 19 | 20 | 39 | 2.74 | 20 | 2.77 | 1.46 | 0.4 |
| Alex DeBrincat | 43 | 17 | 23 | 40 | 3.00 | 13 | 1.45 | 1.52 | 0.3 |
| Chris Kreider | 42 | 20 | 17 | 37 | 2.88 | 13 | 2.67 | 0.84 | 0.4 |
| John Tavares | 41 | 12 | 22 | 34 | 3.56 | 10 | 3.68 | 1.76 | 10.6 |
Elias Pettersson - Vancouver Canucks
If you trust our team regarding this Vancouver Canucks data, then it's not a stretch to see that a guy who spends quite a bit of time on the ice with both Miller and Boeser will also be at risk for second-half regression. For a better part of the most recent 10 games, Elias Pettersson has lined up alongside Miller and Boeser at even strength. That line, as a whole, has converted 27% of their shots into goals at even strength. They lead all line combos in the NHL (minimum 70 shot attempts) in shooting percentage by an enormous margin. The next closest line shoots with 17.9% success. As a result, Pettersson's tEVSH% currently sits at 15.7% -- the highest value in NHL history for a player who has appeared in at least 43 games in a single season. Much like the argument we made for Hughes above, even if Pettersson finishes the season with one of the best tEVSH% in NHL history, the Canucks are likely to score 32% fewer goals at even strength in the second half of the season (with Pettersson on the ice). Ask yourself what this means for Pettersson's assist rate in the second half of the season. Note: Pettersson's current primary assist rate is on pace to be the second-highest value in NHL history.
Pettersson currently has 57 points in 43 games. If you were to adjust these totals for luck (given the parameters above), you'd find Pettersson's luck-adjusted production to fall below 40 points.
Potential targets: Pettersson's fantasy value is dominated by his point production. Other considerations include approximately one hit and one blocked shot per game. Pettersson's shot rate currently sits at 2.8 shots per game. Potential targets in a trade include:
| Player | GP | G | A | P | SOG/GP | PPP | HIT | BS | FOW |
|---|---|---|---|---|---|---|---|---|---|
| Filip Forsberg | 43 | 22 | 26 | 48 | 3.86 | 16 | 5.12 | 1.41 | 0.2 |
| Sidney Crosby | 41 | 24 | 20 | 44 | 3.61 | 10 | 3.18 | 1.37 | 13.7 |
| Matthew Tkachuk | 42 | 12 | 29 | 41 | 3.74 | 15 | 3.68 | 1.12 | 0.1 |
Thatcher Demko - Vancouver Canucks
When a handful of players from the same team are producing at abnormally-high rates, the natural result is that your team will win a greater percentage of their games. But what happens when that production goes into decline? With signficantly fewer goals forecasted in the second half of the season for Vancouver than in the first half of the season, the most likely outcome is that the team's winning percentage will drop. This will trickle down to the individual goalies and that makes now a reasonable time to consider trading Thatcher Demko.
Demko's individual statistics are reasonable across the board. His EVSV% of 0.922 is nearly identical to his three-year average of 0.924. His PKSV% is above the league average at 0.890 -- but penalty kill data is always made up of small sample sizes, so it's not wise to expect in-season changes unless the value is extreme. Thus, the argument for trading Demko has nothing to do with Demko. Instead, the expectation is that Vancouver will be a weaker team in the second half and Demko will win fewer games in the second half. There is, perhaps, no greater visual display of Vancouver's luck this season than what is seen in the Possession and Luck chart below:
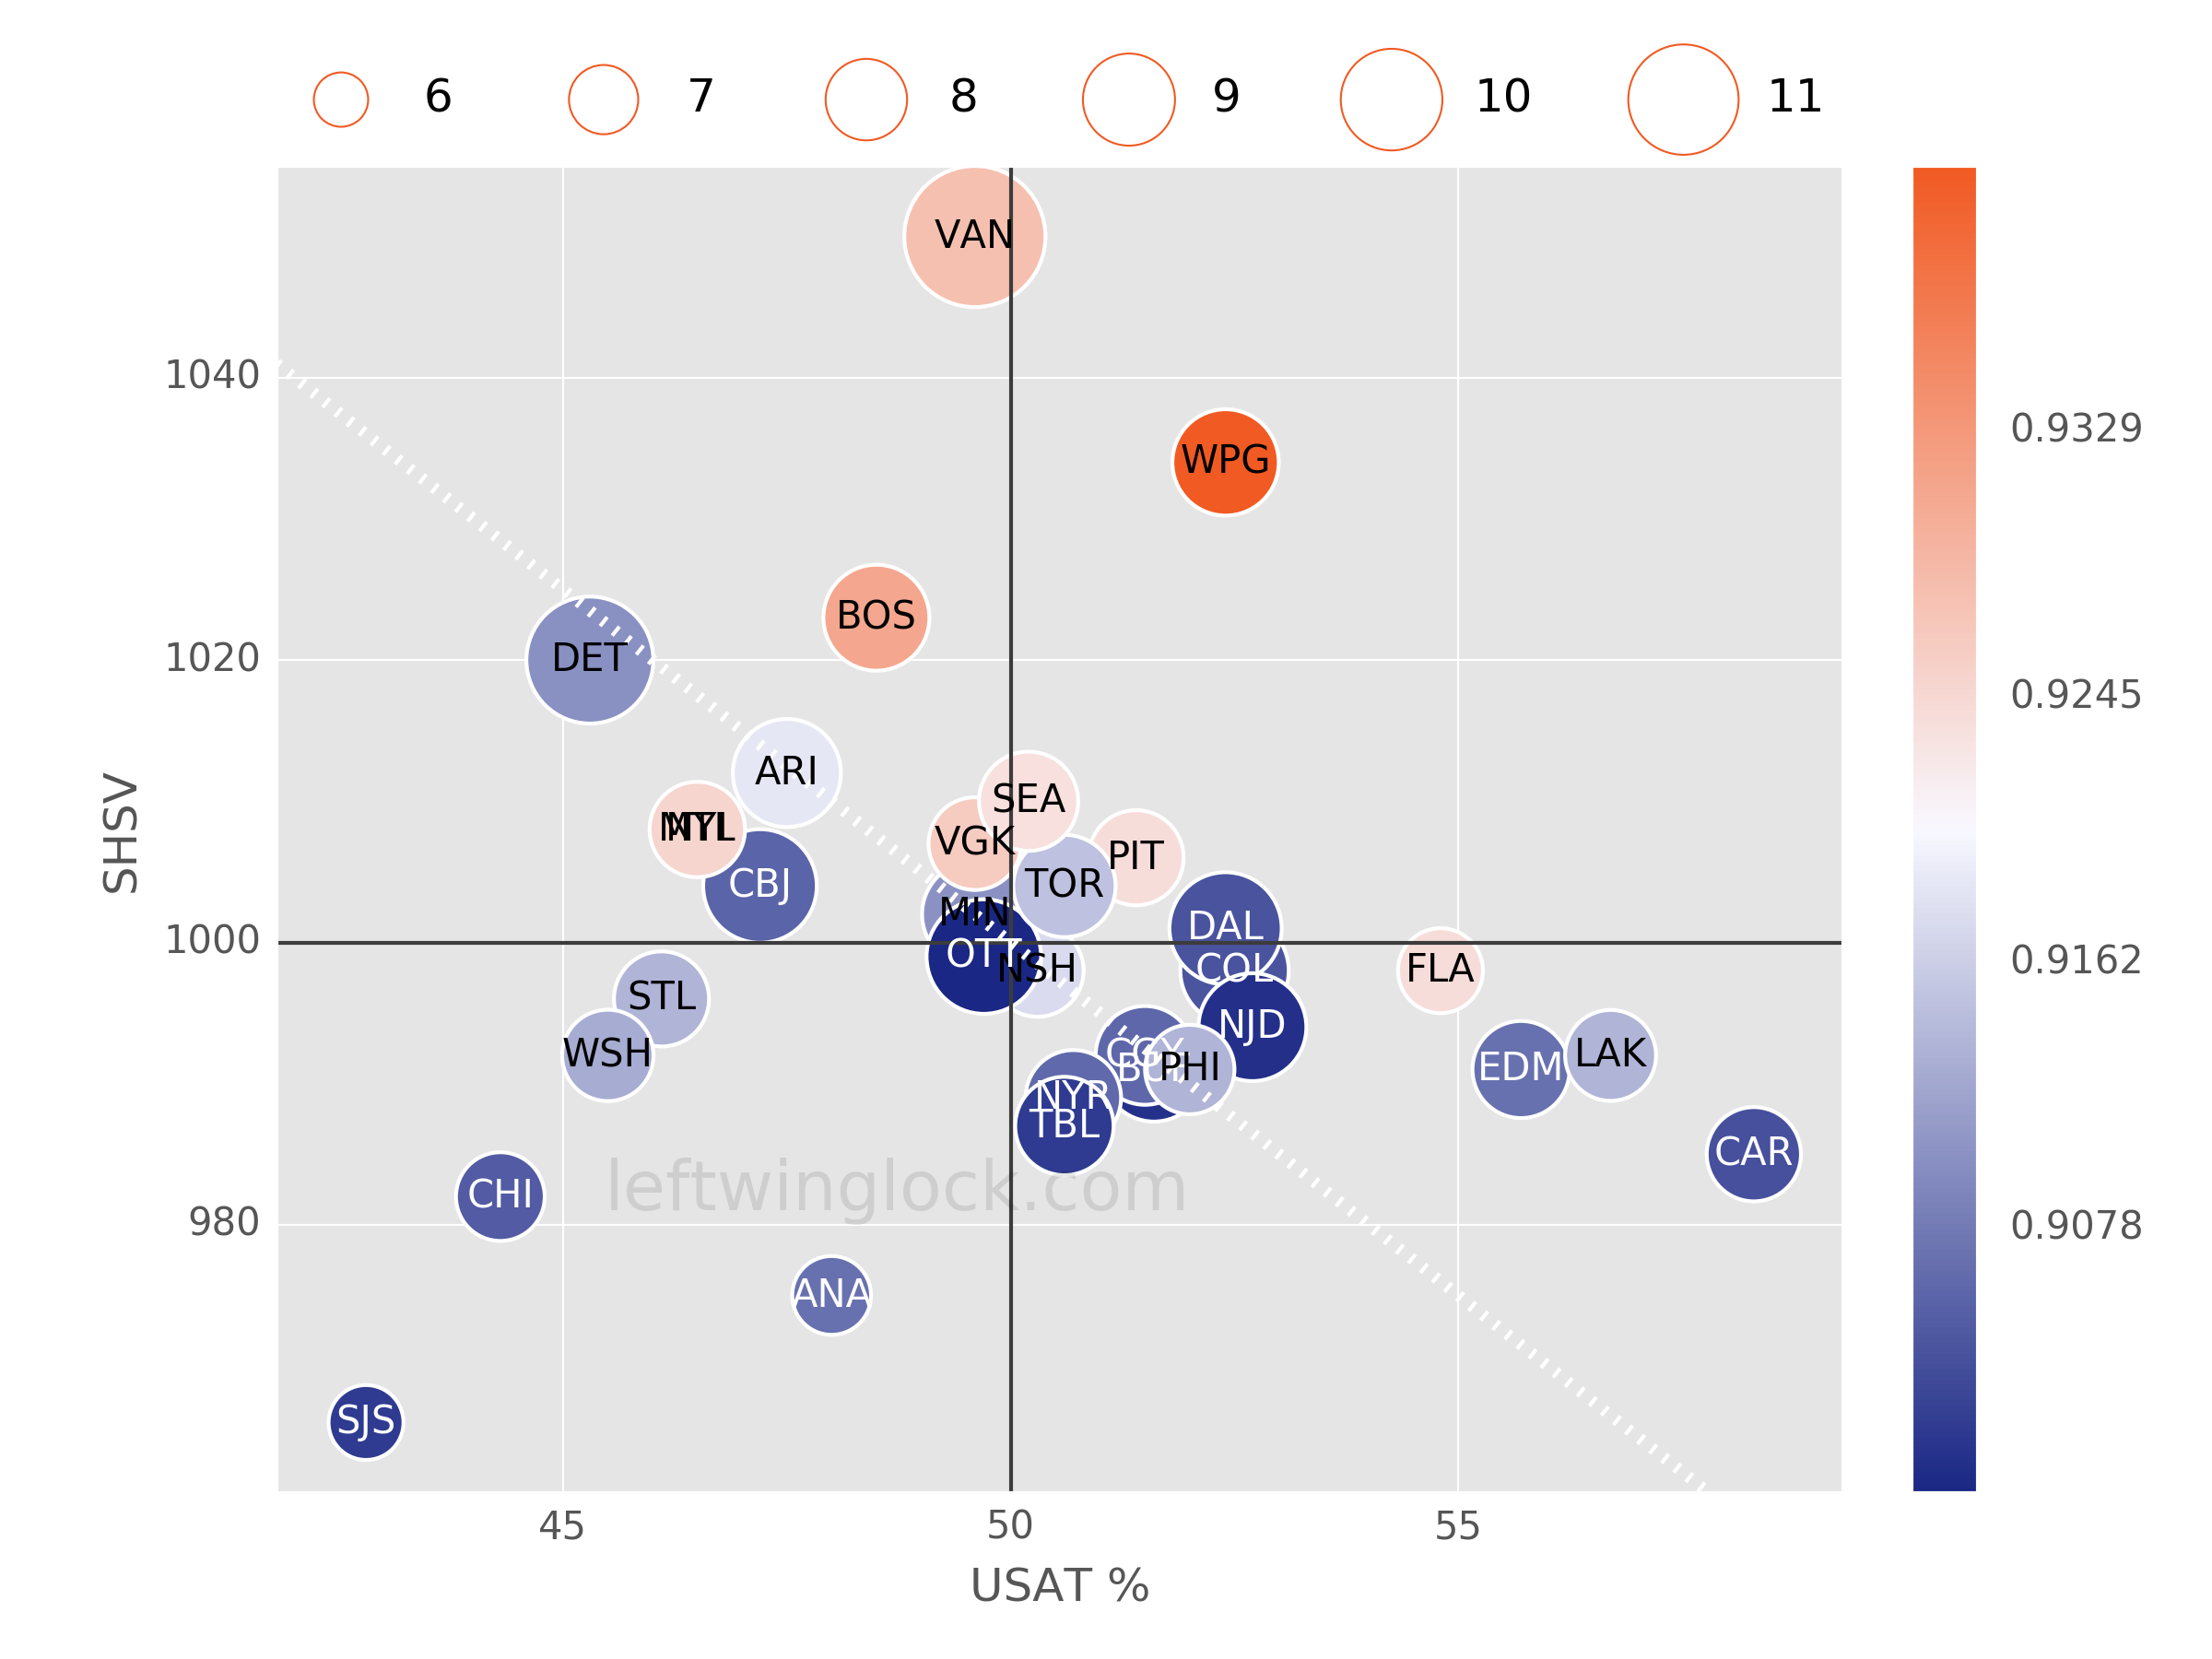
The size of that Vancouver bubble shows that they are shooting with 12.3% success at even strength. No team in the 15-year period that the NHL has tracked this data has ever finished a season with an even-strength shooting percentage greater than 10.4%. Even if the Canucks set the new record (not something you should count on), their even-strength scoring will drop by at least 15% in the second half of the season. Completing a goalie-for-goalie trade is difficult. You would need to target a goalie with a history of strong work at even strength on a team that is a lock for the playoffs. You'll also want to be sure to check that goalie's PKSV% to make sure his overall numbers aren't being propped up by luck. Names that come to mind here include: Connor Hellebuyck (WPG), Ilya Sorokin (NYI), Linus Ullmark (BOS), Jeremy Swayman (BOS), and Stuart Skinner (EDM).
Sam Reinhart - Florida Panthers
As we were preparing to write this article, Florida's Sam Reinhart refused to stop scoring. In his last 10 games, Reinhart produced 13 goals, giving him 31 goals on the season. He would likely rank near the top on "most bang for your buck" lists as his average draft position was 99.9 (an early 9th round pick). In the Left Wing Lock draft kit, we had Reinhart ranked 50th overall -- making him a draft day steal. If you drafted Reinhart using our draft kit, you landed the NHL's #2 goal scorer using a pick between the 5th and 9th rounds. But Reinhart's value has run its course and we believe now is the perfect time to trade him. The single greatest strike against Reinhart going forward is that he's converted 27.4% of his shots into goals in the first half of the season. Reinhart's career SH% is 15.1% and his three-year average SH% is 16.4%. Reinhart is on pace to take 221 shots this season. Looking at all players over the past 30 years who took at least 221 shots in a single season, the highest SH% on record is 21.7% (a tie between Brayden Point in 2022-2023 and Leon Draisaitl in 2018-2019). Following earlier lines of thought, let's assume that Reinhart finishes the season right at the league record SH% for players with at least 221 shots. To hit this mark, Reinhart would need to shoot with 15.7% success the rest of the way. How many goals would Reinhart score in the second half of the season with that shooting percentage? 17.
Reinhart currently has 54 points in 42 games. If you were to adjust these totals for luck (given the parameters above), you'd find Reinhart's luck-adjusted production to fall below 40 points.
Potential targets: outside of point production, there are not many considerations to worry about in a fantasy trade involving Reinhart. He's good for about three face-off wins per game if your league uses that category. Otherwise, you need to focus your search on players who take at least 2.7 shots per game and are capable of generating at least point-per-game pace (on a luck-adjusted basis) in the second half of the season. Some players who meet these requirements include:
| Player | GP | G | A | P | SOG/GP | PPP | HIT | BS | FOW |
|---|---|---|---|---|---|---|---|---|---|
| Mikko Rantanen | 43 | 22 | 33 | 55 | 3.49 | 27 | 1.56 | 1.56 | 3.3 |
| Jesper Bratt | 40 | 16 | 30 | 46 | 3.03 | 20 | 2.12 | 1.02 | 0.1 |
| Filip Forsberg | 43 | 22 | 26 | 48 | 3.86 | 16 | 5.12 | 1.41 | 0.2 |
| Jake Guentzel | 41 | 19 | 27 | 46 | 3.78 | 10 | 1.88 | 1.11 | 0.1 |
| Sidney Crosby | 41 | 24 | 20 | 44 | 3.61 | 10 | 3.18 | 1.37 | 13.7 |
| Jason Robertson | 42 | 15 | 28 | 43 | 2.93 | 15 | 2.19 | 1.33 | 0.0 |
| Steven Stamkos | 41 | 18 | 23 | 41 | 3.07 | 24 | 2.19 | 1.17 | 4.0 |
| Matthew Tkachuk | 42 | 12 | 29 | 41 | 3.74 | 15 | 3.68 | 1.12 | 0.1 |
| Bo Horvat | 41 | 17 | 23 | 40 | 2.95 | 12 | 2.35 | 1.82 | 8.9 |
| Brad Marchand | 42 | 19 | 20 | 39 | 2.74 | 20 | 2.77 | 1.46 | 0.4 |
Blake Coleman - Calgary Flames
Blake Coleman may be a surprising name to see on this list but he's currently rostered in 74% of Yahoo leagues despite having an ownership percentage of approximately 0% on opening night. For a free-agent pickup, you have done quite well with Coleman's 37 points in 43 games. He currently sits just outside of the Top-50 in point production and is rubbing elbows with guys like Kevin Fiala, Evgeni Malkin, and Dylan Larkin. To better understand Coleman's first-half performance, take a look at his regression meter (details for which are explained earlier in the Quinn Hughes section):

Coleman's luck metrics of secondary assists, SH%, and IPP are pegged at or above the three standard deviation indicator. To have three metrics simultaneously this far from his career averages screams out future regression. One other factor to consider (which may not be specifically relevant to your fantasy scoring, but it's relevant to Coleman's point production): Coleman is on pace to break the NHL record for shorthanded points in a single season. This last result seems unlikely as well and we factor it into our analysis below.
Coleman currently has 37 points in 43 games. If you were to adjust these totals for luck (given the parameters above), you'd find Coleman's luck-adjusted production to fall to land between 21-27 points (depending on how repeatable you think Coleman's shorthanded production will be in the second half of the season).
Potential targets: Coleman is shooting the puck at a rate of 2.4 shots per game and you don't want to ignore his hit production (1.2 per game) since this is very likely one of the reasons he's on your roster at the moment. Coleman's true point production will be easy to match; we anticipate your trade target will need to generate just 0.56 points per game (22 points in total) in the second half of the season. This seems like a situation where it's best to move Coleman in a 2-for-1 package as there are no reasonable names that show up in our trade machine matching these parameters.
Fantasy Hockey Dashboard
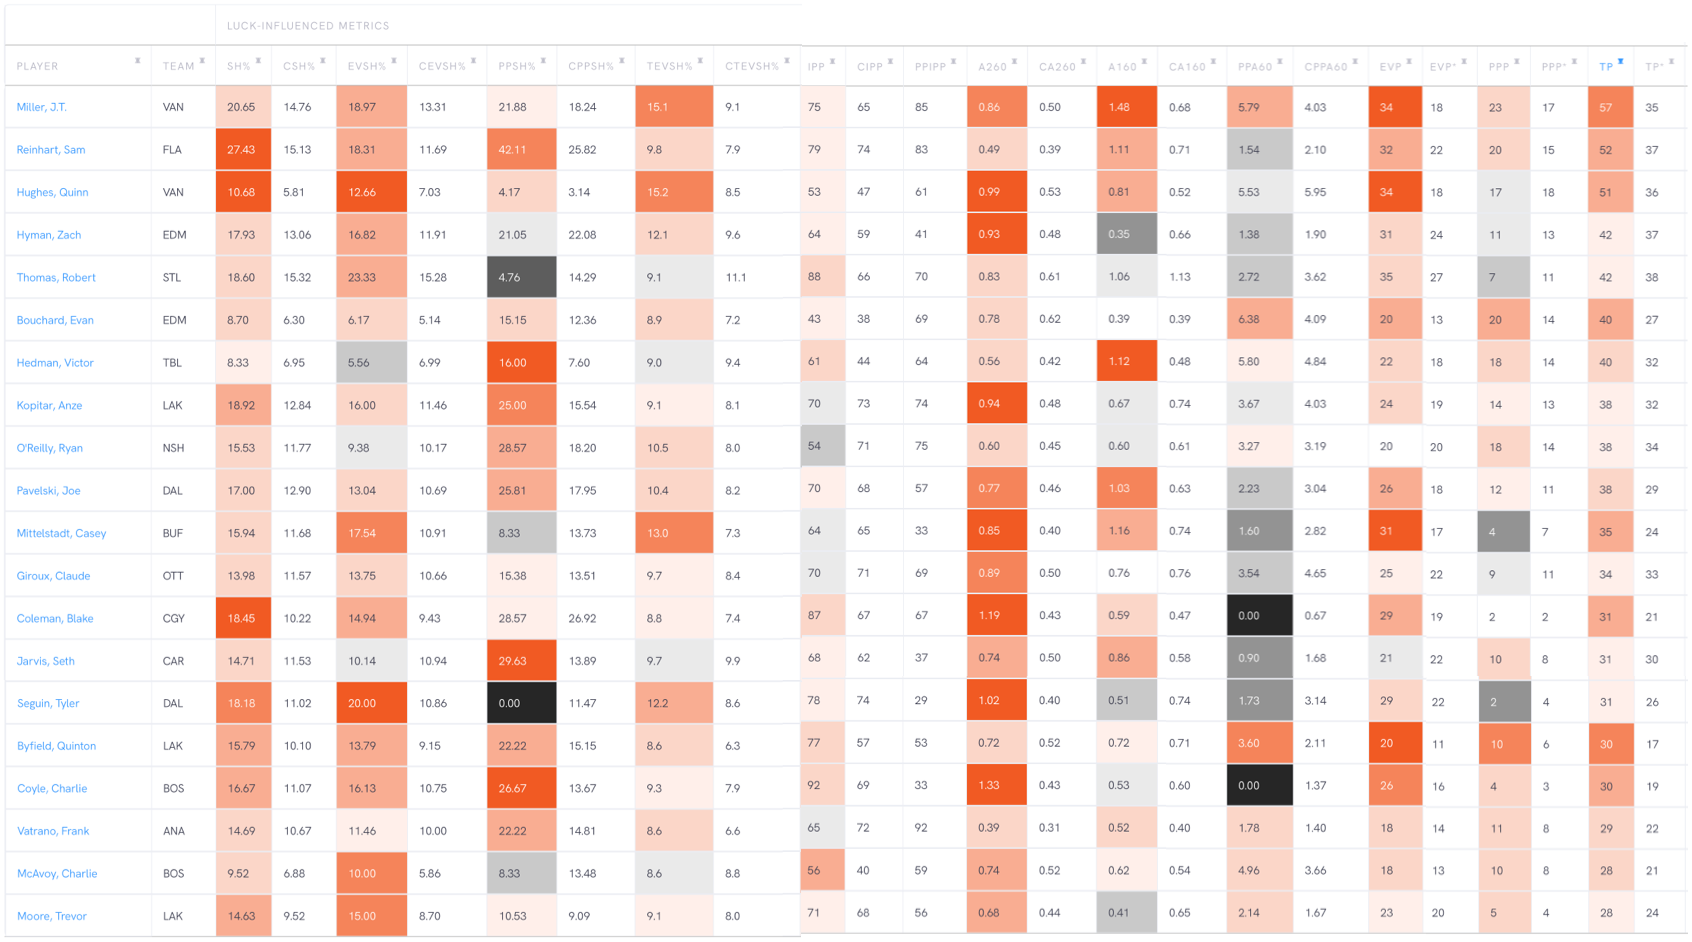
Wondering how to find players with unsustainable production? The pros at Left Wing Lock use the one-of-a-kind tool known as the Fantasy Hockey Dashboard. You can identify players on your roster (or your opponents' rosters) who are most likely to see increases or decreases in point production in the future. This unique tool uses a heatmap approach so that you can instantly identify which players you should consider trading (or targeting in a trade). Some of the features of this tool are displayed below:
Comments (2)
Leave a comment
In order to leave a comment, you must be a registered user at our website and logged in.
Love the trade partners to pair with this post. Nice work!
I took some time to evaluate all of our trade suggestions from this January 15 article. I rated each trade target as a Win, Loss, or Draw depending on the second-half statistics. I learned a couple of lessons along the way. Link: Evaluating Mid-season Trade Suggestions