BRAYDEN SCHENN
Explore projections, stats, news, player usage charts, and line combinations for members of the St. Louis Blues
-
Center Leaders
2023 - 2024
Name G A Pts Nathan
MacKinnon51 89 140 Connor McDavid 32 100 132 Auston Matthews 69 38 107 Leon Draisaitl 41 65 106 J.T. Miller 37 66 103 Sam Reinhart 57 37 94 Sidney Crosby 42 52 94 Brayden Point 46 44 90 Sebastian Aho 36 53 89 Elias Pettersson 34 55 89 Robert Thomas 26 60 86 Steven Stamkos 40 41 81 -
Player Card

BRAYDEN SCHENN
St. Louis Blues2023 - 2024- G 20
- A 26
- PTS 46
- +/- -22
- PIM 56
- PPP 12
- SH% 11.8
- L 10%
- C 83%
- R 7%
-
St. Louis Blues Leaders
2023 - 2024
Name PPG PPA PPP Robert
Thomas8 19 27 Jordan Kyrou 8 13 21 Pavel Buchnevich 8 10 18 Jake Neighbours 8 6 14 Torey Krug 0 13 13 Brayden Schenn 4 8 12 Justin Faulk 1 6 7 Scott Perunovich 0 6 6 Brandon Saad 5 0 5 Oskar Sundqvist 3 2 5 Kevin Hayes 0 5 5 Colton Parayko 0 1 1
News
-
Brayden Schenn
Is taking a maintenance day.
Mar 1, 2024 - 12:51 pm -
Brayden Schenn
Is not on the ice for practice.
Mar 1, 2024 - 11:43 am -
Brayden Schenn
Is expected to be in the lineup for today's game.
Dec 3, 2022 - 12:28 pm -
Brayden Schenn
Is questionable for Saturday's game. He did not practice today due to a lingering, lower-body issue.
Dec 2, 2022 - 1:19 pm
Feature
-
Trending
Buy-Low and Sell-High: Skaters
Replies 0
Basic Stats
| Season | Team | GP | G | A | P | +/- | PIM | S | S/GP | SH% | PPP | H | BS | FW | FO% | TOI | EVTOI | PPTOI | PKTOI |
|---|---|---|---|---|---|---|---|---|---|---|---|---|---|---|---|---|---|---|---|
| 23-24 | STL | 82 | 20 | 26 | 46 | -22 | 56 | 170 | 2.1 | 11.8 | 12 | 169 | 51 | 454 | 49.3 | 17.78 | 14.38 | 2.53 | 0.86 |
| 22-23 | STL | 82 | 21 | 44 | 65 | -27 | 50 | 144 | 1.8 | 14.6 | 15 | 140 | 41 | 472 | 46.6 | 18.43 | 15.11 | 2.59 | 0.73 |
| 21-22 | STL | 62 | 24 | 34 | 58 | 21 | 33 | 111 | 1.8 | 21.6 | 17 | 119 | 17 | 284 | 49.1 | 17.78 | 14.90 | 2.40 | 0.49 |
| 20-21 | STL | 56 | 16 | 20 | 36 | -2 | 35 | 113 | 2 | 14.2 | 9 | 119 | 35 | 319 | 52.4 | 19.14 | 16.01 | 2.49 | 0.65 |
| 19-20 | STL | 71 | 25 | 33 | 58 | 3 | 44 | 138 | 1.9 | 18.1 | 21 | 119 | 21 | 350 | 49.0 | 18.46 | 15.38 | 2.85 | 0.23 |
Enhanced Stats (5-on-5 unless denoted with *)
| Season | G/60 | A/60 | P/60 | IPP | ΔPEN/60 | 1A | 2A | EVS/60* | PPS/60* | SATF | SAT% | tEVSH% | tEVSV% | SHSV | ZS% |
|---|---|---|---|---|---|---|---|---|---|---|---|---|---|---|---|
| 23-24 | 0.61 | 0.89 | 1.51 | 63 | -0.12 | 10 | 6 | 5.5 | 14.4 | 953 | 45.0 | 9.4 | 0.907 | 1001 | 43.9 |
| 22-23 | 0.62 | 1.50 | 2.13 | 83 | 0.00 | 16 | 13 | 5.2 | 9.0 | 979 | 45.0 | 9.5 | 0.911 | 1006 | 48.3 |
| 21-22 | 0.90 | 1.25 | 2.14 | 63 | -0.05 | 13 | 5 | 4.8 | 11.3 | 674 | 43.9 | 12.7 | 0.925 | 1052 | 47.0 |
| 20-21 | 0.58 | 0.95 | 1.53 | 63 | -0.22 | 10 | 3 | 5.0 | 12.5 | 665 | 45.9 | 9.0 | 0.910 | 1000 | 49.6 |
| 19-20 | 0.89 | 1.07 | 1.95 | 70 | -0.32 | 12 | 6 | 5.2 | 11.8 | 852 | 50.2 | 8.4 | 0.933 | 1017 | 54.8 |
Regression Meter
This meter measures whether or not a player's point production is being influenced by luck. Orange indicates the player has been lucky. Dark grey indicates the player has been unlucky.
2A/60
tEVSH%
SH%
IPP
PPSH%
Positional Data
| Season | Team | Left | Center | Right |
|---|---|---|---|---|
| 23-24 | STL | 10 | 83 | 7 |
| 22-23 | STL | 18 | 79 | 4 |
| 21-22 | STL | 23 | 74 | 3 |
| 20-21 | STL | 19 | 77 | 4 |
| 19-20 | STL | 1 | 86 | 13 |
Most Common Linemates and Line Production
See also: St. Louis Blues Line Combo Tool | Line Production Tool
| Team | F1 | F2 | F3 | GF | GA | GF% | SATF | SATA | SAT% | USATF | USATA | USAT% | SH% | SV% | SHSV | ZS% |
|---|---|---|---|---|---|---|---|---|---|---|---|---|---|---|---|---|
| STL | NEIGHBOURS | SCHENN | SAAD | 6 | 10 | 37.5 | 165 | 222 | 42.6 | 117 | 151 | 43.7 | 7.2 | 0.906 | 978 | 52.1 |
| STL | SAAD | SCHENN | KYROU | 11 | 7 | 61.1 | 129 | 146 | 46.9 | 99 | 95 | 51.0 | 14.3 | 0.899 | 1041 | 68.4 |
| STL | NEIGHBOURS | SCHENN | KAPANEN | 7 | 2 | 77.8 | 94 | 148 | 38.8 | 71 | 102 | 41.0 | 14.9 | 0.969 | 1118 | 31.4 |
Most Recent 10 Games
| OPP | G | A | P | +/- | PIM | SOG | SH% | H | BS | FW | FL | FO% | TOI | EVTOI | PPTOI | PKTOI | ID |
|---|---|---|---|---|---|---|---|---|---|---|---|---|---|---|---|---|---|
| DAL | 0 | 1 | 1 | 1 | 0 | 1 | 0 | 1 | 1 | 1 | 3 | 25 | 20:05 | 16:13 | 01:19 | 02:33 | 21305 |
| SEA | 1 | 0 | 1 | 1 | 2 | 4 | 25 | 0 | 0 | 1 | 0 | 100 | 19:44 | 16:36 | 01:35 | 01:33 | 21283 |
| CAR | 0 | 0 | 0 | -2 | 2 | 2 | 0 | 0 | 0 | 8 | 3 | 73 | 19:51 | 16:08 | 02:08 | 01:35 | 21265 |
| CHI | 0 | 2 | 2 | 1 | 0 | 4 | 0 | 0 | 1 | 3 | 1 | 75 | 14:13 | 12:05 | 02:05 | 00:03 | 21252 |
| ANA | 1 | 1 | 2 | 1 | 0 | 3 | 33.3 | 0 | 1 | 2 | 0 | 100 | 20:03 | 16:02 | 02:34 | 01:27 | 21235 |
| SJS | 1 | 0 | 1 | 0 | 0 | 4 | 25 | 1 | 0 | 6 | 8 | 43 | 24:33 | 13:58 | 06:46 | 03:49 | 21221 |
| NSH | 0 | 0 | 0 | -2 | 0 | 5 | 0 | 4 | 1 | 5 | 6 | 45 | 19:27 | 14:47 | 03:30 | 01:10 | 21208 |
| EDM | 2 | 0 | 2 | 1 | 0 | 2 | 100 | 3 | 0 | 8 | 2 | 80 | 18:04 | 13:24 | 03:17 | 01:23 | 21186 |
| SJS | 0 | 0 | 0 | -1 | 0 | 2 | 0 | 1 | 0 | 7 | 4 | 64 | 15:24 | 13:28 | 00:29 | 01:27 | 21177 |
| CGY | 0 | 1 | 1 | 1 | 2 | 3 | 0 | 2 | 2 | 7 | 5 | 58 | 16:27 | 12:58 | 02:24 | 01:05 | 21157 |
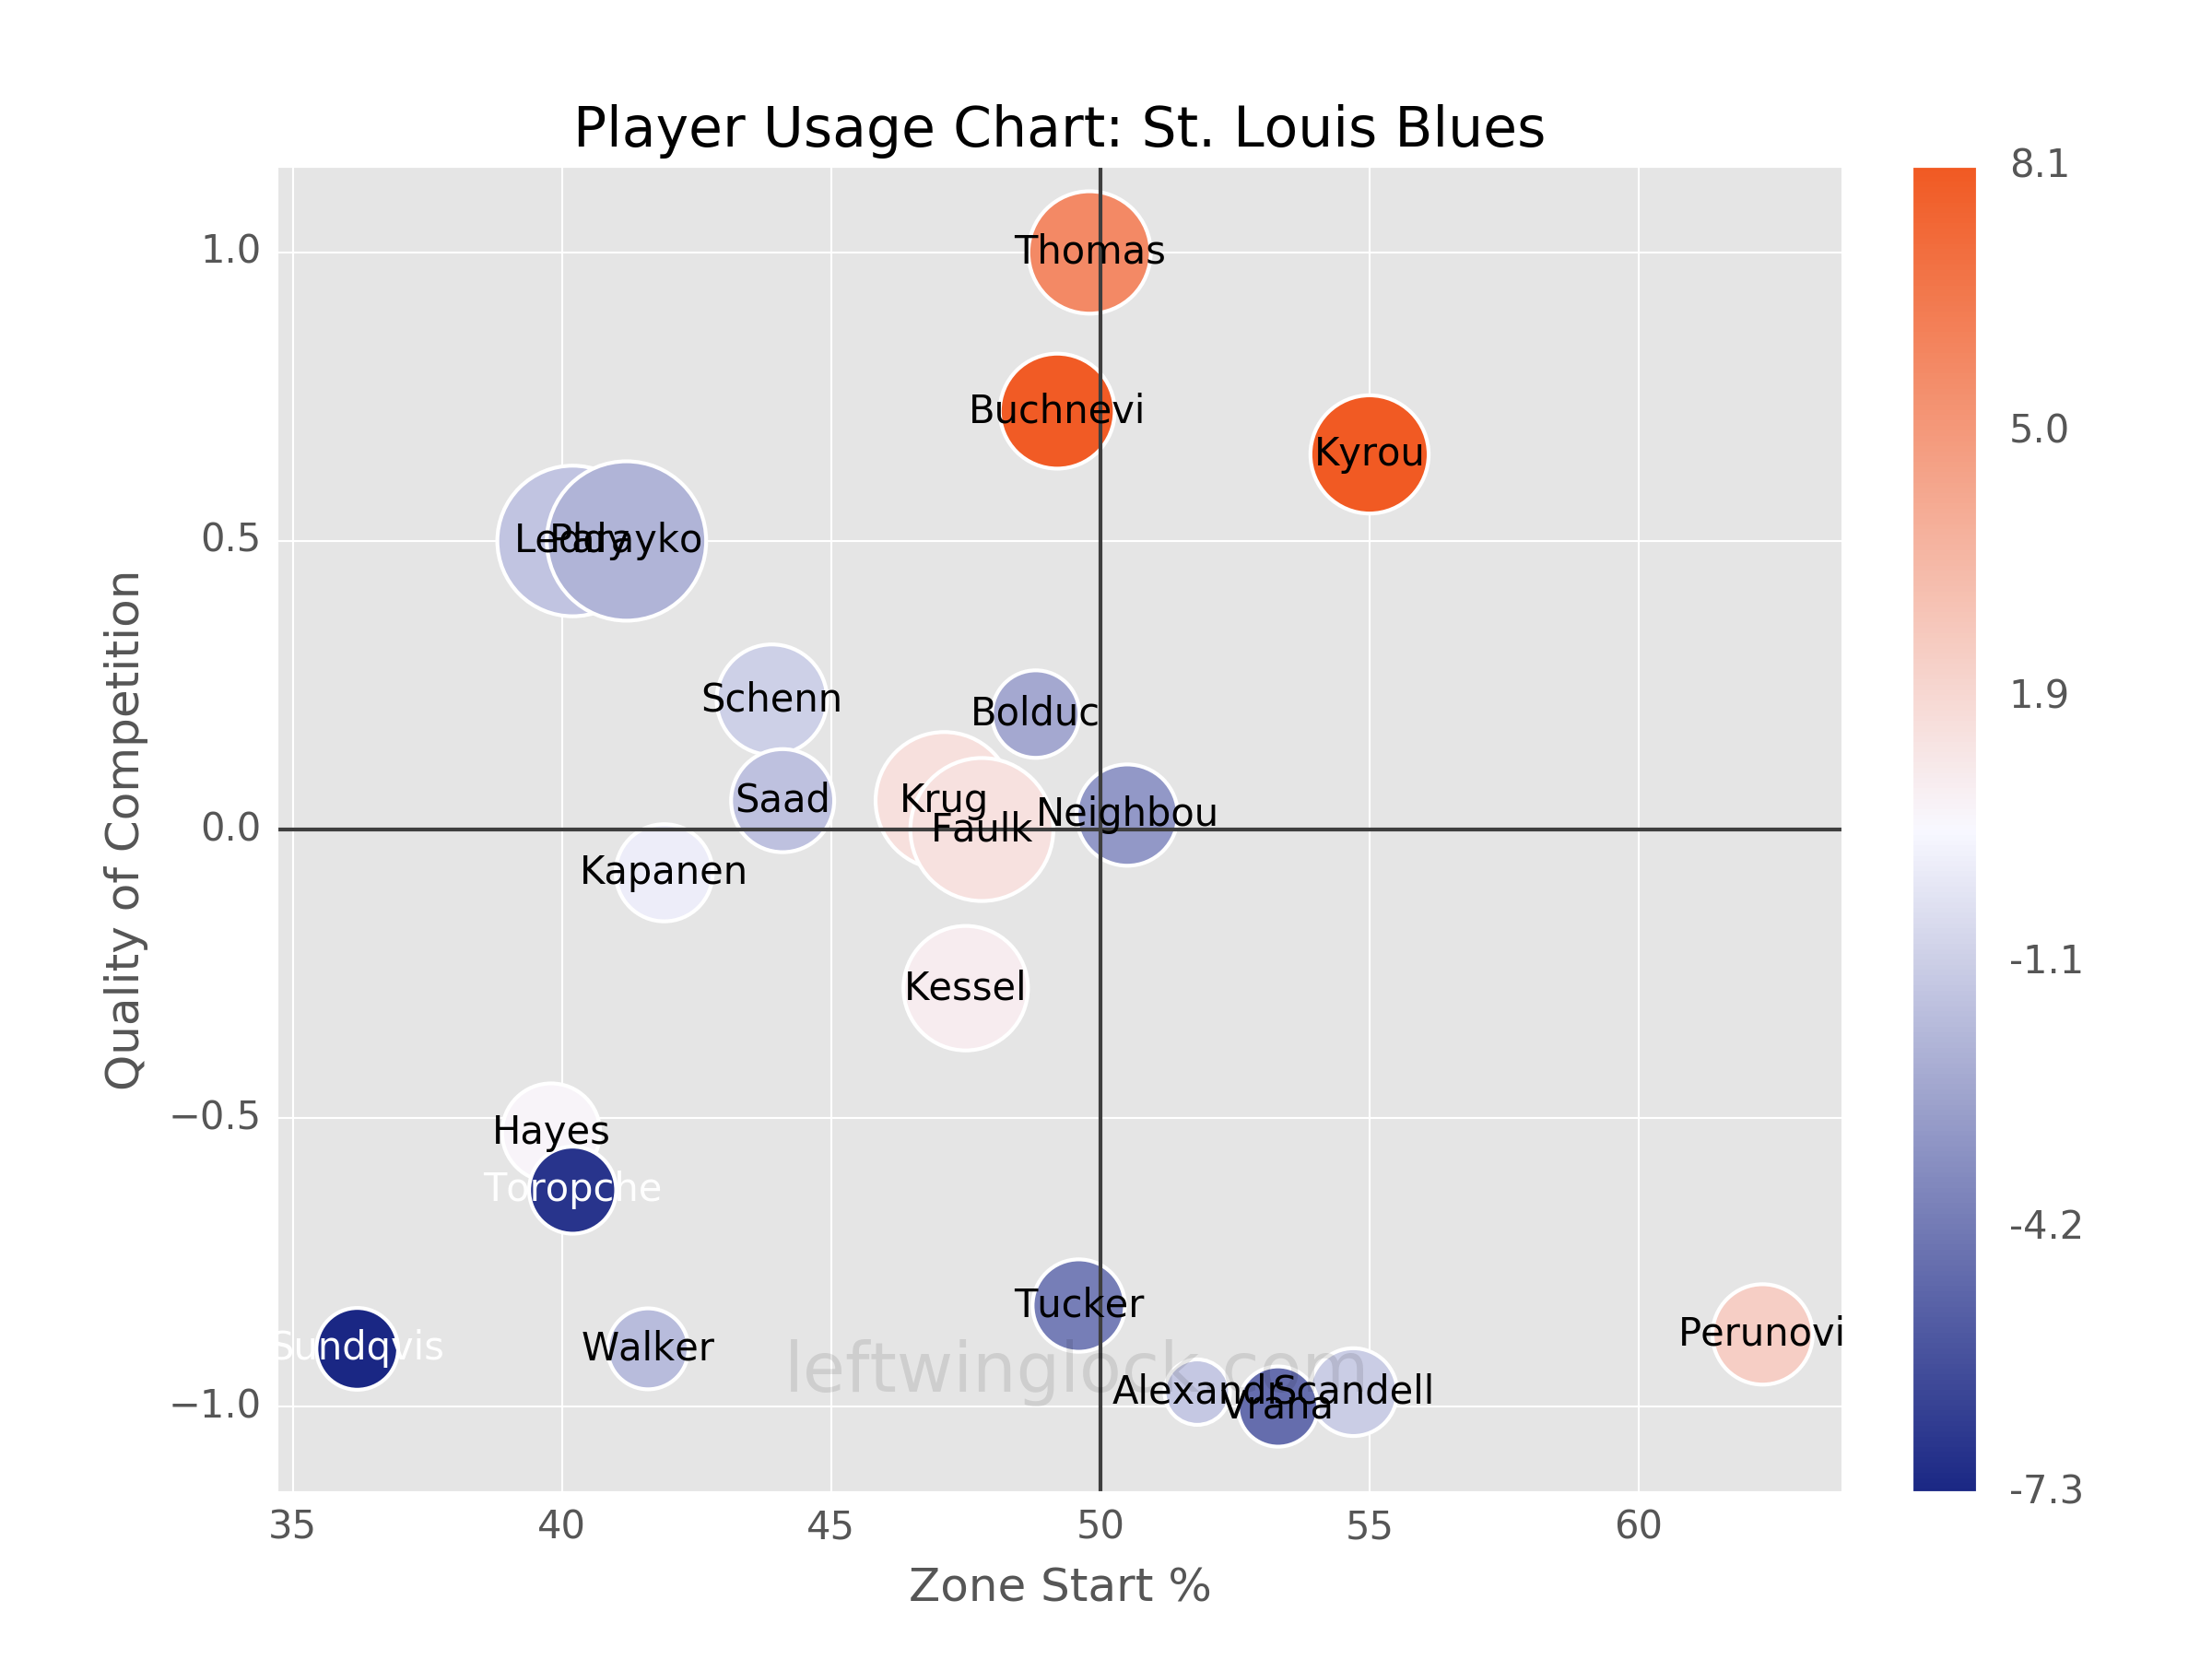
Player Usage Chart / Possession and Luck Chart