Kevin Labanc
Explore projections, stats, news, player usage charts, and line combinations for members of the San Jose Sharks
-
Right Wing Leaders
2023 - 2024
Name G A Pts Nikita
Kucherov44 100 144 David Pastrnak 47 63 110 Mikko Rantanen 42 62 104 William Nylander 40 58 98 Mitchell Marner 26 59 85 Clayton Keller 33 43 76 Adrian Kempe 28 47 75 Brock Boeser 40 33 73 Jonathan Marchessault 42 27 69 Travis Konecny 33 35 68 Alex DeBrincat 27 40 67 Drake Batherson 28 38 66 -
Player Card

Kevin Labanc
San Jose Sharks2023 - 2024- G 2
- A 7
- PTS 9
- +/- -27
- PIM 16
- PPP 3
- SH% 3.3
- L 28%
- C 0%
- R 72%
-
San Jose Sharks Leaders
2023 - 2024
Name G A Pts Mikael
Granlund12 48 60 William Eklund 16 29 45 Fabian Zetterlund 24 20 44 Filip Zadina 13 10 23 Mike Hoffman 10 13 23 Mario Ferraro 3 18 21 Jan Rutta 5 14 19 Luke Kunin 11 7 18 Calen Addison 1 16 17 Klim Kostin 8 6 14 Justin Bailey 5 9 14 Nico Sturm 5 8 13
News
-
Kevin Labanc
Is not expected to be in the lineup for today's game.
Apr 6, 2024 - 3:36 pm -
Kevin Labanc
Is expected to be in the lineup for today's game.
Mar 28, 2024 - 1:08 pm -
Kevin Labanc
Is not expected to be in the lineup for today's game.
Feb 24, 2024 - 9:32 pm -
Kevin Labanc
Is expected to be in the lineup for today's game.
Feb 17, 2024 - 1:52 pm
Feature
-
Trending
Buy-Low and Sell-High: Skaters
Replies 0
Basic Stats
| Season | Team | GP | G | A | P | +/- | PIM | S | S/GP | SH% | PPP | H | BS | FW | FO% | TOI | EVTOI | PPTOI | PKTOI |
|---|---|---|---|---|---|---|---|---|---|---|---|---|---|---|---|---|---|---|---|
| 23-24 | SJS | 46 | 2 | 7 | 9 | -27 | 16 | 60 | 1.3 | 3.3 | 3 | 61 | 17 | 6 | 30.0 | 11.62 | 10.72 | 0.91 | 0.00 |
| 22-23 | SJS | 72 | 15 | 18 | 33 | -17 | 36 | 129 | 1.8 | 11.6 | 3 | 70 | 28 | 5 | 62.5 | 14.33 | 13.02 | 1.31 | 0.00 |
| 21-22 | SJS | 21 | 3 | 3 | 6 | -4 | 6 | 36 | 1.7 | 8.3 | 4 | 28 | 9 | 0 | 0.0 | 13.29 | 11.40 | 1.89 | 0.00 |
| 20-21 | SJS | 55 | 12 | 16 | 28 | -9 | 31 | 129 | 2.3 | 9.3 | 3 | 61 | 15 | 0 | 0.0 | 16.42 | 14.23 | 2.17 | 0.02 |
| 19-20 | SJS | 70 | 14 | 19 | 33 | -33 | 38 | 176 | 2.5 | 8.0 | 9 | 46 | 24 | 2 | 16.7 | 16.07 | 13.62 | 2.41 | 0.04 |
Enhanced Stats (5-on-5 unless denoted with *)
| Season | G/60 | A/60 | P/60 | IPP | ΔPEN/60 | 1A | 2A | EVS/60* | PPS/60* | SATF | SAT% | tEVSH% | tEVSV% | SHSV | ZS% |
|---|---|---|---|---|---|---|---|---|---|---|---|---|---|---|---|
| 23-24 | 0.25 | 0.49 | 0.74 | 67 | -0.22 | 2 | 2 | 6.4 | 11.5 | 462 | 47.8 | 4.0 | 0.862 | 902 | 40.6 |
| 22-23 | 0.86 | 1.06 | 1.92 | 62 | -0.70 | 12 | 4 | 6.8 | 13.4 | 968 | 54.4 | 9.5 | 0.887 | 982 | 51.0 |
| 21-22 | 0.25 | 0.25 | 0.51 | 50 | 0.00 | 1 | 0 | 6.4 | 16.6 | 174 | 45.9 | 4.0 | 0.949 | 989 | 38.3 |
| 20-21 | 0.96 | 1.03 | 1.99 | 69 | 0.20 | 8 | 5 | 8.1 | 12.0 | 710 | 51.0 | 9.2 | 0.900 | 992 | 42.0 |
| 19-20 | 0.66 | 0.66 | 1.33 | 67 | -0.05 | 6 | 4 | 8.4 | 13.8 | 947 | 55.3 | 6.5 | 0.882 | 947 | 51.1 |
Regression Meter
This meter measures whether or not a player's point production is being influenced by luck. Orange indicates the player has been lucky. Dark grey indicates the player has been unlucky.
2A/60
tEVSH%
SH%
IPP
PPSH%
Positional Data
| Season | Team | Left | Center | Right |
|---|---|---|---|---|
| 23-24 | SJS | 28 | 0 | 72 |
| 22-23 | SJ | 0 | 0 | 100 |
| 21-22 | SJ | 0 | 0 | 100 |
| 20-21 | SJ | 4 | 0 | 96 |
| 19-20 | SJ | 0 | 0 | 100 |
Most Common Linemates and Line Production
See also: San Jose Sharks Line Combo Tool | Line Production Tool
| Team | F1 | F2 | F3 | GF | GA | GF% | SATF | SATA | SAT% | USATF | USATA | USAT% | SH% | SV% | SHSV | ZS% |
|---|---|---|---|---|---|---|---|---|---|---|---|---|---|---|---|---|
| SJS | LABANC | STURM | ZADINA | 0 | 4 | 0.0 | 37 | 37 | 50.0 | 22 | 29 | 43.1 | 0.0 | 0.778 | 778 | 33.3 |
| SJS | LABANC | CARPENTER | SMITH | 0 | 1 | 0.0 | 28 | 31 | 47.5 | 23 | 19 | 54.8 | 0.0 | 0.923 | 923 | 62.5 |
| SJS | BAILEY | CARPENTER | LABANC | 1 | 2 | 33.3 | 28 | 11 | 71.8 | 20 | 6 | 76.9 | 7.1 | 0.500 | 571 | 66.7 |
Most Recent 10 Games
| OPP | G | A | P | +/- | PIM | SOG | SH% | H | BS | FW | FL | FO% | TOI | EVTOI | PPTOI | PKTOI | ID |
|---|---|---|---|---|---|---|---|---|---|---|---|---|---|---|---|---|---|
| MIN | 0 | 0 | 0 | -2 | 0 | 1 | 0 | 3 | 0 | 0 | 0 | 0 | 12:57 | 12:09 | 00:48 | 00:00 | 21282 |
| LAK | 0 | 0 | 0 | 0 | 0 | 1 | 0 | 0 | 0 | 0 | 0 | 0 | 07:55 | 07:55 | 00:00 | 00:00 | 21210 |
| SEA | 0 | 0 | 0 | -1 | 0 | 1 | 0 | 0 | 0 | 0 | 0 | 0 | 08:49 | 08:49 | 00:00 | 00:00 | 21188 |
| STL | 0 | 0 | 0 | 0 | 0 | 0 | 0 | 2 | 1 | 0 | 0 | 0 | 12:04 | 10:33 | 01:31 | 00:00 | 21177 |
| MIN | 0 | 0 | 0 | 0 | 0 | 3 | 0 | 1 | 0 | 0 | 0 | 0 | 10:52 | 10:52 | 00:00 | 00:00 | 21156 |
| CHI | 0 | 1 | 1 | -2 | 0 | 1 | 0 | 0 | 0 | 0 | 1 | 0 | 12:07 | 12:07 | 00:00 | 00:00 | 21076 |
| CBJ | 0 | 1 | 1 | 1 | 4 | 3 | 0 | 2 | 1 | 0 | 0 | 0 | 13:34 | 13:31 | 00:03 | 00:00 | 21065 |
| PIT | 0 | 0 | 0 | -2 | 0 | 3 | 0 | 1 | 0 | 1 | 0 | 100 | 07:33 | 07:26 | 00:07 | 00:00 | 21051 |
| NYI | 0 | 0 | 0 | 0 | 0 | 0 | 0 | 1 | 1 | 0 | 0 | 0 | 14:54 | 14:54 | 00:00 | 00:00 | 21004 |
| MIN | 0 | 0 | 0 | -1 | 4 | 0 | 0 | 1 | 1 | 1 | 0 | 100 | 13:45 | 13:45 | 00:00 | 00:00 | 20972 |
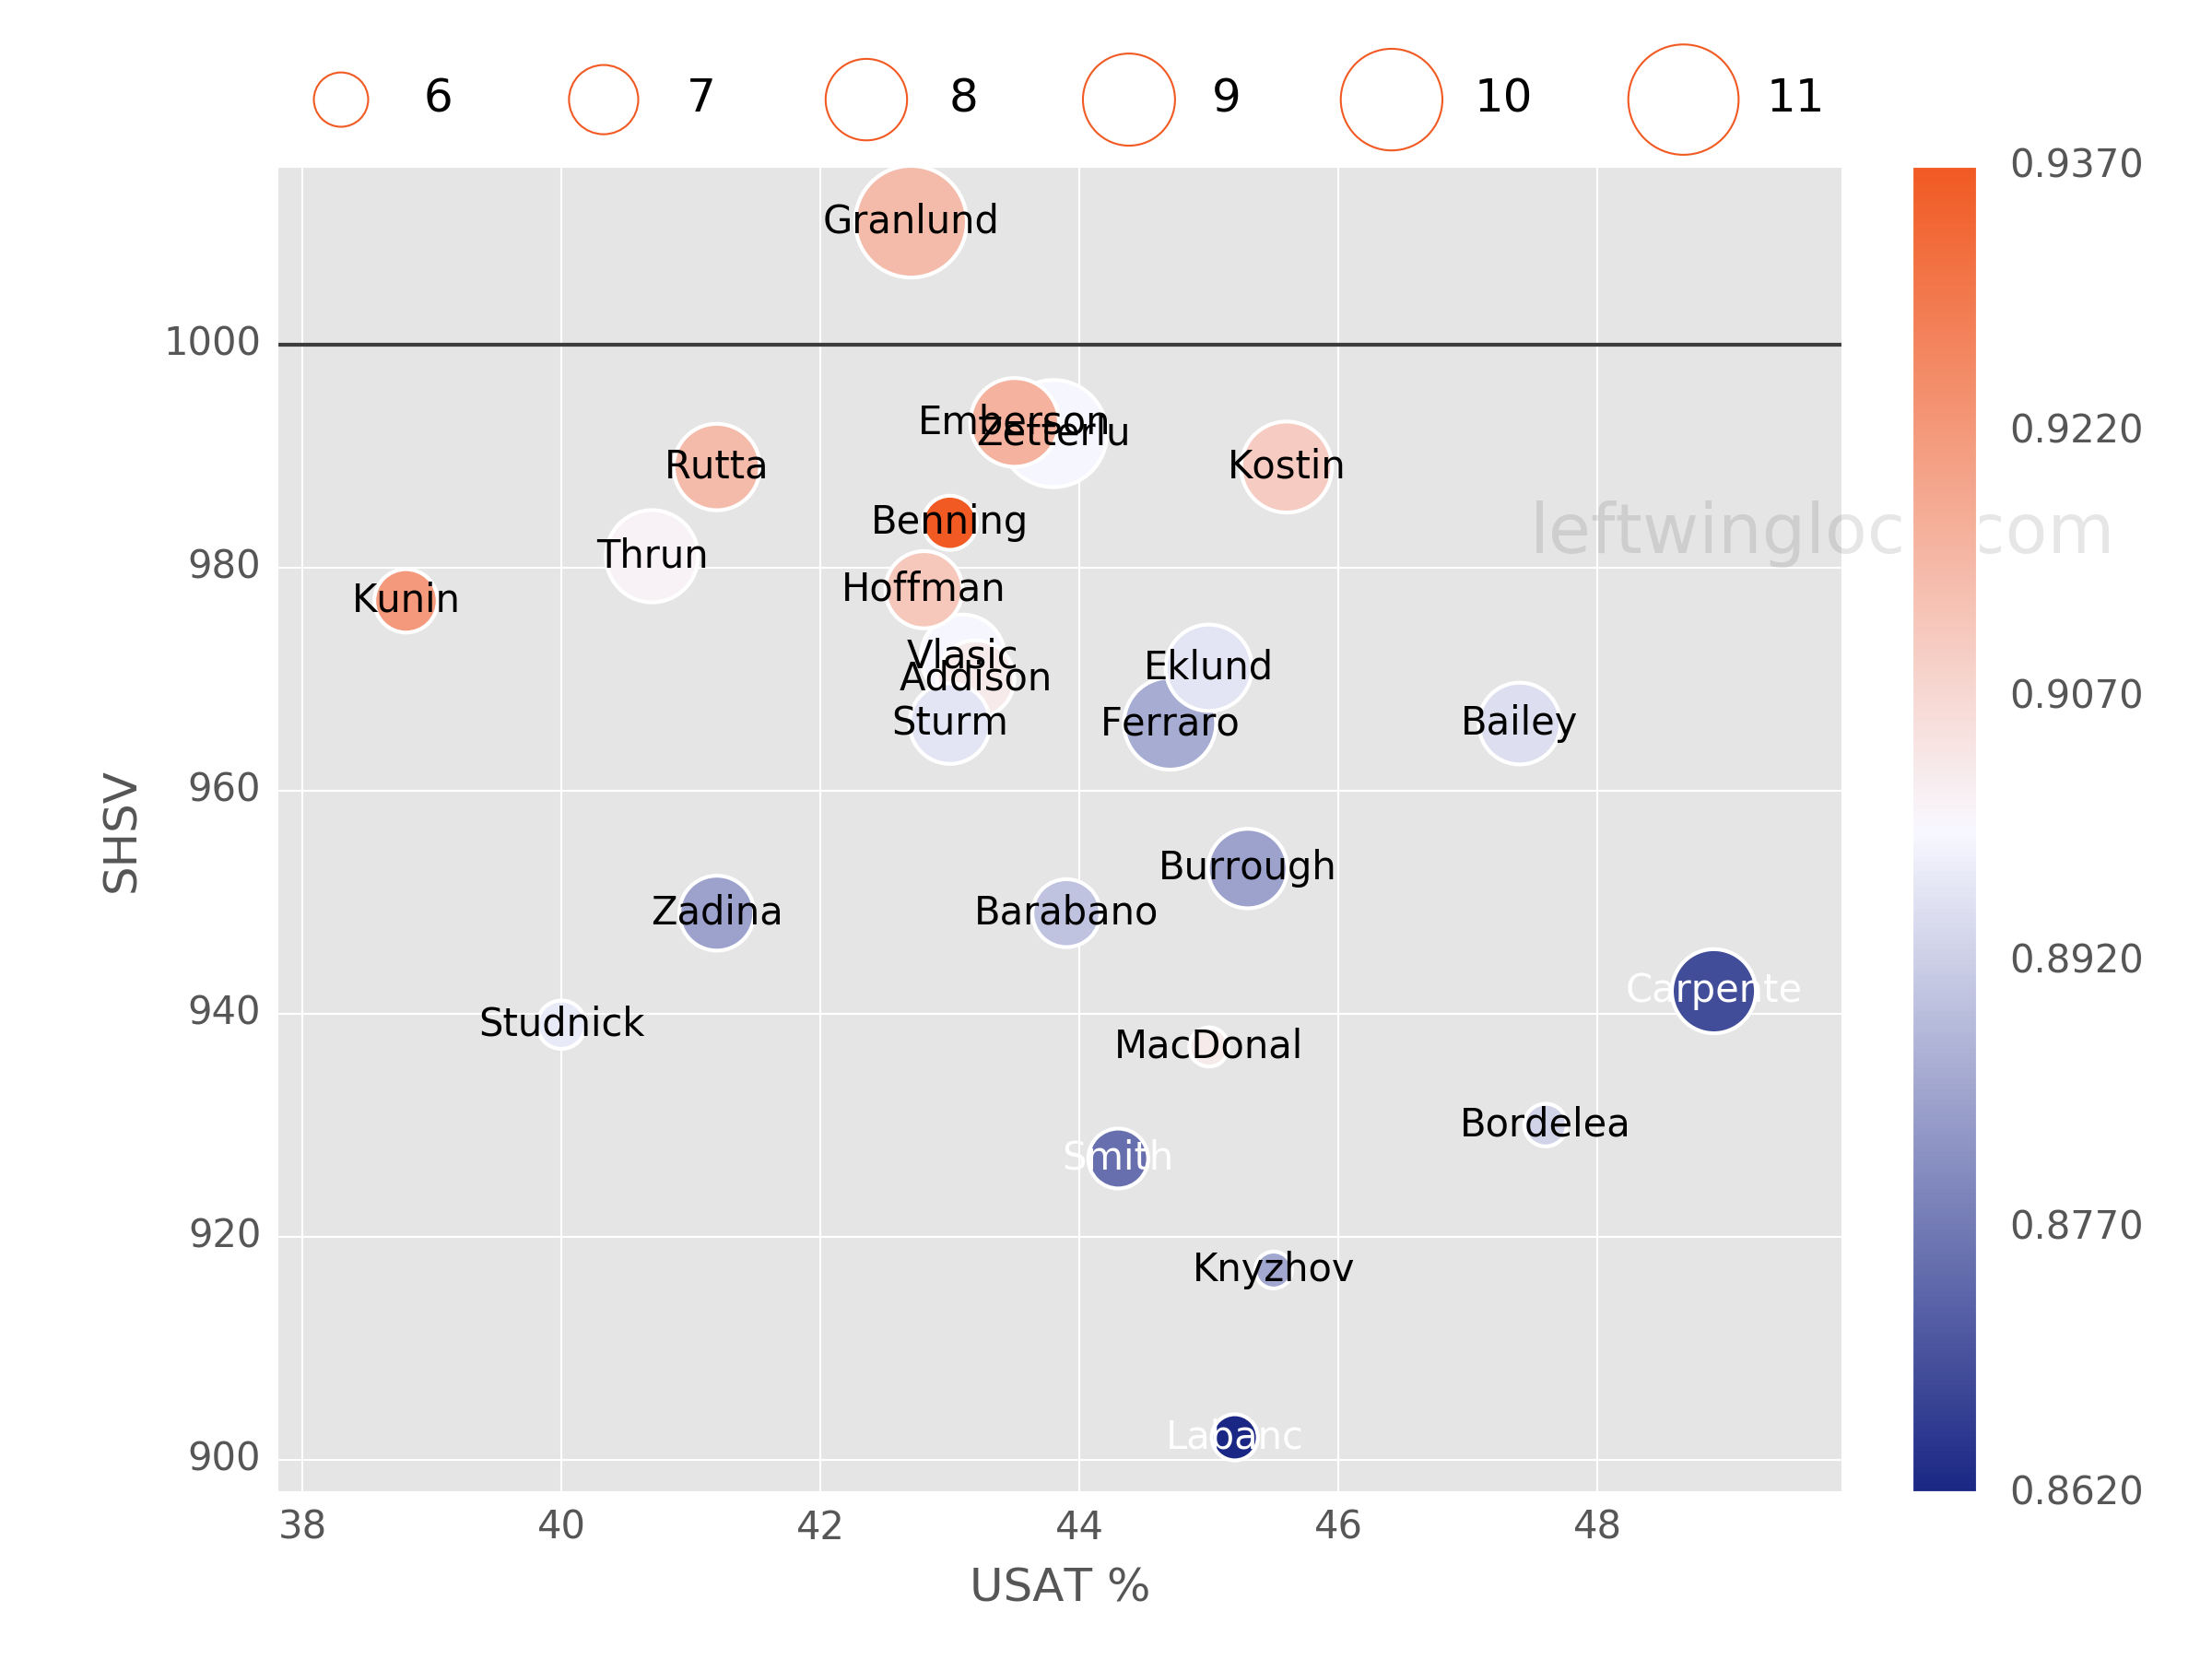
Player Usage Chart / Possession and Luck Chart