MICHAEL BUNTING
Explore projections, stats, news, player usage charts, and line combinations for members of the Pittsburgh Penguins
-
Left Wing Leaders
2023 - 2024
Name G A Pts Artemi
Panarin49 71 120 Kirill Kaprizov 46 50 96 Filip Forsberg 48 46 94 Matthew Tkachuk 26 62 88 Jesper Bratt 27 56 83 Jason Robertson 29 51 80 Zach Hyman 54 23 77 Chris Kreider 39 36 75 Brandon Hagel 26 49 75 Brady Tkachuk 37 37 74 Kevin Fiala 29 44 73 Lucas Raymond 31 41 72 -
Player Card

MICHAEL BUNTING
Pittsburgh Penguins2023 - 2024- G 19
- A 36
- PTS 55
- +/- -19
- PIM 57
- PPP 21
- SH% 11.3
- L 100%
- C 0%
- R 0%
-
Pittsburgh Penguins Leaders
2023 - 2024
Name G A Pts Sidney
Crosby42 52 94 Evgeni Malkin 27 40 67 Bryan Rust 28 28 56 Erik Karlsson 11 45 56 Michael Bunting 19 36 55 Kris Letang 10 41 51 Reilly Smith 13 27 40 Rickard Rakell 15 22 37 Drew O'Connor 16 17 33 Lars Eller 15 16 31 Marcus Pettersson 4 26 30 Valtteri Puustinen 5 15 20
News
-
Michael Bunting
Plans to play in tonight's game despite being suspected of leaving Saturday's game with diarrhea.
Apr 1, 2024 - 11:56 am -
Michael Bunting
Has been traded to the Pittsburgh Penguins, along with Ville Koivunen, Vasiliy Ponomarev, Cruz Lucius, a 2024 2nd round draft pick, and a 2024 5th round draft pick, in exchange for Jake Guentzel and T...
Mar 7, 2024 - 11:40 pm -
Michael Bunting
Will miss tonight's game due to trade-related reasons.
Mar 7, 2024 - 6:16 pm -
Michael Bunting
Will miss tonight's game against the New York Islanders due to personal reasons.
Nov 4, 2023 - 6:59 pm
Feature
-
Trending
No articles available
Replies 0
Basic Stats
| Season | Team | GP | G | A | P | +/- | PIM | S | S/GP | SH% | PPP | H | BS | FW | FO% | TOI | EVTOI | PPTOI | PKTOI |
|---|---|---|---|---|---|---|---|---|---|---|---|---|---|---|---|---|---|---|---|
| 23-24 | PIT | 81 | 19 | 36 | 55 | -19 | 57 | 168 | 2.1 | 11.3 | 21 | 49 | 21 | 7 | 30.4 | 15.69 | 12.84 | 2.84 | 0.01 |
| 22-23 | TOR | 82 | 23 | 26 | 49 | 21 | 103 | 174 | 2.1 | 13.2 | 10 | 85 | 18 | 1 | 50.0 | 15.80 | 13.98 | 1.82 | 0.00 |
| 21-22 | TOR | 79 | 23 | 40 | 63 | 27 | 80 | 175 | 2.2 | 13.1 | 5 | 85 | 21 | 8 | 50.0 | 15.54 | 14.24 | 1.29 | 0.02 |
| 20-21 | ARI | 21 | 10 | 3 | 13 | -1 | 12 | 38 | 1.8 | 26.3 | 3 | 28 | 1 | 7 | 58.3 | 16.69 | 14.77 | 1.91 | 0.01 |
Enhanced Stats (5-on-5 unless denoted with *)
| Season | G/60 | A/60 | P/60 | IPP | ΔPEN/60 | 1A | 2A | EVS/60* | PPS/60* | SATF | SAT% | tEVSH% | tEVSV% | SHSV | ZS% |
|---|---|---|---|---|---|---|---|---|---|---|---|---|---|---|---|
| 23-24 | 0.65 | 1.30 | 1.95 | 73 | 0.66 | 16 | 6 | 6.9 | 12.5 | 1176 | 55.9 | 8.0 | 0.890 | 970 | 65.2 |
| 22-23 | 0.76 | 1.19 | 1.94 | 55 | 0.05 | 16 | 6 | 7.5 | 11.7 | 1183 | 51.7 | 10.2 | 0.936 | 1038 | 62.3 |
| 21-22 | 1.15 | 2.02 | 3.16 | 64 | 0.64 | 22 | 15 | 8.7 | 7.7 | 1243 | 57.2 | 13.0 | 0.889 | 1019 | 57.8 |
| 20-21 | 1.42 | 0.61 | 2.03 | 77 | -0.51 | 1 | 2 | 6.1 | 7.5 | 291 | 56.0 | 8.6 | 0.910 | 996 | 68.3 |
Regression Meter
This meter measures whether or not a player's point production is being influenced by luck. Orange indicates the player has been lucky. Dark grey indicates the player has been unlucky.
Positional Data
| Season | Team | Left | Center | Right |
|---|---|---|---|---|
| 23-24 | PIT | 100 | 0 | 0 |
| 22-23 | TOR | 100 | 0 | 0 |
| 21-22 | TOR | 100 | 0 | 0 |
| 20-21 | ARI | 100 | 0 | 0 |
Most Common Linemates and Line Production
See also: Pittsburgh Penguins Line Combo Tool | Line Production Tool
| Team | F1 | F2 | F3 | GF | GA | GF% | SATF | SATA | SAT% | USATF | USATA | USAT% | SH% | SV% | SHSV | ZS% |
|---|---|---|---|---|---|---|---|---|---|---|---|---|---|---|---|---|
| PIT | BUNTING | MALKIN | RAKELL | 15 | 9 | 62.5 | 234 | 176 | 57.1 | 166 | 126 | 56.8 | 13.8 | 0.889 | 1027 | 86.4 |
| CAR | BUNTING | DRURY | NECAS | 6 | 6 | 50.0 | 214 | 134 | 61.5 | 146 | 107 | 57.7 | 6.3 | 0.920 | 983 | 73.5 |
| CAR | BUNTING | KOTKANIEMI | NECAS | 5 | 5 | 50.0 | 140 | 111 | 55.8 | 100 | 80 | 55.6 | 7.6 | 0.923 | 999 | 53.1 |
Most Recent 10 Games
| OPP | G | A | P | +/- | PIM | SOG | SH% | H | BS | FW | FL | FO% | TOI | EVTOI | PPTOI | PKTOI | ID |
|---|---|---|---|---|---|---|---|---|---|---|---|---|---|---|---|---|---|
| NYI | 0 | 2 | 2 | 0 | 0 | 4 | 0 | 0 | 0 | 0 | 0 | 0 | 18:16 | 16:05 | 02:11 | 00:00 | 21303 |
| NSH | 0 | 1 | 1 | 0 | 0 | 1 | 0 | 1 | 1 | 0 | 0 | 0 | 18:34 | 12:27 | 06:07 | 00:00 | 21289 |
| BOS | 1 | 1 | 2 | -2 | 0 | 2 | 50 | 0 | 0 | 1 | 0 | 100 | 16:55 | 15:13 | 01:42 | 00:00 | 21279 |
| DET | 0 | 1 | 1 | -1 | 0 | 2 | 0 | 0 | 0 | 0 | 0 | 0 | 18:42 | 16:42 | 02:00 | 00:00 | 21258 |
| TOR | 0 | 0 | 0 | 1 | 0 | 6 | 0 | 3 | 0 | 0 | 0 | 0 | 21:16 | 14:45 | 06:31 | 00:00 | 21237 |
| TBL | 1 | 2 | 3 | 2 | 0 | 2 | 50 | 3 | 0 | 0 | 0 | 0 | 15:12 | 12:47 | 02:25 | 00:00 | 21217 |
| WSH | 1 | 0 | 1 | 1 | 0 | 6 | 16.7 | 2 | 1 | 0 | 0 | 0 | 17:40 | 15:27 | 02:13 | 00:00 | 21206 |
| NJD | 0 | 2 | 2 | 4 | 0 | 1 | 0 | 0 | 0 | 0 | 0 | 0 | 15:25 | 12:39 | 02:46 | 00:00 | 21191 |
| NYR | 0 | 0 | 0 | 0 | 0 | 1 | 0 | 0 | 1 | 0 | 0 | 0 | 16:19 | 13:10 | 03:09 | 00:00 | 21182 |
| CBJ | 0 | 0 | 0 | -1 | 0 | 0 | 0 | 0 | 0 | 0 | 0 | 0 | 09:54 | 08:54 | 01:00 | 00:00 | 21171 |
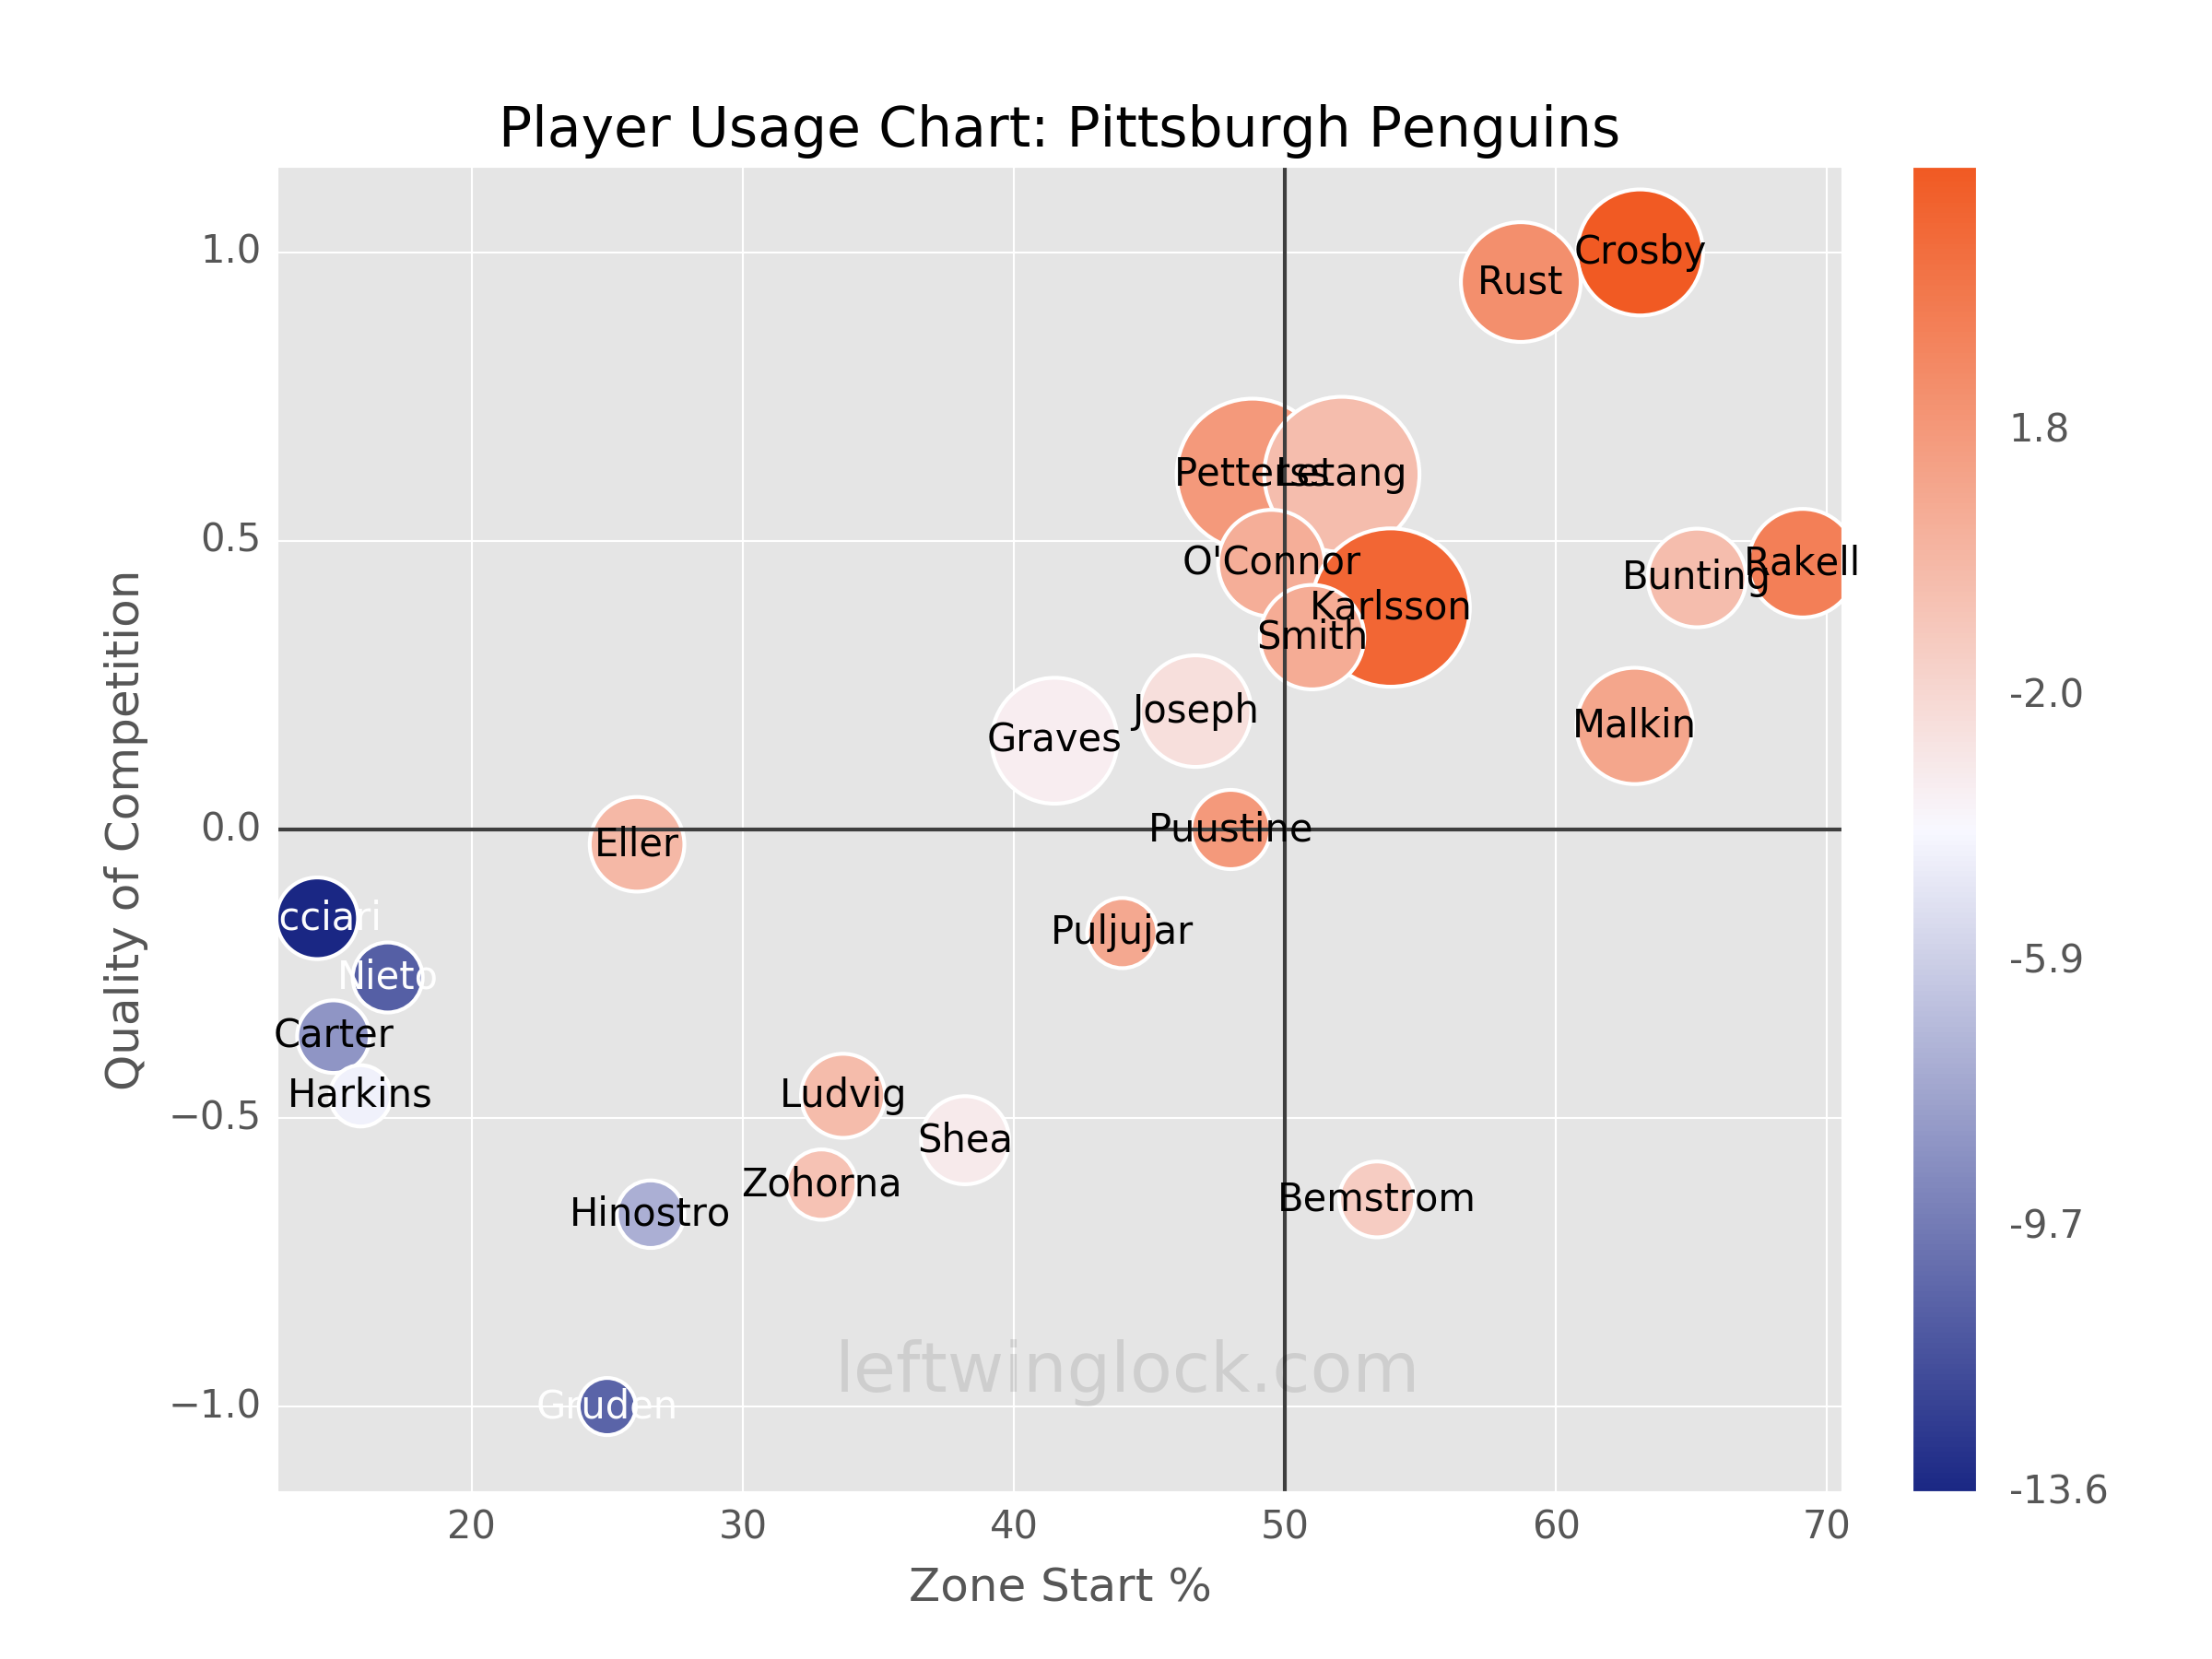
Player Usage Chart / Possession and Luck Chart