Pierre-Luc Dubois
Explore projections, stats, news, player usage charts, and line combinations for members of the Los Angeles Kings
-
Center Leaders
2023 - 2024
Name G A Pts Nathan
MacKinnon51 89 140 Connor McDavid 32 100 132 Auston Matthews 69 38 107 Leon Draisaitl 41 65 106 J.T. Miller 37 66 103 Sam Reinhart 57 37 94 Sidney Crosby 42 52 94 Brayden Point 46 44 90 Sebastian Aho 36 53 89 Elias Pettersson 34 55 89 Robert Thomas 26 60 86 Steven Stamkos 40 41 81 -
Player Card

Pierre-Luc Dubois
Los Angeles Kings2023 - 2024- G 16
- A 24
- PTS 40
- +/- -9
- PIM 70
- PPP 8
- SH% 11
- L 4%
- C 96%
- R 0%
-
Los Angeles Kings Leaders
2023 - 2024
Name G A Pts Adrian
Kempe28 47 75 Kevin Fiala 29 44 73 Anze Kopitar 26 44 70 Trevor Moore 31 26 57 Quinton Byfield 20 35 55 Drew Doughty 15 35 50 Phillip Danault 17 30 47 Pierre-Luc Dubois 16 24 40 Matt Roy 5 20 25 Jordan Spence 2 22 24 Alex Laferriere 12 11 23 Vladislav Gavrikov 6 17 23
News
-
Pierre-Luc Dubois
Is on the ice for the morning skate.
Nov 18, 2023 - 1:23 pm -
Pierre-Luc Dubois
Will be evaluated again on Saturday, but the early test results on his injury look better than expected.
Nov 17, 2023 - 3:16 pm -
Pierre-Luc Dubois
Is not on the ice for practice.
Nov 17, 2023 - 1:58 pm -
Pierre-Luc Dubois
Left Thursday's game with a leg injury after crashing into the post.
Nov 17, 2023 - 5:00 am
Feature
-
Trending
Finding Value at the LW Position
Replies 0
Basic Stats
| Season | Team | GP | G | A | P | +/- | PIM | S | S/GP | SH% | PPP | H | BS | FW | FO% | TOI | EVTOI | PPTOI | PKTOI |
|---|---|---|---|---|---|---|---|---|---|---|---|---|---|---|---|---|---|---|---|
| 23-24 | LAK | 82 | 16 | 24 | 40 | -9 | 70 | 146 | 1.8 | 11.0 | 8 | 96 | 37 | 440 | 49.7 | 15.70 | 13.54 | 2.11 | 0.05 |
| 22-23 | WPG | 73 | 27 | 36 | 63 | 5 | 77 | 205 | 2.8 | 13.2 | 23 | 71 | 47 | 483 | 48.9 | 18.45 | 14.76 | 3.62 | 0.07 |
| 21-22 | WPG | 81 | 28 | 32 | 60 | -6 | 106 | 233 | 2.9 | 12.0 | 19 | 112 | 43 | 532 | 46.9 | 18.92 | 15.79 | 3.11 | 0.02 |
| 20-21 | CBJ | 46 | 9 | 12 | 21 | -8 | 38 | 76 | 1.7 | 11.8 | 6 | 59 | 26 | 166 | 43.5 | 15.03 | 13.48 | 1.55 | 0.01 |
| 19-20 | CBJ | 70 | 18 | 31 | 49 | -2 | 49 | 158 | 2.3 | 11.4 | 10 | 85 | 50 | 359 | 44.6 | 17.93 | 15.16 | 2.67 | 0.10 |
Enhanced Stats (5-on-5 unless denoted with *)
| Season | G/60 | A/60 | P/60 | IPP | ΔPEN/60 | 1A | 2A | EVS/60* | PPS/60* | SATF | SAT% | tEVSH% | tEVSV% | SHSV | ZS% |
|---|---|---|---|---|---|---|---|---|---|---|---|---|---|---|---|
| 23-24 | 0.45 | 1.30 | 1.75 | 74 | -0.09 | 15 | 8 | 6.2 | 9.0 | 1093 | 52.6 | 7.6 | 0.905 | 981 | 55.0 |
| 22-23 | 0.71 | 1.07 | 1.78 | 65 | 0.18 | 8 | 10 | 7.2 | 17.3 | 1001 | 51.9 | 9.9 | 0.928 | 1027 | 60.0 |
| 21-22 | 0.45 | 1.21 | 1.66 | 64 | 0.23 | 14 | 10 | 8.0 | 13.6 | 1202 | 50.8 | 7.9 | 0.922 | 1001 | 57.9 |
| 20-21 | 0.60 | 0.60 | 1.21 | 100 | -0.09 | 3 | 3 | 5.8 | 13.5 | 525 | 50.2 | 6.6 | 0.910 | 976 | 63.5 |
| 19-20 | 0.90 | 1.14 | 2.04 | 78 | 0.19 | 11 | 8 | 7.0 | 11.9 | 967 | 51.1 | 7.7 | 0.919 | 996 | 63.8 |
Regression Meter
This meter measures whether or not a player's point production is being influenced by luck. Orange indicates the player has been lucky. Dark grey indicates the player has been unlucky.
2A/60
tEVSH%
SH%
IPP
PPSH%
Positional Data
| Season | Team | Left | Center | Right |
|---|---|---|---|---|
| 23-24 | LAK | 4 | 96 | 0 |
| 22-23 | WPG | 0 | 100 | 0 |
| 21-22 | WPG | 0 | 100 | 0 |
| 20-21 | CBJ | 0 | 100 | 0 |
| 19-20 | CBJ | 0 | 100 | 0 |
Most Common Linemates and Line Production
See also: Los Angeles Kings Line Combo Tool | Line Production Tool
| Team | F1 | F2 | F3 | GF | GA | GF% | SATF | SATA | SAT% | USATF | USATA | USAT% | SH% | SV% | SHSV | ZS% |
|---|---|---|---|---|---|---|---|---|---|---|---|---|---|---|---|---|
| LOS | FIALA | DUBOIS | LAFERRIERE | 8 | 11 | 42.1 | 182 | 174 | 51.1 | 133 | 125 | 51.6 | 8.9 | 0.872 | 961 | 57.6 |
| LOS | LAFERRIERE | DUBOIS | KALIYEV | 3 | 3 | 50.0 | 153 | 117 | 56.7 | 125 | 82 | 60.4 | 3.8 | 0.948 | 986 | 53.3 |
| LOS | GRUNDSTROM | DUBOIS | LAFERRIERE | 2 | 4 | 33.3 | 125 | 101 | 55.3 | 89 | 74 | 54.6 | 3.4 | 0.909 | 943 | 34.8 |
Most Recent 10 Games
| OPP | G | A | P | +/- | PIM | SOG | SH% | H | BS | FW | FL | FO% | TOI | EVTOI | PPTOI | PKTOI | ID |
|---|---|---|---|---|---|---|---|---|---|---|---|---|---|---|---|---|---|
| EDM | 0 | 0 | 0 | 0 | 14 | 0 | 0 | 3 | 0 | 2 | 7 | 22 | 14:08 | 11:28 | 02:40 | 00:00 | 30183 |
| EDM | 0 | 0 | 0 | -1 | 0 | 1 | 0 | 7 | 1 | 5 | 9 | 36 | 15:33 | 14:28 | 01:04 | 00:01 | 30182 |
| EDM | 1 | 0 | 1 | 1 | 4 | 3 | 33.3 | 5 | 0 | 7 | 8 | 47 | 15:00 | 14:05 | 00:55 | 00:00 | 30181 |
| CHI | 0 | 0 | 0 | 0 | 0 | 0 | 0 | 0 | 0 | 8 | 2 | 80 | 17:14 | 14:21 | 02:53 | 00:00 | 21312 |
| MIN | 0 | 0 | 0 | 0 | 0 | 0 | 0 | 0 | 0 | 2 | 4 | 33 | 12:45 | 10:53 | 01:49 | 00:03 | 21294 |
| ANA | 1 | 0 | 1 | 0 | 0 | 3 | 33.3 | 0 | 0 | 8 | 2 | 80 | 19:59 | 15:13 | 04:46 | 00:00 | 21281 |
| CGY | 0 | 0 | 0 | 1 | 0 | 2 | 0 | 0 | 2 | 5 | 5 | 50 | 12:49 | 11:00 | 01:49 | 00:00 | 21264 |
| ANA | 0 | 0 | 0 | -2 | 0 | 2 | 0 | 0 | 0 | 5 | 2 | 71 | 14:26 | 14:08 | 00:09 | 00:09 | 21249 |
| VAN | 0 | 0 | 0 | 0 | 0 | 1 | 0 | 0 | 1 | 6 | 3 | 67 | 11:53 | 11:53 | 00:00 | 00:00 | 21227 |
| SJS | 0 | 1 | 1 | 1 | 0 | 1 | 0 | 0 | 0 | 3 | 8 | 27 | 13:41 | 11:31 | 02:10 | 00:00 | 21210 |
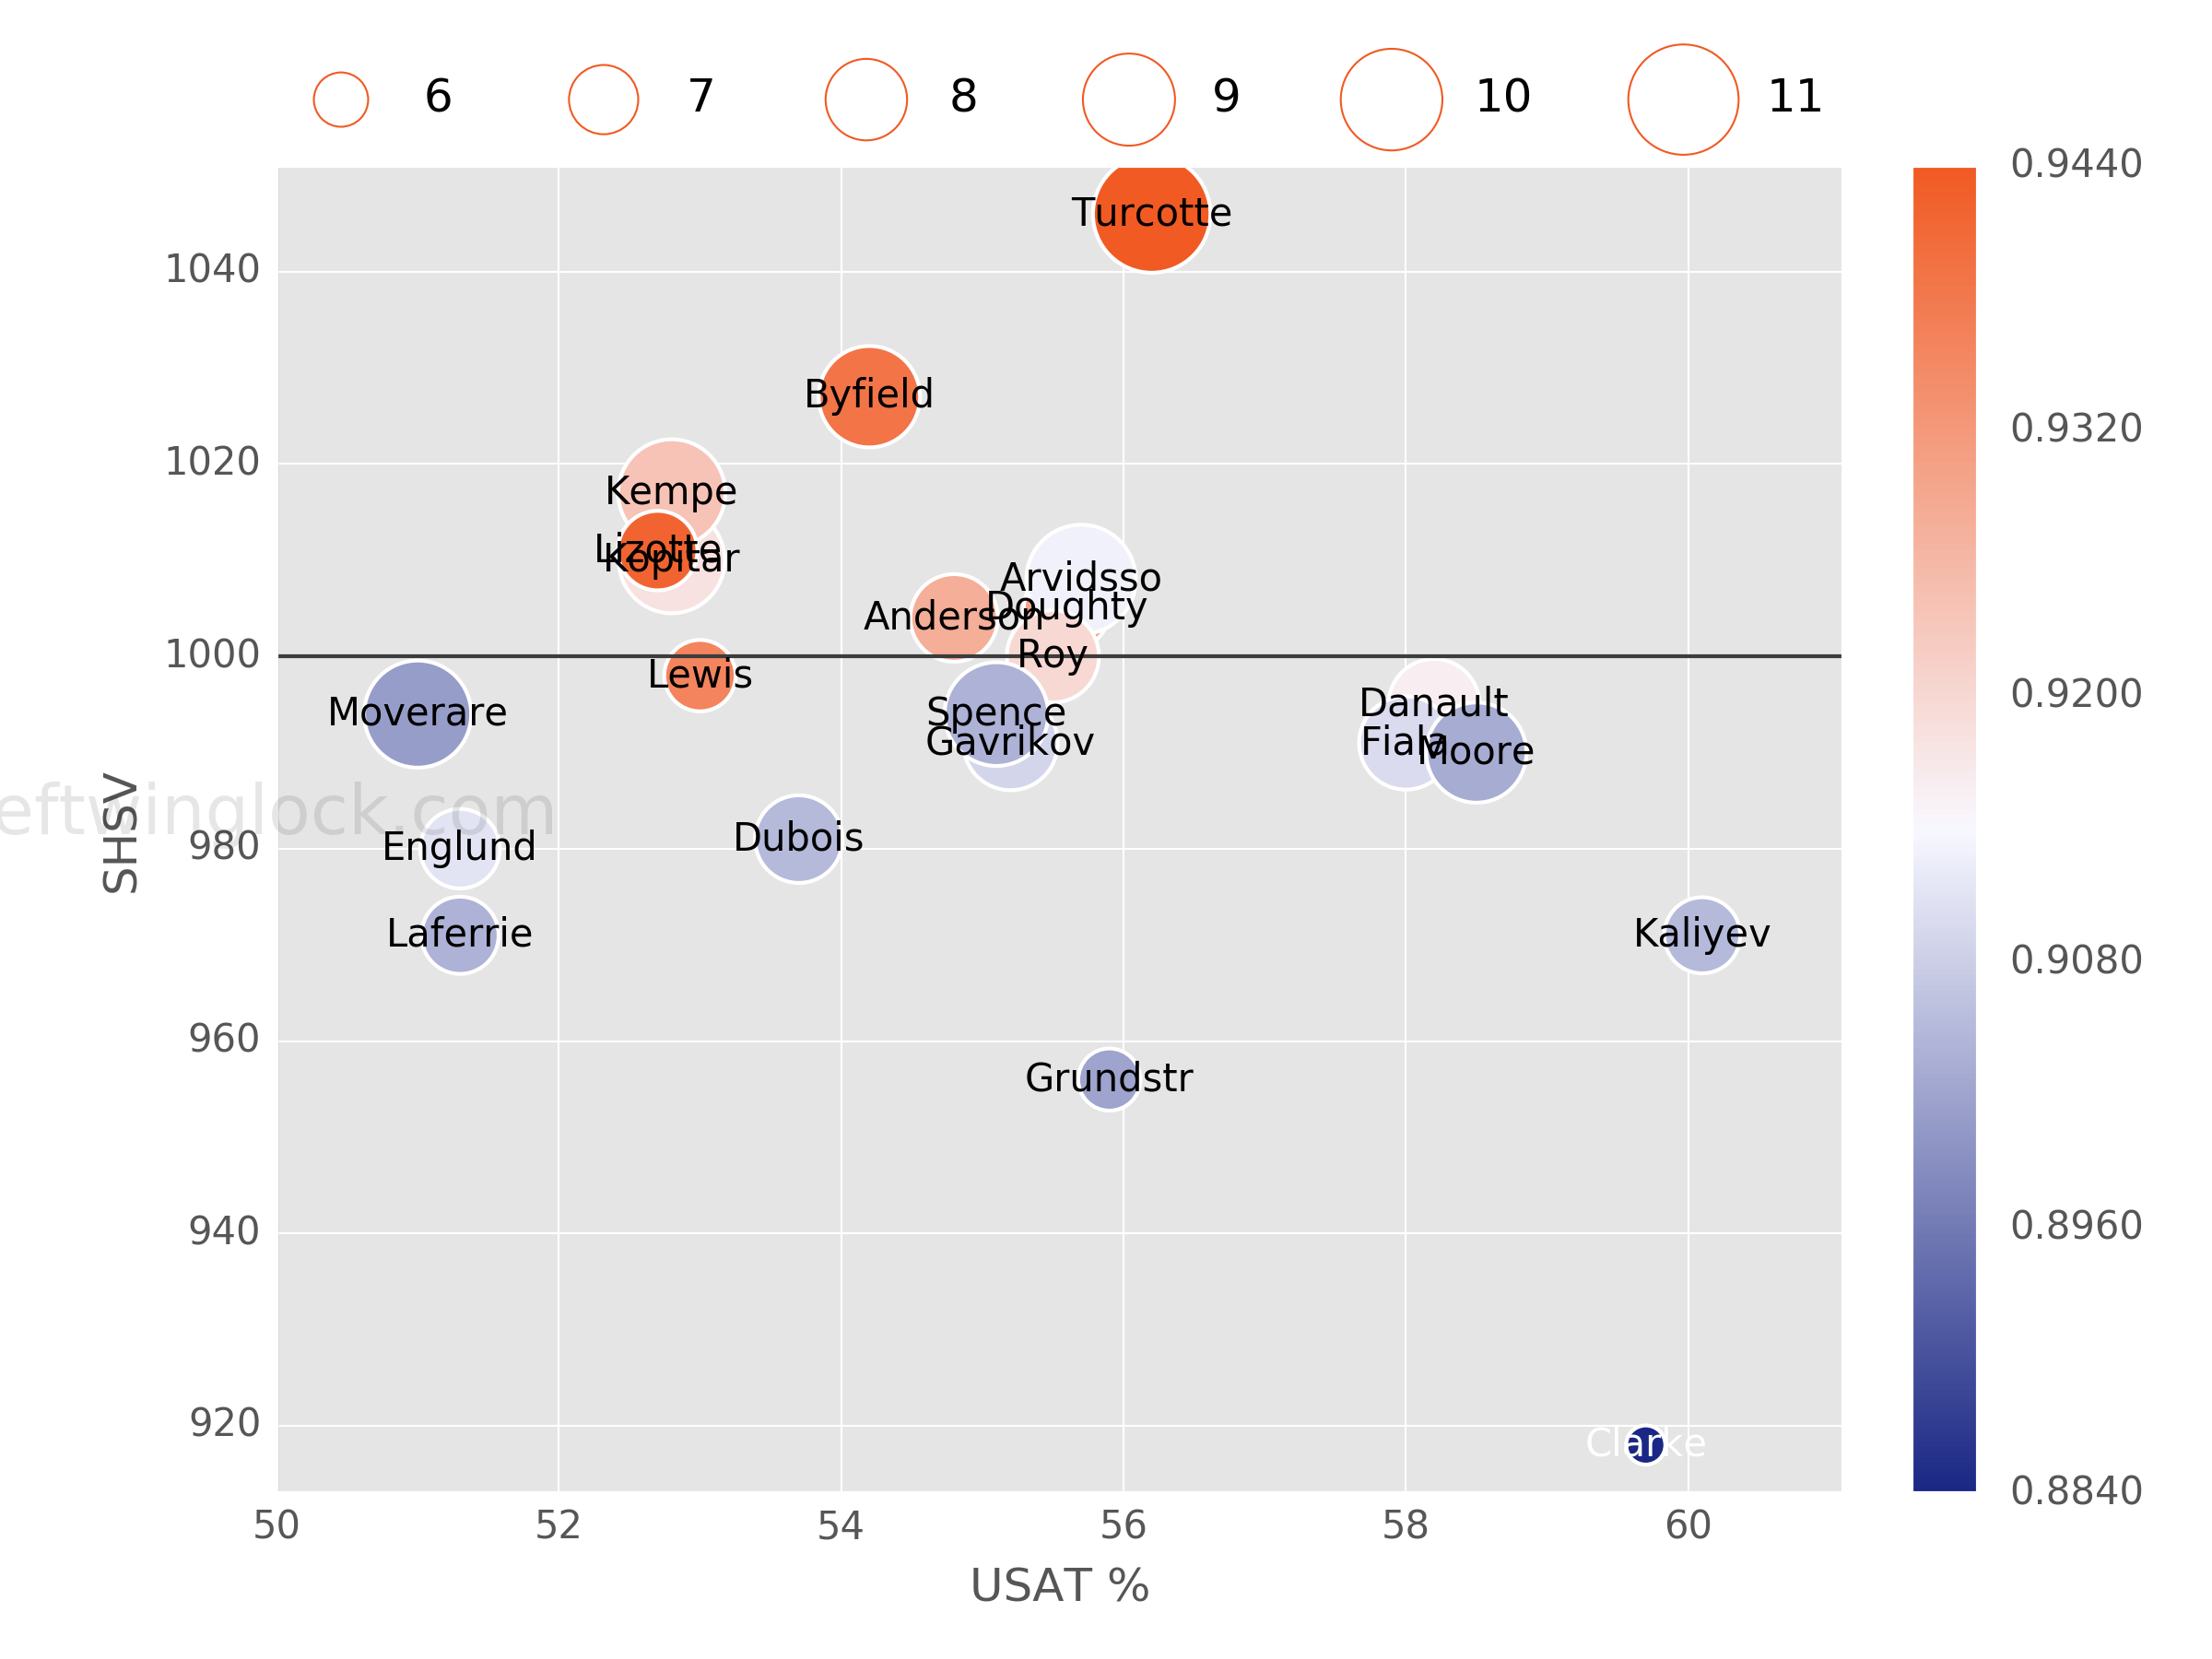
Player Usage Chart / Possession and Luck Chart