SIDNEY CROSBY
Explore projections, stats, news, player usage charts, and line combinations for members of the Pittsburgh Penguins
-
Center Leaders
2023 - 2024
Name PPG PPA PPP Nathan
MacKinnon10 38 48 Connor McDavid 7 37 44 J.T. Miller 10 30 40 Leon Draisaitl 21 18 39 Steven Stamkos 19 20 39 Sam Reinhart 27 7 34 Brayden Point 15 17 32 Sebastian Aho 11 21 32 Elias Pettersson 13 18 31 Mika Zibanejad 12 19 31 Nick Suzuki 12 19 31 Jack Hughes 9 22 31 -
Player Card

SIDNEY CROSBY
Pittsburgh Penguins2023 - 2024- G 42
- A 52
- PTS 94
- +/- 7
- PIM 40
- PPP 23
- SH% 15.1
- L 0%
- C 100%
- R 0%
-
Pittsburgh Penguins Leaders
2023 - 2024
Name G A Pts Sidney
Crosby42 52 94 Evgeni Malkin 27 40 67 Bryan Rust 28 28 56 Erik Karlsson 11 45 56 Michael Bunting 19 36 55 Kris Letang 10 41 51 Reilly Smith 13 27 40 Rickard Rakell 15 22 37 Drew O'Connor 16 17 33 Lars Eller 15 16 31 Marcus Pettersson 4 26 30 Valtteri Puustinen 5 15 20
News
-
Sidney Crosby
Is expected to be in the lineup for today's game.
Dec 6, 2022 - 6:39 pm -
Sidney Crosby
Is on the ice for warmups.
Dec 6, 2022 - 6:29 pm -
Sidney Crosby
Was absent from today's practice due to illness. He is considered a game-time decision for Tuesday's game against the Columbus Blue Jackets.
Dec 5, 2022 - 12:39 pm -
Sidney Crosby
Will play in tonight's game against the New York Rangers.
May 15, 2022 - 6:54 pm
Feature
-
Trending
Finding Value at the RW Position
Replies 0
Basic Stats
| Season | Team | GP | G | A | P | +/- | PIM | S | S/GP | SH% | PPP | H | BS | FW | FO% | TOI | EVTOI | PPTOI | PKTOI |
|---|---|---|---|---|---|---|---|---|---|---|---|---|---|---|---|---|---|---|---|
| 23-24 | PIT | 82 | 42 | 52 | 94 | 7 | 40 | 278 | 3.4 | 15.1 | 23 | 101 | 37 | 1090 | 58.2 | 20.09 | 16.41 | 3.59 | 0.09 |
| 22-23 | PIT | 82 | 33 | 60 | 93 | 8 | 52 | 255 | 3.1 | 12.9 | 27 | 71 | 47 | 978 | 53.0 | 20.14 | 16.17 | 3.92 | 0.06 |
| 21-22 | PIT | 69 | 31 | 53 | 84 | 19 | 32 | 208 | 3 | 14.9 | 30 | 50 | 37 | 760 | 52.4 | 19.97 | 16.53 | 3.34 | 0.11 |
| 20-21 | PIT | 55 | 24 | 38 | 62 | 8 | 26 | 159 | 2.9 | 15.1 | 22 | 44 | 28 | 676 | 53.6 | 20.40 | 17.22 | 3.03 | 0.15 |
| 19-20 | PIT | 41 | 16 | 31 | 47 | -8 | 15 | 109 | 2.7 | 14.7 | 17 | 28 | 17 | 494 | 55.6 | 20.27 | 16.13 | 3.85 | 0.29 |
Enhanced Stats (5-on-5 unless denoted with *)
| Season | G/60 | A/60 | P/60 | IPP | ΔPEN/60 | 1A | 2A | EVS/60* | PPS/60* | SATF | SAT% | tEVSH% | tEVSV% | SHSV | ZS% |
|---|---|---|---|---|---|---|---|---|---|---|---|---|---|---|---|
| 23-24 | 1.11 | 1.64 | 2.75 | 77 | 0.33 | 24 | 10 | 9.3 | 13.1 | 1547 | 54.7 | 9.7 | 0.889 | 986 | 63.1 |
| 22-23 | 1.06 | 1.60 | 2.66 | 83 | 0.18 | 19 | 14 | 8.7 | 12.7 | 1462 | 54.4 | 9.0 | 0.924 | 1014 | 62.2 |
| 21-22 | 0.85 | 1.36 | 2.21 | 72 | -0.04 | 16 | 8 | 7.7 | 13.5 | 1162 | 54.2 | 8.5 | 0.940 | 1025 | 63.2 |
| 20-21 | 0.75 | 1.09 | 1.84 | 71 | 0.11 | 11 | 5 | 7.3 | 13.3 | 805 | 52.2 | 9.0 | 0.929 | 1019 | 62.1 |
| 19-20 | 0.88 | 1.75 | 2.63 | 91 | 0.36 | 13 | 5 | 7.8 | 7.6 | 646 | 53.3 | 8.2 | 0.903 | 985 | 64.8 |
Regression Meter
This meter measures whether or not a player's point production is being influenced by luck. Orange indicates the player has been lucky. Dark grey indicates the player has been unlucky.
Positional Data
| Season | Team | Left | Center | Right |
|---|---|---|---|---|
| 23-24 | PIT | 0 | 100 | 0 |
| 22-23 | PIT | 0 | 100 | 0 |
| 21-22 | PIT | 0 | 100 | 0 |
| 20-21 | PIT | 0 | 100 | 0 |
| 19-20 | PIT | 0 | 100 | 0 |
Most Common Linemates and Line Production
See also: Pittsburgh Penguins Line Combo Tool | Line Production Tool
| Team | F1 | F2 | F3 | GF | GA | GF% | SATF | SATA | SAT% | USATF | USATA | USAT% | SH% | SV% | SHSV | ZS% |
|---|---|---|---|---|---|---|---|---|---|---|---|---|---|---|---|---|
| PIT | GUENTZEL | CROSBY | RUST | 23 | 21 | 52.3 | 479 | 368 | 56.6 | 353 | 294 | 54.6 | 9.5 | 0.896 | 991 | 64.5 |
| PIT | GUENTZEL | CROSBY | RAKELL | 10 | 6 | 62.5 | 259 | 189 | 57.8 | 172 | 138 | 55.5 | 8.3 | 0.939 | 1022 | 71.7 |
| PIT | OCONNOR | CROSBY | RUST | 13 | 14 | 48.1 | 231 | 218 | 51.4 | 177 | 157 | 53.0 | 11.1 | 0.865 | 976 | 60.5 |
Most Recent 10 Games
| OPP | G | A | P | +/- | PIM | SOG | SH% | H | BS | FW | FL | FO% | TOI | EVTOI | PPTOI | PKTOI | ID |
|---|---|---|---|---|---|---|---|---|---|---|---|---|---|---|---|---|---|
| NYI | 0 | 2 | 2 | -1 | 0 | 3 | 0 | 3 | 0 | 12 | 10 | 55 | 19:47 | 17:36 | 02:11 | 00:00 | 21303 |
| NSH | 1 | 1 | 2 | -1 | 0 | 7 | 14.3 | 0 | 0 | 18 | 5 | 78 | 20:53 | 15:11 | 05:40 | 00:02 | 21289 |
| BOS | 0 | 1 | 1 | -1 | 0 | 1 | 0 | 4 | 0 | 8 | 12 | 40 | 19:48 | 17:52 | 01:44 | 00:12 | 21279 |
| DET | 1 | 2 | 3 | 0 | 2 | 5 | 20 | 2 | 0 | 6 | 14 | 30 | 19:35 | 17:29 | 02:02 | 00:04 | 21258 |
| TOR | 0 | 1 | 1 | 1 | 0 | 1 | 0 | 2 | 1 | 10 | 12 | 45 | 21:15 | 15:11 | 06:04 | 00:00 | 21237 |
| TBL | 1 | 0 | 1 | 1 | 0 | 2 | 50 | 2 | 0 | 16 | 8 | 67 | 18:33 | 15:43 | 02:40 | 00:10 | 21217 |
| WSH | 0 | 0 | 0 | 1 | 0 | 0 | 0 | 2 | 1 | 8 | 8 | 50 | 18:50 | 16:42 | 02:07 | 00:01 | 21206 |
| NJD | 2 | 0 | 2 | -1 | 0 | 2 | 100 | 1 | 0 | 10 | 11 | 48 | 16:09 | 13:42 | 02:27 | 00:00 | 21191 |
| NYR | 2 | 1 | 3 | 3 | 0 | 3 | 66.7 | 1 | 1 | 13 | 10 | 57 | 19:39 | 16:23 | 03:02 | 00:14 | 21182 |
| CBJ | 0 | 1 | 1 | -1 | 2 | 4 | 0 | 0 | 0 | 11 | 9 | 55 | 22:31 | 20:34 | 01:57 | 00:00 | 21171 |
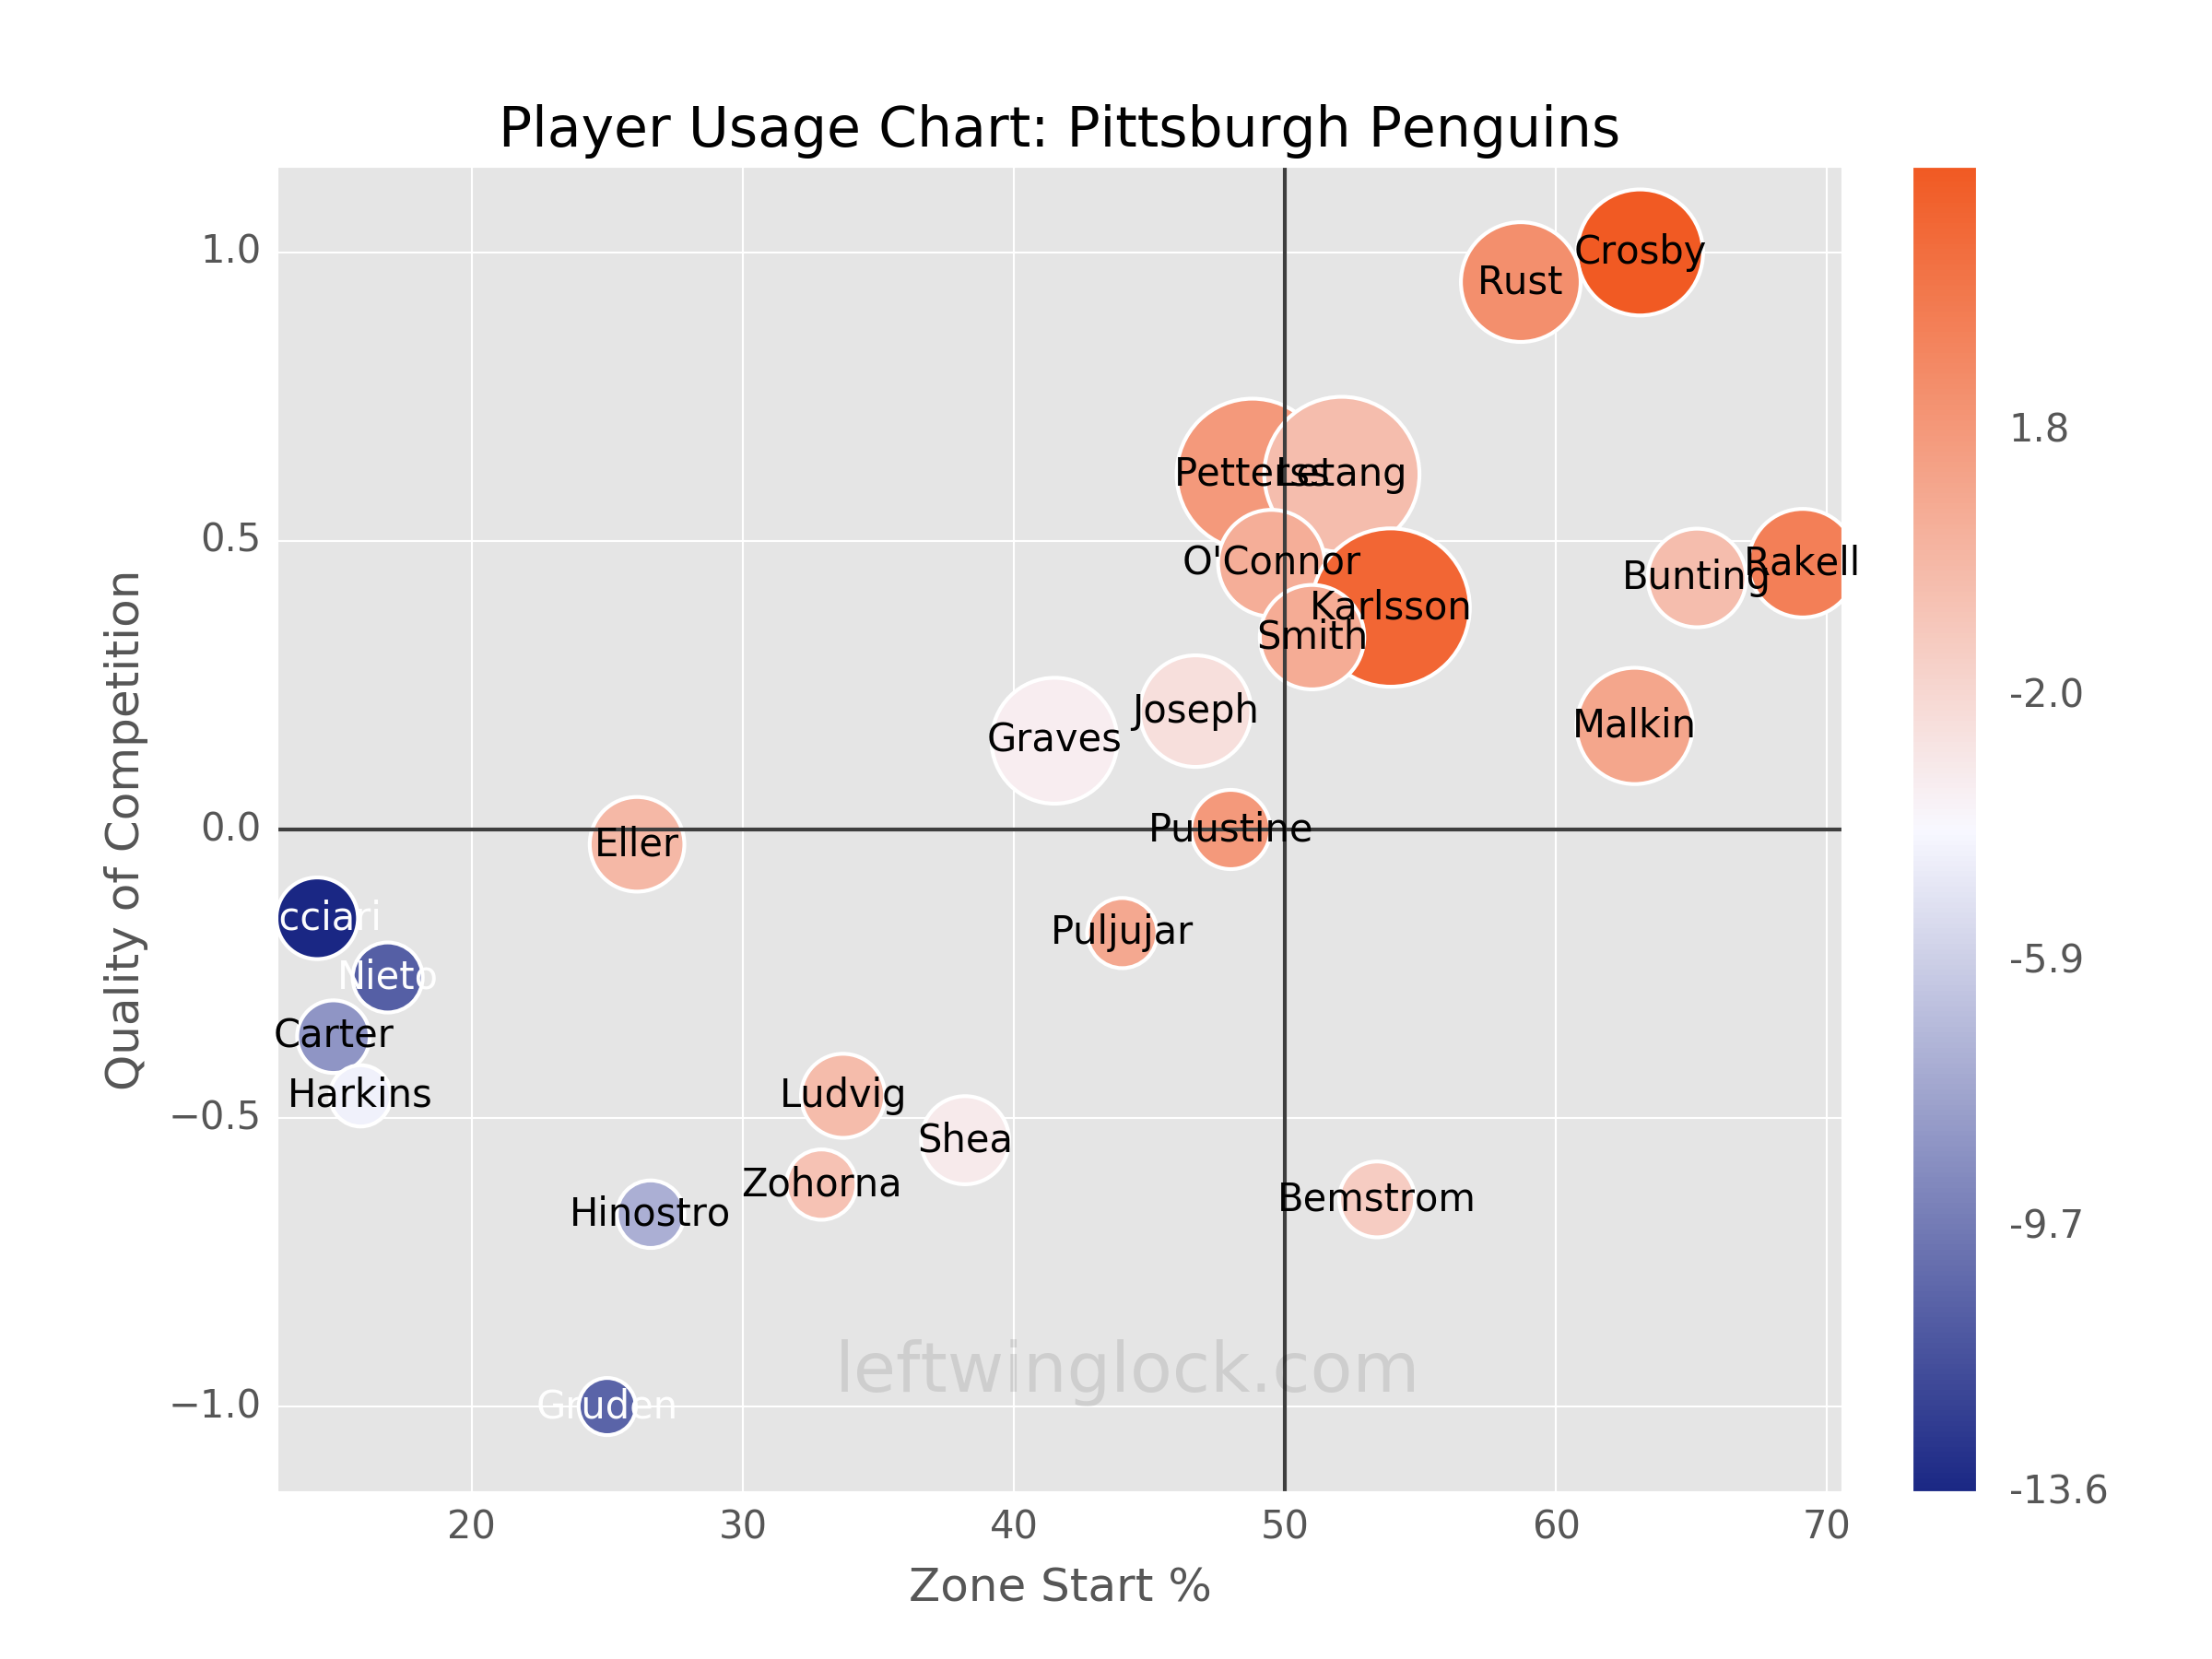
Player Usage Chart / Possession and Luck Chart