Travis Sanheim
Explore projections, stats, news, player usage charts, and line combinations for members of the Philadelphia Flyers
-
Defenseman Leaders
2023 - 2024
Name G A Pts Quinn
Hughes17 75 92 Cale Makar 21 69 90 Roman Josi 23 62 85 Evan Bouchard 18 64 82 Victor Hedman 13 63 76 Adam Fox 17 56 73 Noah Dobson 10 60 70 Josh Morrissey 10 59 69 Mike Matheson 11 51 62 Rasmus Dahlin 20 39 59 Morgan Rielly 7 51 58 Zach Werenski 11 46 57 -
Player Card

Travis Sanheim
Philadelphia Flyers2023 - 2024- G 10
- A 34
- PTS 44
- +/- -20
- PIM 48
- PPP 5
- SH% 6.9
- L 13%
- C 0%
- R 87%
-
Philadelphia Flyers Leaders
2023 - 2024
Name PPG PPA PPP Morgan
Frost3 8 11 Travis Konecny 4 5 9 Egor Zamula 2 7 9 Owen Tippett 5 3 8 Tyson Foerster 4 4 8 Sean Couturier 3 4 7 Joel Farabee 2 5 7 Ryan Johansen 4 2 6 Cam Atkinson 2 4 6 Cam York 0 6 6 Bobby Brink 3 2 5 Scott Laughton 1 4 5
News
-
Travis Sanheim
Will miss tonight's game against the Detroit Red Wings due to illness.
Dec 16, 2023 - 6:30 pm -
Travis Sanheim
Is not expected to be in the lineup for today's game.
Feb 20, 2023 - 3:51 pm -
Travis Sanheim
Has agreed to an eight-year contract extension.
Oct 13, 2022 - 5:41 pm -
Travis Sanheim
Is out of the COVID-related absence protocol.
Jan 10, 2022 - 10:48 am
Feature
-
Trending
Buy-Low and Sell-High: Skaters
Replies 0
Basic Stats
| Season | Team | GP | G | A | P | +/- | PIM | S | S/GP | SH% | PPP | H | BS | FW | FO% | TOI | EVTOI | PPTOI | PKTOI |
|---|---|---|---|---|---|---|---|---|---|---|---|---|---|---|---|---|---|---|---|
| 23-24 | PHI | 81 | 10 | 34 | 44 | -20 | 48 | 146 | 1.8 | 6.9 | 5 | 94 | 149 | 0 | 0.0 | 23.81 | 19.58 | 1.53 | 2.70 |
| 22-23 | PHI | 81 | 7 | 16 | 23 | -5 | 40 | 111 | 1.4 | 6.3 | 1 | 61 | 137 | 0 | 0.0 | 20.40 | 18.04 | 0.54 | 1.82 |
| 21-22 | PHI | 80 | 7 | 24 | 31 | 9 | 34 | 123 | 1.5 | 5.7 | 0 | 64 | 142 | 0 | 0.0 | 22.97 | 20.15 | 0.68 | 2.14 |
| 20-21 | PHI | 55 | 3 | 12 | 15 | -22 | 23 | 100 | 1.8 | 3.0 | 0 | 48 | 73 | 0 | 0.0 | 21.89 | 19.22 | 0.55 | 2.12 |
| 19-20 | PHI | 69 | 8 | 17 | 25 | 4 | 32 | 110 | 1.6 | 7.3 | 4 | 41 | 79 | 0 | 0.0 | 20.15 | 17.44 | 0.91 | 1.81 |
Enhanced Stats (5-on-5 unless denoted with *)
| Season | G/60 | A/60 | P/60 | IPP | ΔPEN/60 | 1A | 2A | EVS/60* | PPS/60* | SATF | SAT% | tEVSH% | tEVSV% | SHSV | ZS% |
|---|---|---|---|---|---|---|---|---|---|---|---|---|---|---|---|
| 23-24 | 0.36 | 0.89 | 1.25 | 54 | -0.22 | 11 | 11 | 4.1 | 9.7 | 1467 | 50.8 | 7.7 | 0.881 | 958 | 53.3 |
| 22-23 | 0.26 | 0.52 | 0.78 | 42 | -0.15 | 9 | 3 | 4.1 | 5.5 | 1240 | 46.9 | 6.9 | 0.931 | 1000 | 46.9 |
| 21-22 | 0.23 | 0.82 | 1.06 | 35 | -0.10 | 11 | 10 | 4.1 | 2.2 | 1407 | 47.3 | 9.6 | 0.923 | 1019 | 41.9 |
| 20-21 | 0.12 | 0.66 | 0.78 | 35 | 0.00 | 5 | 6 | 5.1 | 5.9 | 947 | 53.7 | 6.4 | 0.884 | 948 | 47.8 |
| 19-20 | 0.32 | 0.69 | 1.01 | 36 | -0.09 | 7 | 6 | 4.6 | 9.6 | 1096 | 52.2 | 9.5 | 0.902 | 997 | 48.9 |
Regression Meter
This meter measures whether or not a player's point production is being influenced by luck. Orange indicates the player has been lucky. Dark grey indicates the player has been unlucky.
2A/60
tEVSH%
SH%
IPP
PPSH%
Positional Data
| Season | Team | Left | Center | Right |
|---|---|---|---|---|
| 23-24 | PHI | 13 | 0 | 87 |
| 22-23 | PHI | 96 | 0 | 4 |
| 21-22 | PHI | 83 | 0 | 17 |
| 20-21 | PHI | 86 | 0 | 14 |
| 19-20 | PHI | 100 | 0 | 0 |
Most Common Pairings and Pair Production
See also: Philadelphia Flyers Line Combos | Line Production Tool
| Team | D1 | D2 | GF | GA | GF% | SATF | SATA | SAT% | USATF | USATA | USAT% | SH% | SV% | SHSV | ZS% |
|---|---|---|---|---|---|---|---|---|---|---|---|---|---|---|---|
| PHI | TRAVIS SANHEIM | CAM YORK | 38 | 52 | 42.2 | 971 | 1041 | 48.3 | 706 | 684 | 50.8 | 7.9 | 0.888 | 967 | 51.0 |
| PHI | EGOR ZAMULA | TRAVIS SANHEIM | 5 | 4 | 55.6 | 115 | 82 | 58.4 | 81 | 57 | 58.7 | 8.6 | 0.897 | 984 | 56.5 |
| PHI | TRAVIS SANHEIM | JAMIE DRYSDALE | 1 | 9 | 10.0 | 95 | 84 | 53.1 | 65 | 61 | 51.6 | 2.6 | 0.757 | 782 | 66.7 |
Most Recent 10 Games
| OPP | G | A | P | +/- | PIM | SOG | SH% | H | BS | FW | FL | FO% | TOI | EVTOI | PPTOI | PKTOI | ID |
|---|---|---|---|---|---|---|---|---|---|---|---|---|---|---|---|---|---|
| WSH | 0 | 0 | 0 | -1 | 0 | 2 | 0 | 3 | 3 | 0 | 0 | 0 | 24:49 | 24:36 | 00:13 | 00:00 | 21299 |
| NJD | 0 | 0 | 0 | 0 | 0 | 1 | 0 | 1 | 3 | 0 | 0 | 0 | 25:23 | 23:56 | 00:03 | 01:24 | 21274 |
| NYR | 0 | 1 | 1 | 3 | 2 | 2 | 0 | 3 | 1 | 0 | 0 | 0 | 25:38 | 21:12 | 00:43 | 03:43 | 21257 |
| MTL | 0 | 0 | 0 | 0 | 0 | 4 | 0 | 1 | 2 | 0 | 0 | 0 | 21:30 | 21:27 | 00:03 | 00:00 | 21242 |
| CBJ | 0 | 0 | 0 | -2 | 0 | 3 | 0 | 0 | 1 | 0 | 0 | 0 | 22:01 | 19:29 | 00:05 | 02:27 | 21222 |
| BUF | 0 | 1 | 1 | -1 | 0 | 1 | 0 | 1 | 0 | 0 | 0 | 0 | 21:09 | 21:09 | 00:00 | 00:00 | 21211 |
| NYI | 1 | 0 | 1 | 1 | 0 | 1 | 100 | 2 | 1 | 0 | 0 | 0 | 25:43 | 23:18 | 00:54 | 01:31 | 21183 |
| CHI | 0 | 0 | 0 | -1 | 0 | 2 | 0 | 2 | 0 | 0 | 0 | 0 | 21:59 | 19:46 | 00:08 | 02:05 | 21173 |
| MTL | 0 | 0 | 0 | 0 | 2 | 2 | 0 | 0 | 0 | 0 | 0 | 0 | 21:58 | 19:53 | 00:38 | 01:27 | 21152 |
| NYR | 0 | 1 | 1 | 0 | 0 | 1 | 0 | 0 | 3 | 0 | 0 | 0 | 25:53 | 25:03 | 00:02 | 00:48 | 21137 |
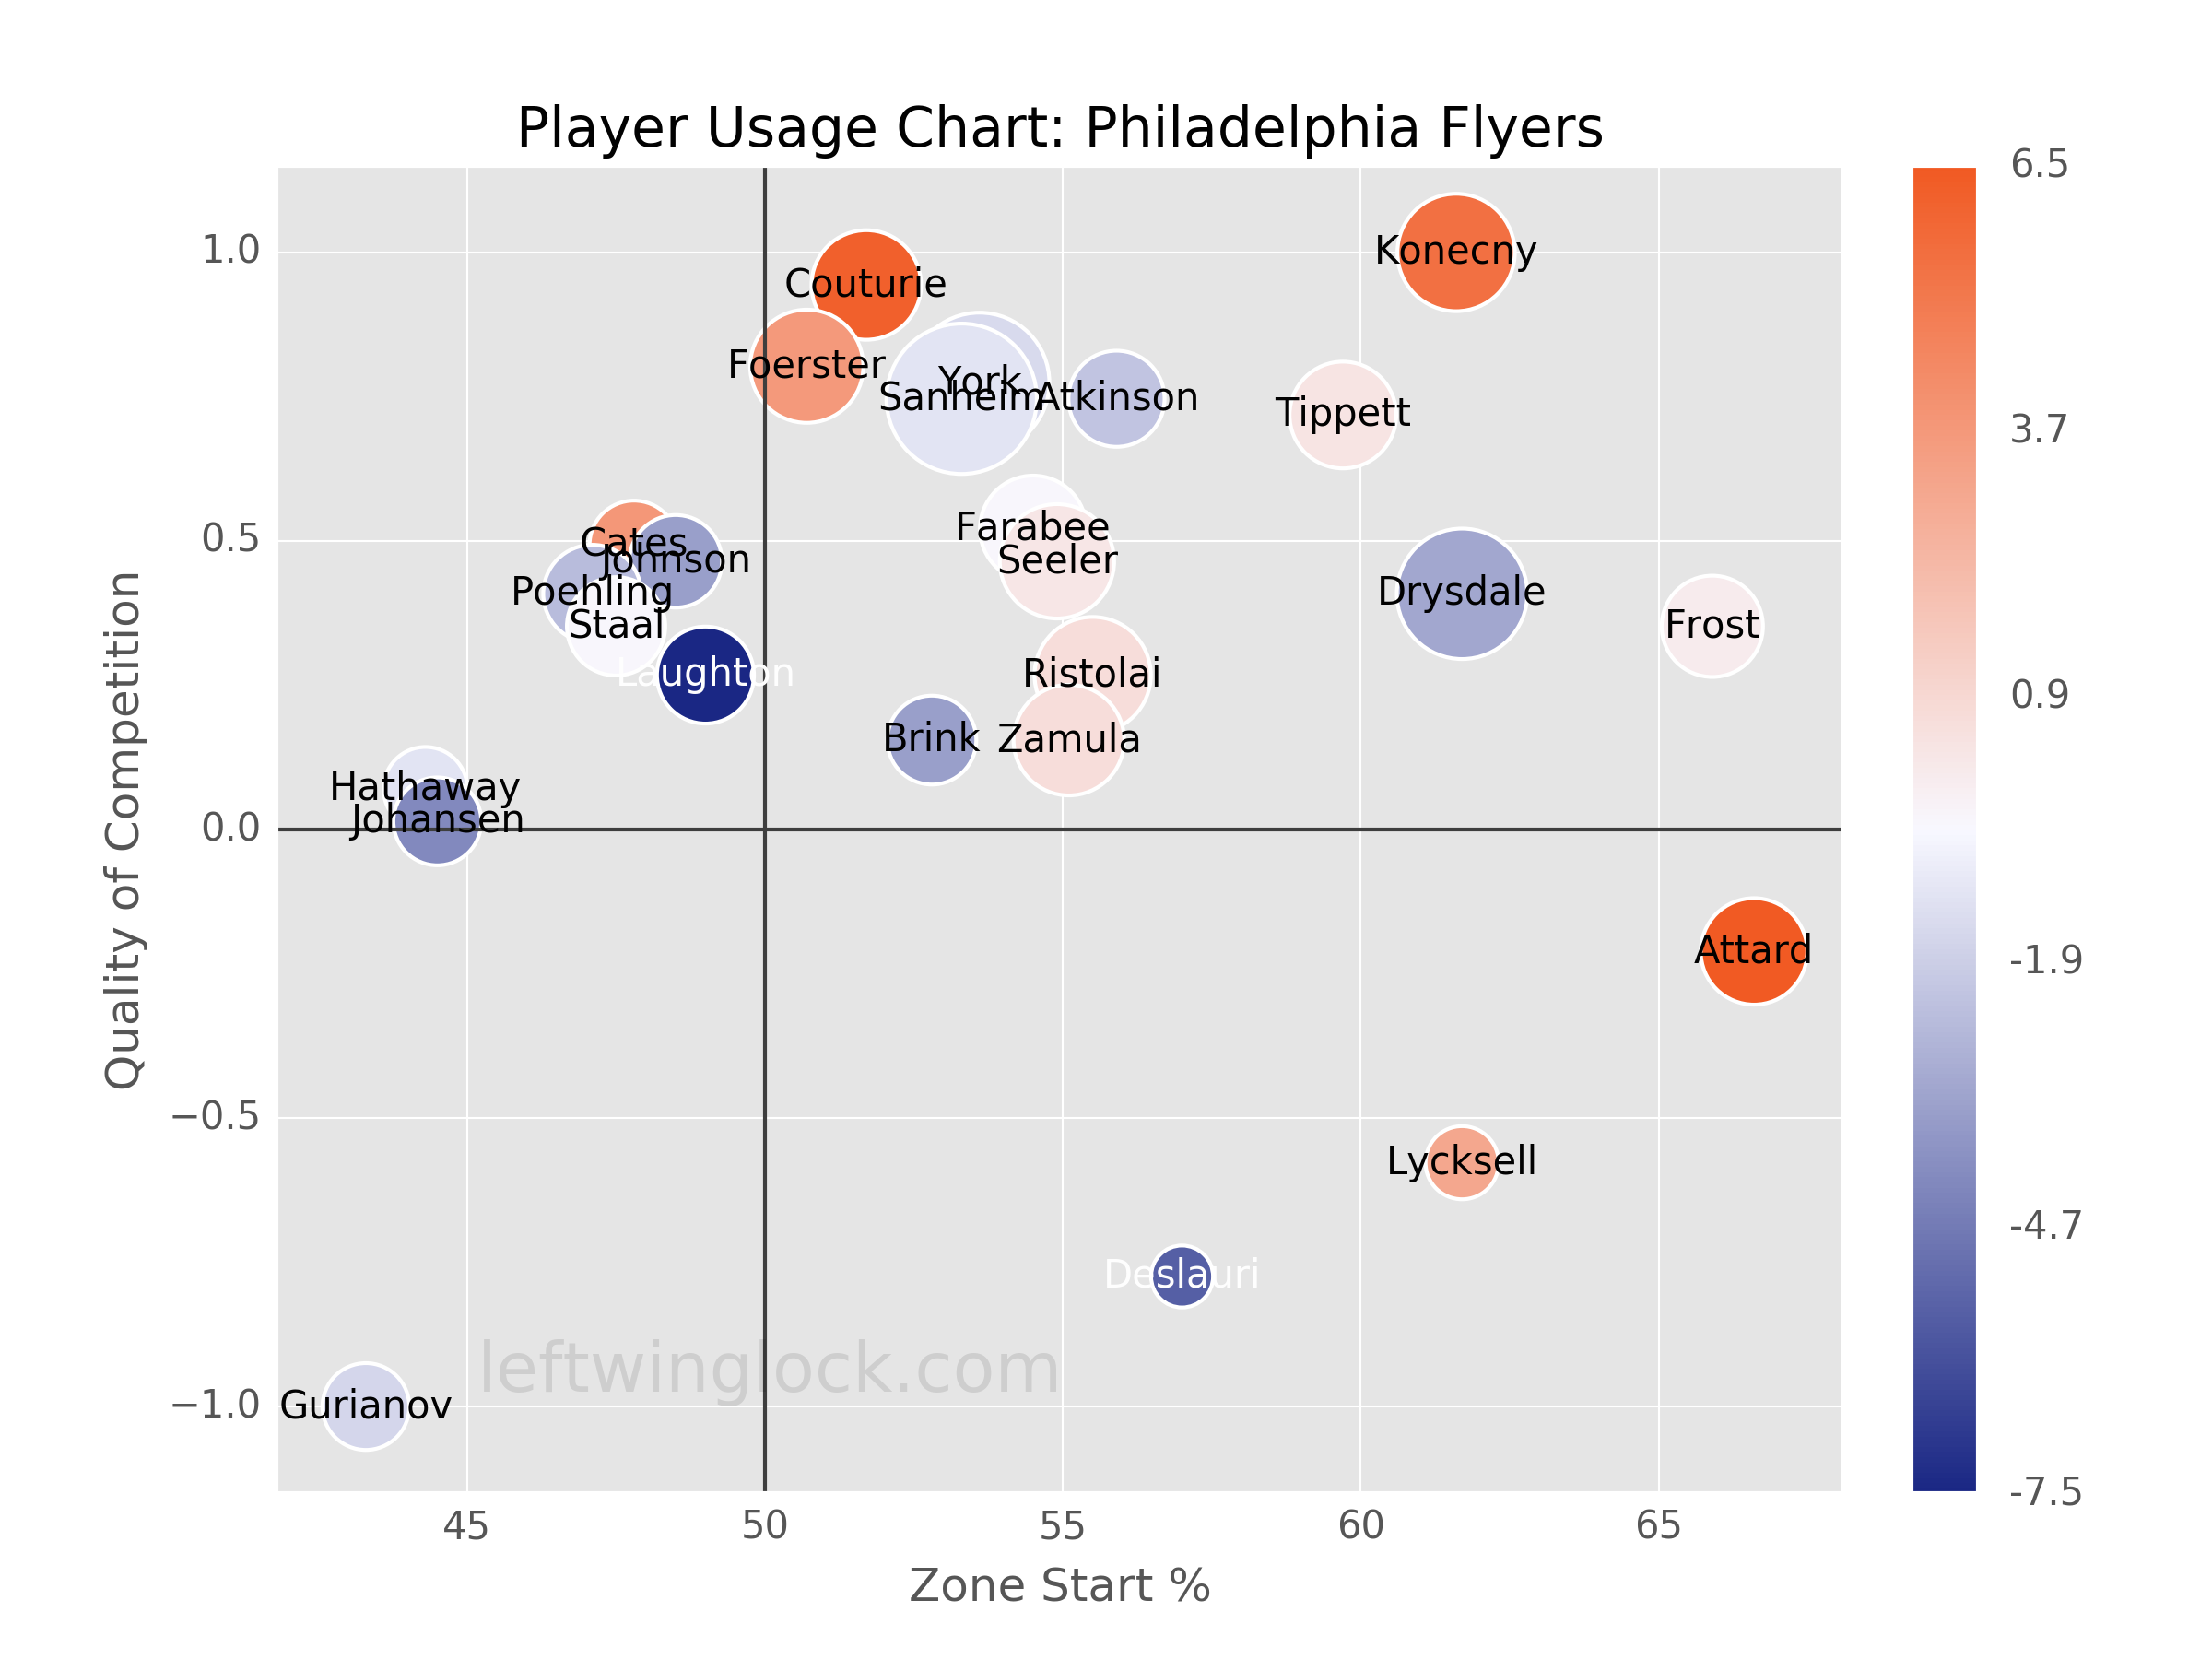
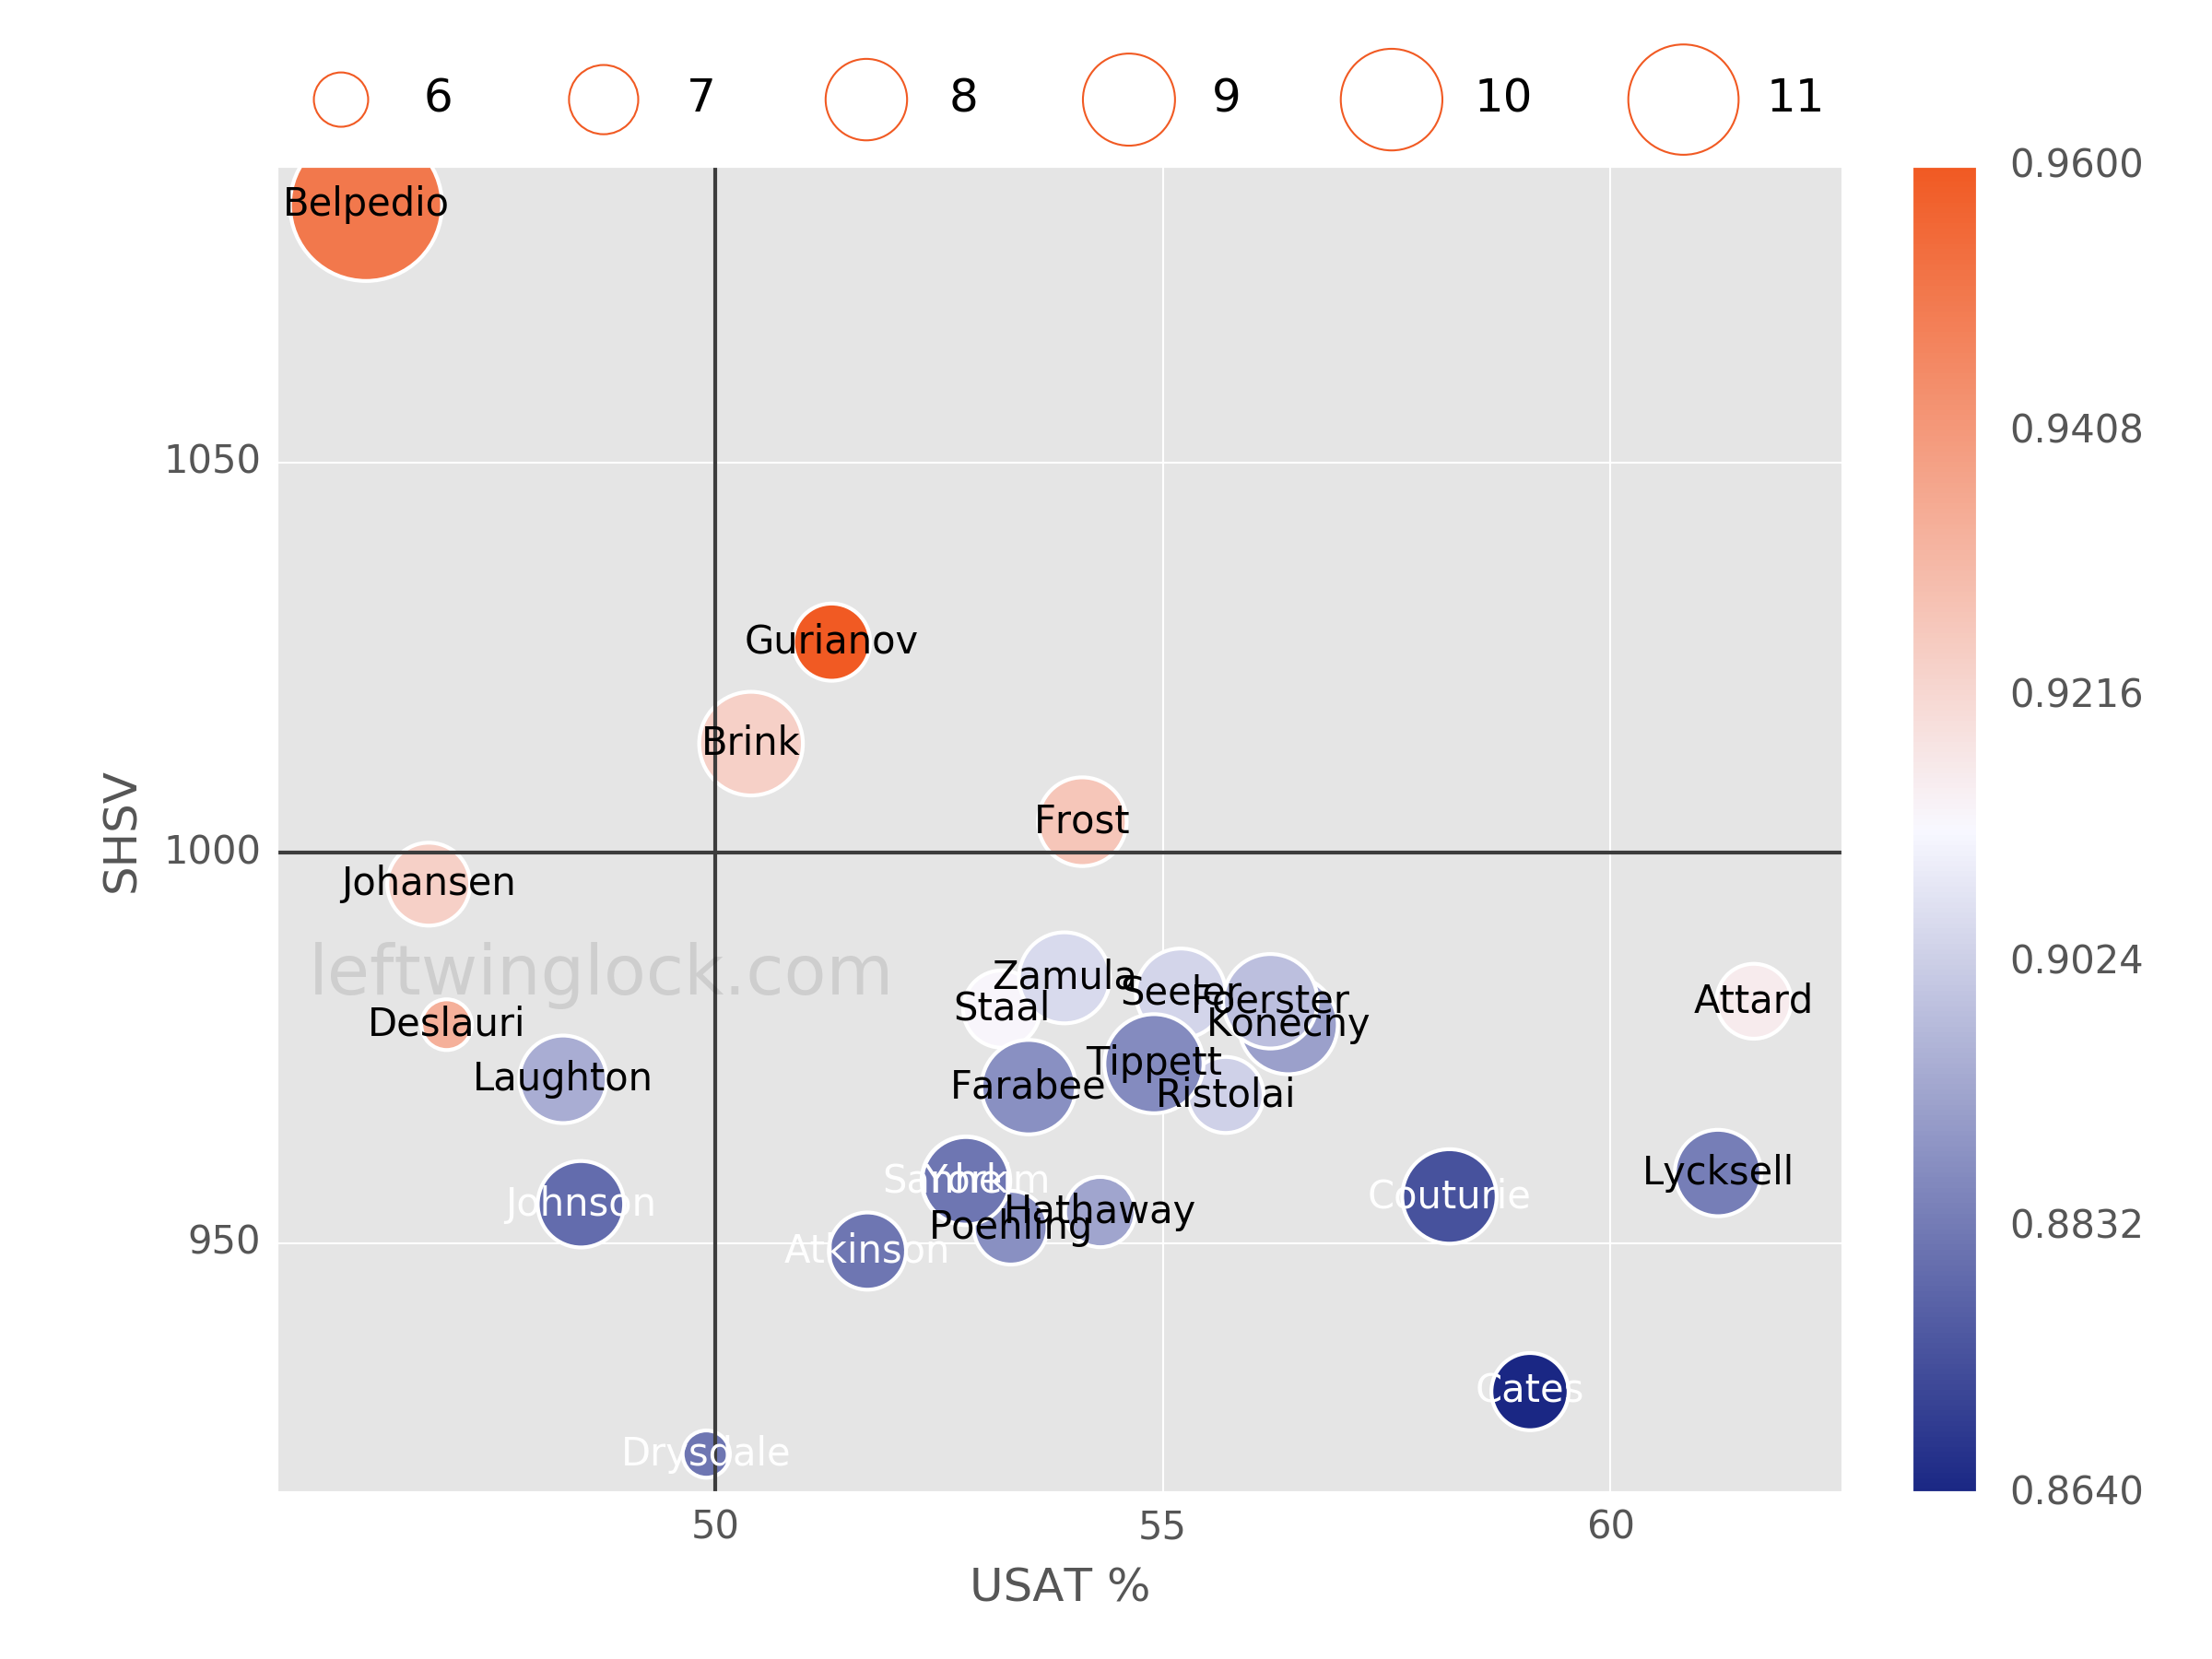
Player Usage Chart / Possession and Luck Chart