COLTON SISSONS
Explore projections, stats, news, player usage charts, and line combinations for members of the Nashville Predators
-
Center Leaders
2023 - 2024
Name G A Pts Nathan
MacKinnon51 89 140 Connor McDavid 32 100 132 Auston Matthews 69 38 107 Leon Draisaitl 41 65 106 J.T. Miller 37 66 103 Sam Reinhart 57 37 94 Sidney Crosby 42 52 94 Brayden Point 46 44 90 Sebastian Aho 36 53 89 Elias Pettersson 34 55 89 Robert Thomas 26 60 86 Steven Stamkos 40 41 81 -
Player Card

COLTON SISSONS
Nashville Predators2023 - 2024- G 15
- A 20
- PTS 35
- +/- -6
- PIM 38
- PPP 7
- SH% 11.5
- L 4%
- C 85%
- R 11%
-
Nashville Predators Leaders
2023 - 2024
Name G A Pts Filip
Forsberg48 46 94 Roman Josi 23 62 85 Gustav Nyquist 23 52 75 Ryan O'Reilly 26 43 69 Tommy Novak 18 27 45 Luke Evangelista 16 23 39 Colton Sissons 15 20 35 Jason Zucker 14 18 32 Ryan McDonagh 3 29 32 Kiefer Sherwood 10 17 27 Cole Smith 9 14 23 Michael McCarron 12 10 22
News
-
Colton Sissons
Is not expected to be in the lineup for today's game.
Apr 13, 2024 - 7:30 pm -
Colton Sissons
Has been fined $2,500.00 for spearing Josh Norris of the Ottawa Senators.
Apr 8, 2022 - 1:26 pm -
Colton Sissons
Is expected to be in the lineup for today's game.
Jan 1, 2022 - 1:31 pm -
Colton Sissons
Is out of the COVID-related absence protocol.
Jan 1, 2022 - 12:32 pm
Feature
-
Trending
Buy-Low and Sell-High: Skaters
Replies 0
Basic Stats
| Season | Team | GP | G | A | P | +/- | PIM | S | S/GP | SH% | PPP | H | BS | FW | FO% | TOI | EVTOI | PPTOI | PKTOI |
|---|---|---|---|---|---|---|---|---|---|---|---|---|---|---|---|---|---|---|---|
| 23-24 | NSH | 81 | 15 | 20 | 35 | -6 | 38 | 131 | 1.6 | 11.5 | 7 | 137 | 57 | 618 | 52.6 | 16.57 | 12.45 | 2.06 | 2.07 |
| 22-23 | NSH | 82 | 12 | 18 | 30 | -4 | 20 | 87 | 1.1 | 13.8 | 2 | 164 | 72 | 593 | 53.5 | 15.83 | 12.30 | 0.67 | 2.85 |
| 21-22 | NSH | 79 | 7 | 21 | 28 | 2 | 30 | 87 | 1.1 | 8.1 | 4 | 188 | 44 | 719 | 55.7 | 16.16 | 12.81 | 0.43 | 2.92 |
| 20-21 | NSH | 54 | 8 | 7 | 15 | 2 | 18 | 58 | 1.1 | 13.8 | 0 | 74 | 27 | 319 | 54.0 | 14.35 | 11.85 | 0.16 | 2.35 |
| 19-20 | NSH | 57 | 9 | 6 | 15 | -2 | 20 | 52 | 0.9 | 17.3 | 0 | 84 | 41 | 283 | 51.3 | 14.33 | 11.77 | 0.21 | 2.35 |
Enhanced Stats (5-on-5 unless denoted with *)
| Season | G/60 | A/60 | P/60 | IPP | ΔPEN/60 | 1A | 2A | EVS/60* | PPS/60* | SATF | SAT% | tEVSH% | tEVSV% | SHSV | ZS% |
|---|---|---|---|---|---|---|---|---|---|---|---|---|---|---|---|
| 23-24 | 0.44 | 0.83 | 1.27 | 60 | -0.09 | 11 | 2 | 5.1 | 12.6 | 897 | 48.9 | 7.2 | 0.924 | 996 | 36.8 |
| 22-23 | 0.56 | 0.93 | 1.49 | 69 | 0.42 | 4 | 11 | 4.4 | 5.4 | 848 | 44.9 | 7.9 | 0.922 | 1001 | 34.8 |
| 21-22 | 0.31 | 0.87 | 1.18 | 60 | -0.38 | 5 | 9 | 4.4 | 10.5 | 833 | 49.4 | 7.3 | 0.924 | 997 | 36.2 |
| 20-21 | 0.69 | 0.49 | 1.19 | 54 | -0.31 | 2 | 3 | 5.0 | 7.0 | 468 | 46.5 | 9.1 | 0.932 | 1023 | 28.4 |
| 19-20 | 0.73 | 0.45 | 1.18 | 56 | -0.37 | 5 | 0 | 4.0 | 4.9 | 520 | 45.5 | 8.3 | 0.911 | 994 | 25.4 |
Regression Meter
This meter measures whether or not a player's point production is being influenced by luck. Orange indicates the player has been lucky. Dark grey indicates the player has been unlucky.
Positional Data
| Season | Team | Left | Center | Right |
|---|---|---|---|---|
| 23-24 | NSH | 4 | 85 | 11 |
| 22-23 | NSH | 0 | 68 | 32 |
| 21-22 | NSH | 0 | 100 | 0 |
| 20-21 | NSH | 4 | 87 | 9 |
| 19-20 | NSH | 28 | 56 | 16 |
Most Common Linemates and Line Production
See also: Nashville Predators Line Combo Tool | Line Production Tool
| Team | F1 | F2 | F3 | GF | GA | GF% | SATF | SATA | SAT% | USATF | USATA | USAT% | SH% | SV% | SHSV | ZS% |
|---|---|---|---|---|---|---|---|---|---|---|---|---|---|---|---|---|
| NSH | SMITH | SISSONS | TRENIN | 4 | 7 | 36.4 | 114 | 155 | 42.4 | 84 | 119 | 41.4 | 7.4 | 0.924 | 998 | 19.5 |
| NSH | TRENIN | GLASS | SISSONS | 5 | 1 | 83.3 | 95 | 98 | 49.2 | 60 | 69 | 46.5 | 12.8 | 0.980 | 1108 | 37.5 |
| NSH | BEAUVILLIER | SISSONS | ZUCKER | 2 | 6 | 25.0 | 90 | 84 | 51.7 | 70 | 61 | 53.4 | 3.6 | 0.854 | 890 | 59.5 |
Next Opponent (With Line Matching)
Vancouver Canucks on April 28, 2024 | See also: Line Matching Tool
These two teams last played on Tuesday, April 23, 2024. These were the lines used most frequently against COLTON SISSONS.| FORWARD 1 | FORWARD 2 | FORWARD 3 | Frequency |
|---|---|---|---|
| NILS HOGLANDER | ELIAS PETTERSSON | ILYA MIKHEYEV | 39.47% |
| PHILLIP DI GIUSEPPE | SAM LAFFERTY | TEDDY BLUEGER | 31.58% |
| BROCK BOESER | JT MILLER | PIUS SUTER | 28.95% |
Most Recent 10 Games
| OPP | G | A | P | +/- | PIM | SOG | SH% | H | BS | FW | FL | FO% | TOI | EVTOI | PPTOI | PKTOI | ID |
|---|---|---|---|---|---|---|---|---|---|---|---|---|---|---|---|---|---|
| VAN | 1 | 0 | 1 | 1 | 2 | 2 | 50 | 2 | 4 | 4 | 10 | 29 | 17:52 | 11:12 | 03:34 | 03:06 | 30172 |
| VAN | 0 | 0 | 0 | 1 | 2 | 3 | 0 | 3 | 0 | 6 | 6 | 50 | 16:10 | 12:51 | 01:56 | 01:23 | 30171 |
| PIT | 0 | 0 | 0 | 1 | 2 | 4 | 0 | 0 | 0 | 3 | 10 | 23 | 15:44 | 12:07 | 00:24 | 03:13 | 21289 |
| CHI | 0 | 0 | 0 | 1 | 2 | 1 | 0 | 1 | 0 | 8 | 2 | 80 | 13:45 | 12:03 | 00:13 | 01:29 | 21266 |
| WPG | 0 | 0 | 0 | -1 | 0 | 1 | 0 | 1 | 0 | 8 | 7 | 53 | 13:54 | 09:17 | 02:07 | 02:30 | 21247 |
| NJD | 0 | 0 | 0 | -1 | 2 | 0 | 0 | 1 | 1 | 8 | 5 | 62 | 12:40 | 10:36 | 01:00 | 01:04 | 21233 |
| NYI | 0 | 0 | 0 | -1 | 0 | 1 | 0 | 1 | 0 | 5 | 7 | 42 | 15:29 | 13:06 | 01:32 | 00:51 | 21225 |
| STL | 0 | 0 | 0 | 0 | 2 | 2 | 0 | 1 | 2 | 7 | 5 | 58 | 14:29 | 11:44 | 00:00 | 02:45 | 21208 |
| BOS | 0 | 0 | 0 | -2 | 0 | 1 | 0 | 2 | 0 | 6 | 4 | 60 | 15:30 | 10:57 | 02:58 | 01:35 | 21194 |
| COL | 0 | 0 | 0 | -1 | 2 | 2 | 0 | 2 | 1 | 5 | 5 | 50 | 15:21 | 08:20 | 04:01 | 03:00 | 21169 |
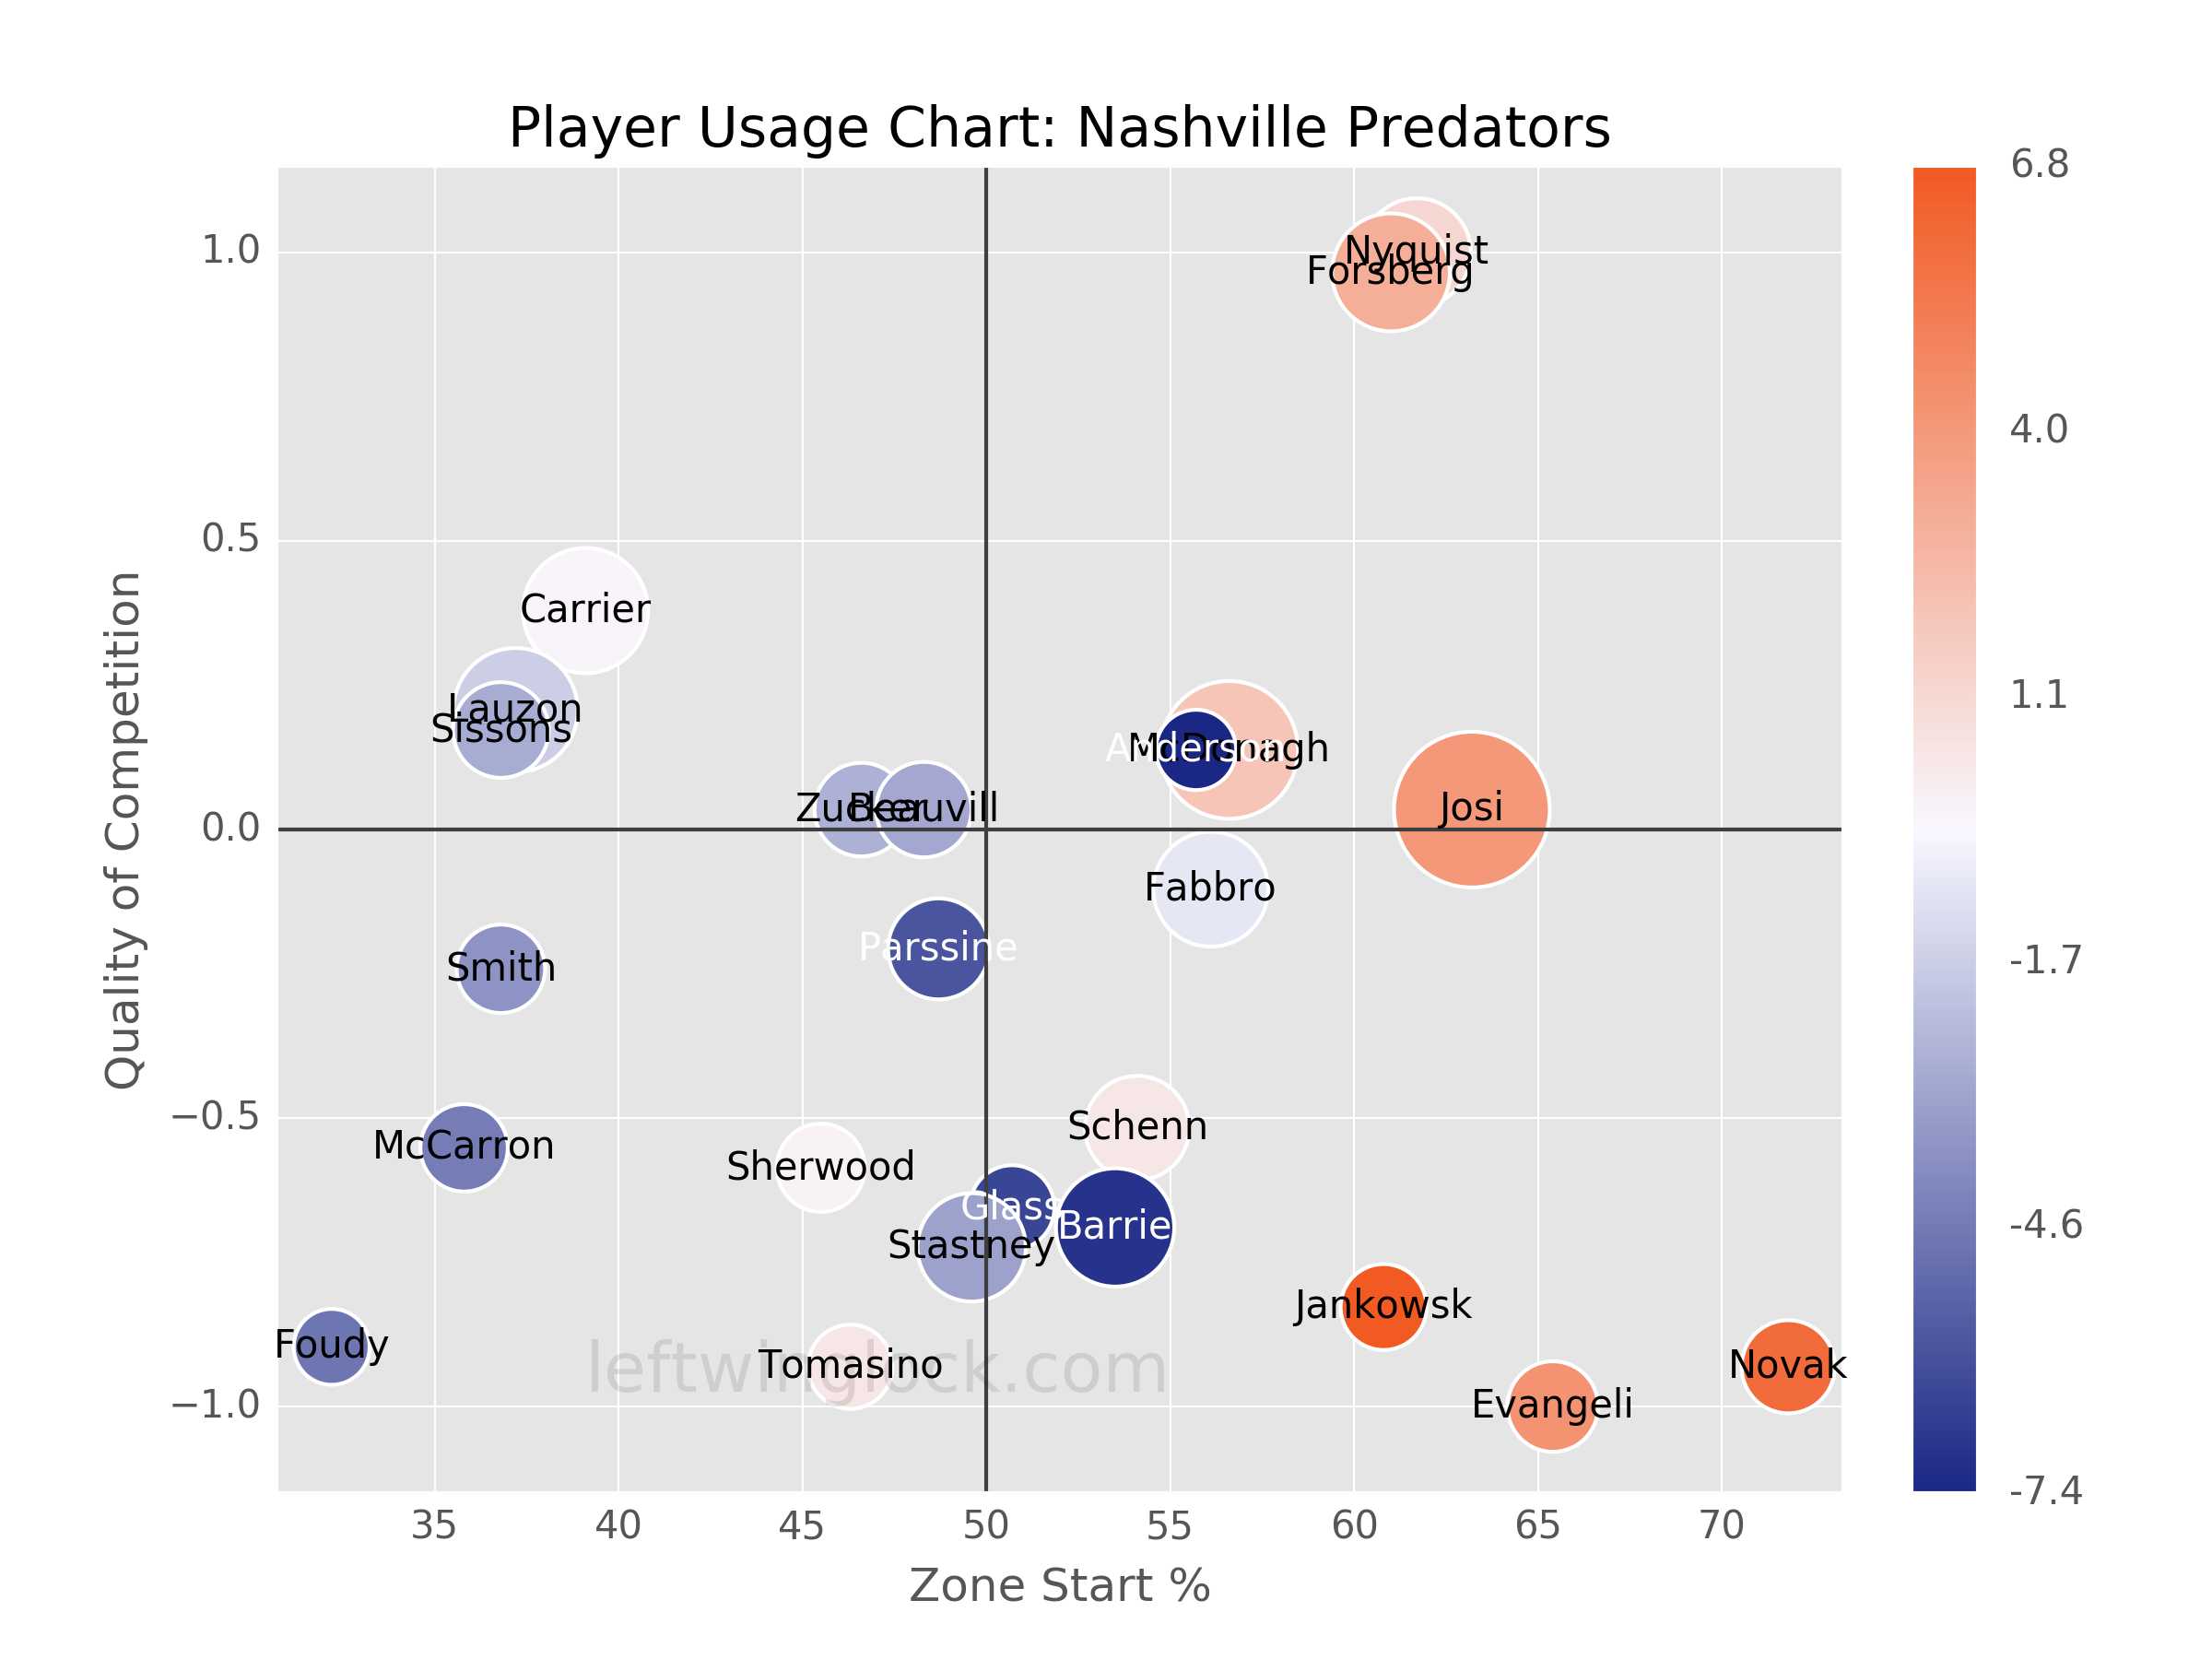
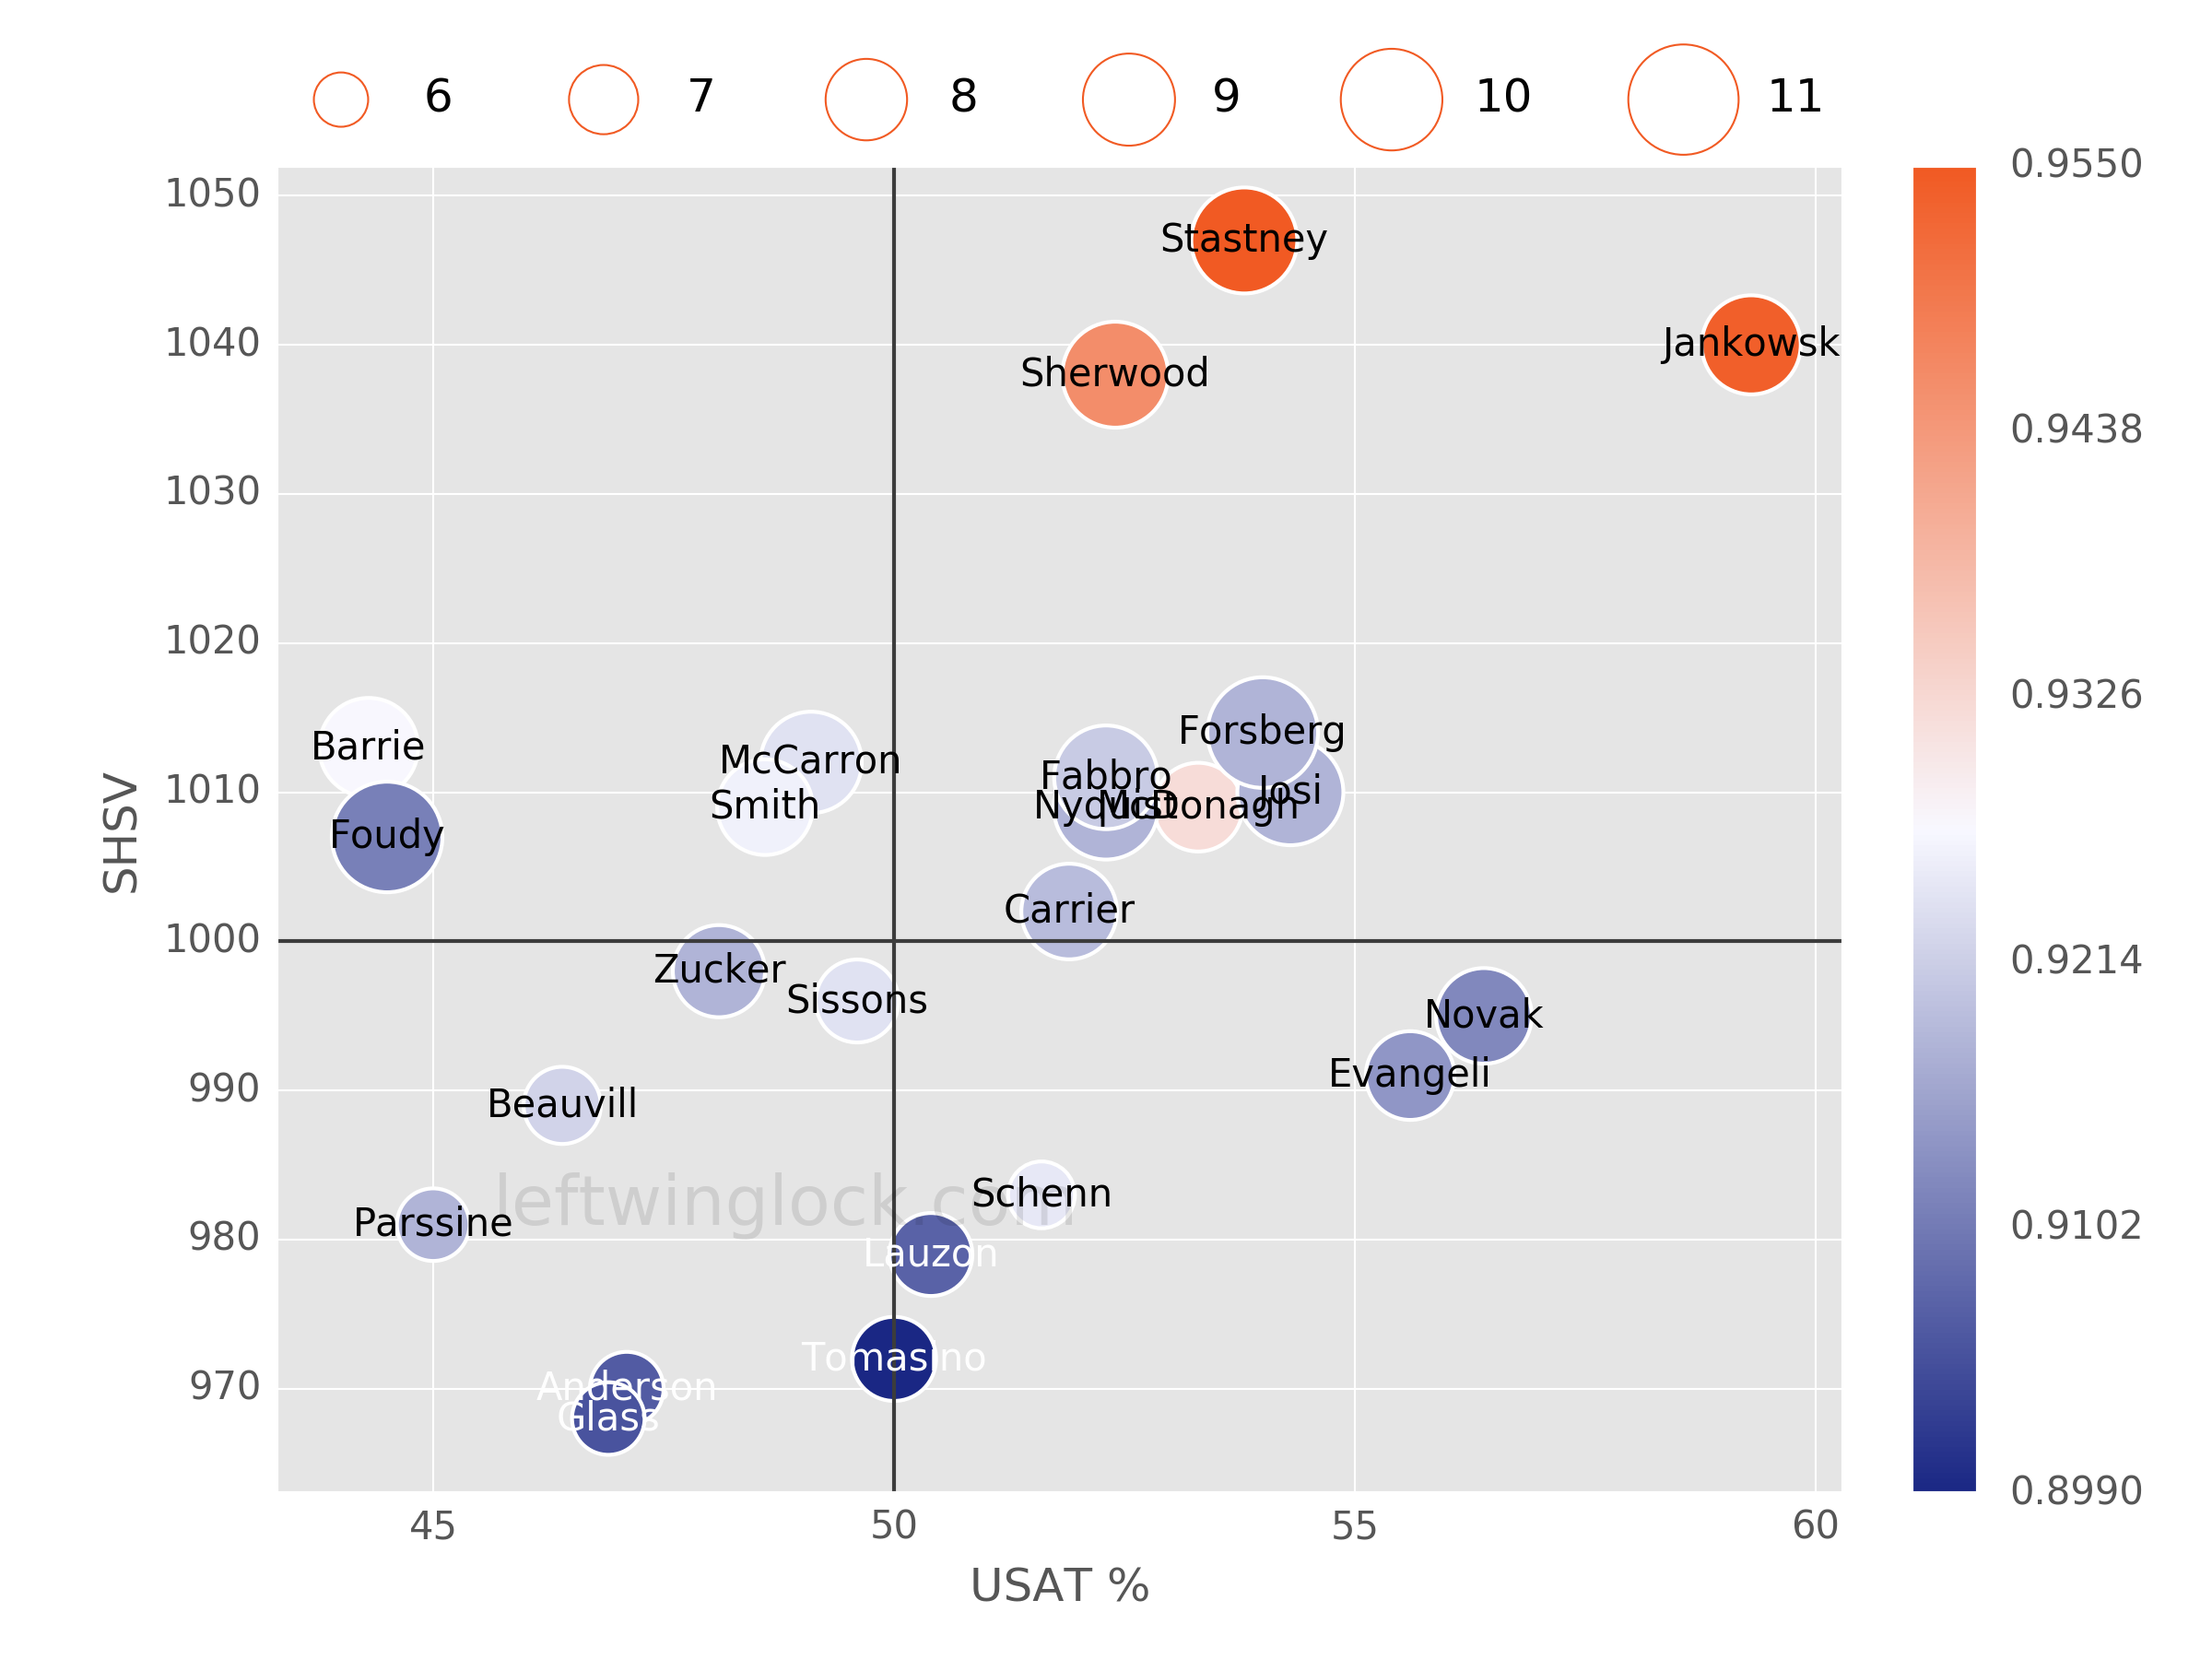
Player Usage Chart / Possession and Luck Chart