Eric Robinson
Explore projections, stats, news, player usage charts, and line combinations for members of the Carolina Hurricanes
-
Left Wing Leaders
2023 - 2024
Name G A Pts Artemi
Panarin49 71 120 Kirill Kaprizov 46 50 96 Filip Forsberg 48 46 94 Matthew Tkachuk 26 62 88 Jesper Bratt 27 56 83 Jason Robertson 29 51 80 Zach Hyman 54 23 77 Chris Kreider 39 36 75 Brandon Hagel 26 49 75 Brady Tkachuk 37 37 74 Kevin Fiala 29 44 73 Lucas Raymond 31 41 72 -
Player Card

Eric Robinson
Carolina Hurricanes2023 - 2024- G 3
- A 7
- PTS 10
- +/- -3
- PIM 19
- PPP 0
- SH% 4.9
- L 73%
- C 0%
- R 27%
-
Carolina Hurricanes Leaders
2023 - 2024
Name PPG PPA PPP Sebastian
Aho11 21 32 Jake Guentzel 5 17 22 Seth Jarvis 13 7 20 Brent Burns 4 16 20 Teuvo Teravainen 9 8 17 Andrei Svechnikov 5 12 17 Martin Necas 8 5 13 Brady Skjei 1 11 12 Stefan Noesen 3 8 11 Jack Drury 2 5 7 Evgeny Kuznetsov 1 6 7 Tony DeAngelo 2 4 6
News
-
Eric Robinson
Has signed a one-year contract with the Carolina Hurricanes.
Jul 1, 2024 - 2:22 pm -
Eric Robinson
Is expected to be in the lineup for today's game.
Feb 17, 2024 - 4:44 pm -
Eric Robinson
Is not expected to be in the lineup for today's game.
Feb 13, 2024 - 11:11 am -
Eric Robinson
Is expected to be in the lineup for today's game.
Jan 6, 2024 - 6:32 pm
Feature
-
Trending
Buy-Low and Sell-High: Skaters
Replies 0
Basic Stats
| Season | Team | GP | G | A | P | +/- | PIM | S | S/GP | SH% | PPP | H | BS | FW | FO% | TOI | EVTOI | PPTOI | PKTOI |
|---|---|---|---|---|---|---|---|---|---|---|---|---|---|---|---|---|---|---|---|
| 23-24 | BUF | 47 | 3 | 7 | 10 | -3 | 19 | 61 | 1.3 | 4.9 | 0 | 94 | 11 | 3 | 50.0 | 11.33 | 10.84 | 0.01 | 0.48 |
| 22-23 | CBJ | 72 | 12 | 12 | 24 | -21 | 6 | 98 | 1.4 | 12.2 | 0 | 124 | 32 | 3 | 20.0 | 13.95 | 11.73 | 0.01 | 2.21 |
| 21-22 | CBJ | 67 | 10 | 17 | 27 | -1 | 18 | 104 | 1.6 | 9.6 | 0 | 95 | 20 | 2 | 50.0 | 13.89 | 11.54 | 0.03 | 2.32 |
| 20-21 | CBJ | 56 | 8 | 10 | 18 | 6 | 4 | 75 | 1.3 | 10.7 | 0 | 94 | 16 | 3 | 50.0 | 12.39 | 11.37 | 0.04 | 0.99 |
| 19-20 | CBJ | 50 | 7 | 5 | 12 | 10 | 12 | 69 | 1.4 | 10.1 | 0 | 79 | 15 | 4 | 36.4 | 10.95 | 10.92 | 0.03 | 0.00 |
Enhanced Stats (5-on-5 unless denoted with *)
| Season | G/60 | A/60 | P/60 | IPP | ΔPEN/60 | 1A | 2A | EVS/60* | PPS/60* | SATF | SAT% | tEVSH% | tEVSV% | SHSV | ZS% |
|---|---|---|---|---|---|---|---|---|---|---|---|---|---|---|---|
| 23-24 | 0.36 | 0.83 | 1.18 | 67 | -0.23 | 5 | 2 | 7.1 | 0.0 | 523 | 49.5 | 6.1 | 0.925 | 986 | 45.2 |
| 22-23 | 0.73 | 0.73 | 1.46 | 87 | 0.42 | 4 | 6 | 6.5 | 0.0 | 679 | 41.6 | 6.1 | 0.908 | 969 | 30.1 |
| 21-22 | 0.55 | 1.18 | 1.74 | 85 | -0.06 | 9 | 6 | 6.6 | 0.0 | 687 | 48.8 | 7.2 | 0.915 | 987 | 34.1 |
| 20-21 | 0.48 | 0.96 | 1.44 | 63 | 0.17 | 8 | 2 | 6.6 | 0.0 | 549 | 51.0 | 7.7 | 0.929 | 1006 | 46.8 |
| 19-20 | 0.76 | 0.54 | 1.30 | 52 | 0.11 | 3 | 2 | 7.4 | 0.0 | 451 | 51.0 | 8.9 | 0.942 | 1031 | 51.7 |
Regression Meter
This meter measures whether or not a player's point production is being influenced by luck. Orange indicates the player has been lucky. Dark grey indicates the player has been unlucky.
2A/60
tEVSH%
SH%
IPP
PPSH%
Positional Data
| Season | Team | Left | Center | Right |
|---|---|---|---|---|
| 23-24 | BUF | 73 | 0 | 27 |
| 22-23 | CBJ | 97 | 1 | 1 |
| 21-22 | CBJ | 100 | 0 | 0 |
| 20-21 | CBJ | 77 | 0 | 23 |
| 19-20 | CBJ | 40 | 0 | 60 |
Most Common Linemates and Line Production
See also: Carolina Hurricanes Line Combo Tool | Line Production Tool
| Team | F1 | F2 | F3 | GF | GA | GF% | SATF | SATA | SAT% | USATF | USATA | USAT% | SH% | SV% | SHSV | ZS% |
|---|---|---|---|---|---|---|---|---|---|---|---|---|---|---|---|---|
| BUF | ROBINSON | KREBS | GIRGENSONS | 5 | 1 | 83.3 | 91 | 60 | 60.3 | 63 | 45 | 58.3 | 13.5 | 0.970 | 1105 | 61.5 |
| BUF | ROBINSON | OKPOSO | GIRGENSONS | 2 | 1 | 66.7 | 67 | 46 | 59.3 | 48 | 33 | 59.3 | 6.7 | 0.957 | 1023 | 42.9 |
| BUF | ROBINSON | KREBS | OKPOSO | 3 | 2 | 60.0 | 66 | 72 | 47.8 | 42 | 49 | 46.2 | 10.0 | 0.929 | 1029 | 30.8 |
Most Recent 10 Games
| OPP | G | A | P | +/- | PIM | SOG | SH% | H | BS | FW | FL | FO% | TOI | EVTOI | PPTOI | PKTOI | ID |
|---|---|---|---|---|---|---|---|---|---|---|---|---|---|---|---|---|---|
| DET | 0 | 0 | 0 | 0 | 0 | 1 | 0 | 1 | 0 | 0 | 0 | 0 | 09:29 | 09:29 | 00:00 | 00:00 | 21228 |
| PHI | 0 | 0 | 0 | -1 | 0 | 1 | 0 | 2 | 0 | 0 | 0 | 0 | 08:19 | 08:19 | 00:00 | 00:00 | 21211 |
| WSH | 0 | 0 | 0 | 1 | 0 | 1 | 0 | 1 | 1 | 0 | 0 | 0 | 11:53 | 11:53 | 00:00 | 00:00 | 21189 |
| OTT | 0 | 0 | 0 | -1 | 0 | 2 | 0 | 0 | 0 | 0 | 0 | 0 | 07:35 | 07:26 | 00:09 | 00:00 | 21148 |
| CGY | 0 | 0 | 0 | 0 | 0 | 1 | 0 | 1 | 0 | 0 | 0 | 0 | 11:30 | 11:30 | 00:00 | 00:00 | 21132 |
| VAN | 0 | 0 | 0 | 0 | 0 | 0 | 0 | 2 | 0 | 0 | 2 | 0 | 08:26 | 08:26 | 00:00 | 00:00 | 21093 |
| SEA | 0 | 0 | 0 | 0 | 0 | 1 | 0 | 3 | 0 | 0 | 0 | 0 | 10:12 | 09:41 | 00:00 | 00:31 | 21081 |
| DET | 0 | 0 | 0 | -1 | 2 | 1 | 0 | 2 | 0 | 0 | 0 | 0 | 10:18 | 10:18 | 00:00 | 00:00 | 21059 |
| NYI | 0 | 0 | 0 | 0 | 0 | 1 | 0 | 2 | 0 | 1 | 0 | 100 | 11:14 | 11:14 | 00:00 | 00:00 | 21045 |
| DET | 0 | 0 | 0 | -1 | 0 | 0 | 0 | 3 | 0 | 0 | 0 | 0 | 11:48 | 11:38 | 00:00 | 00:10 | 21031 |
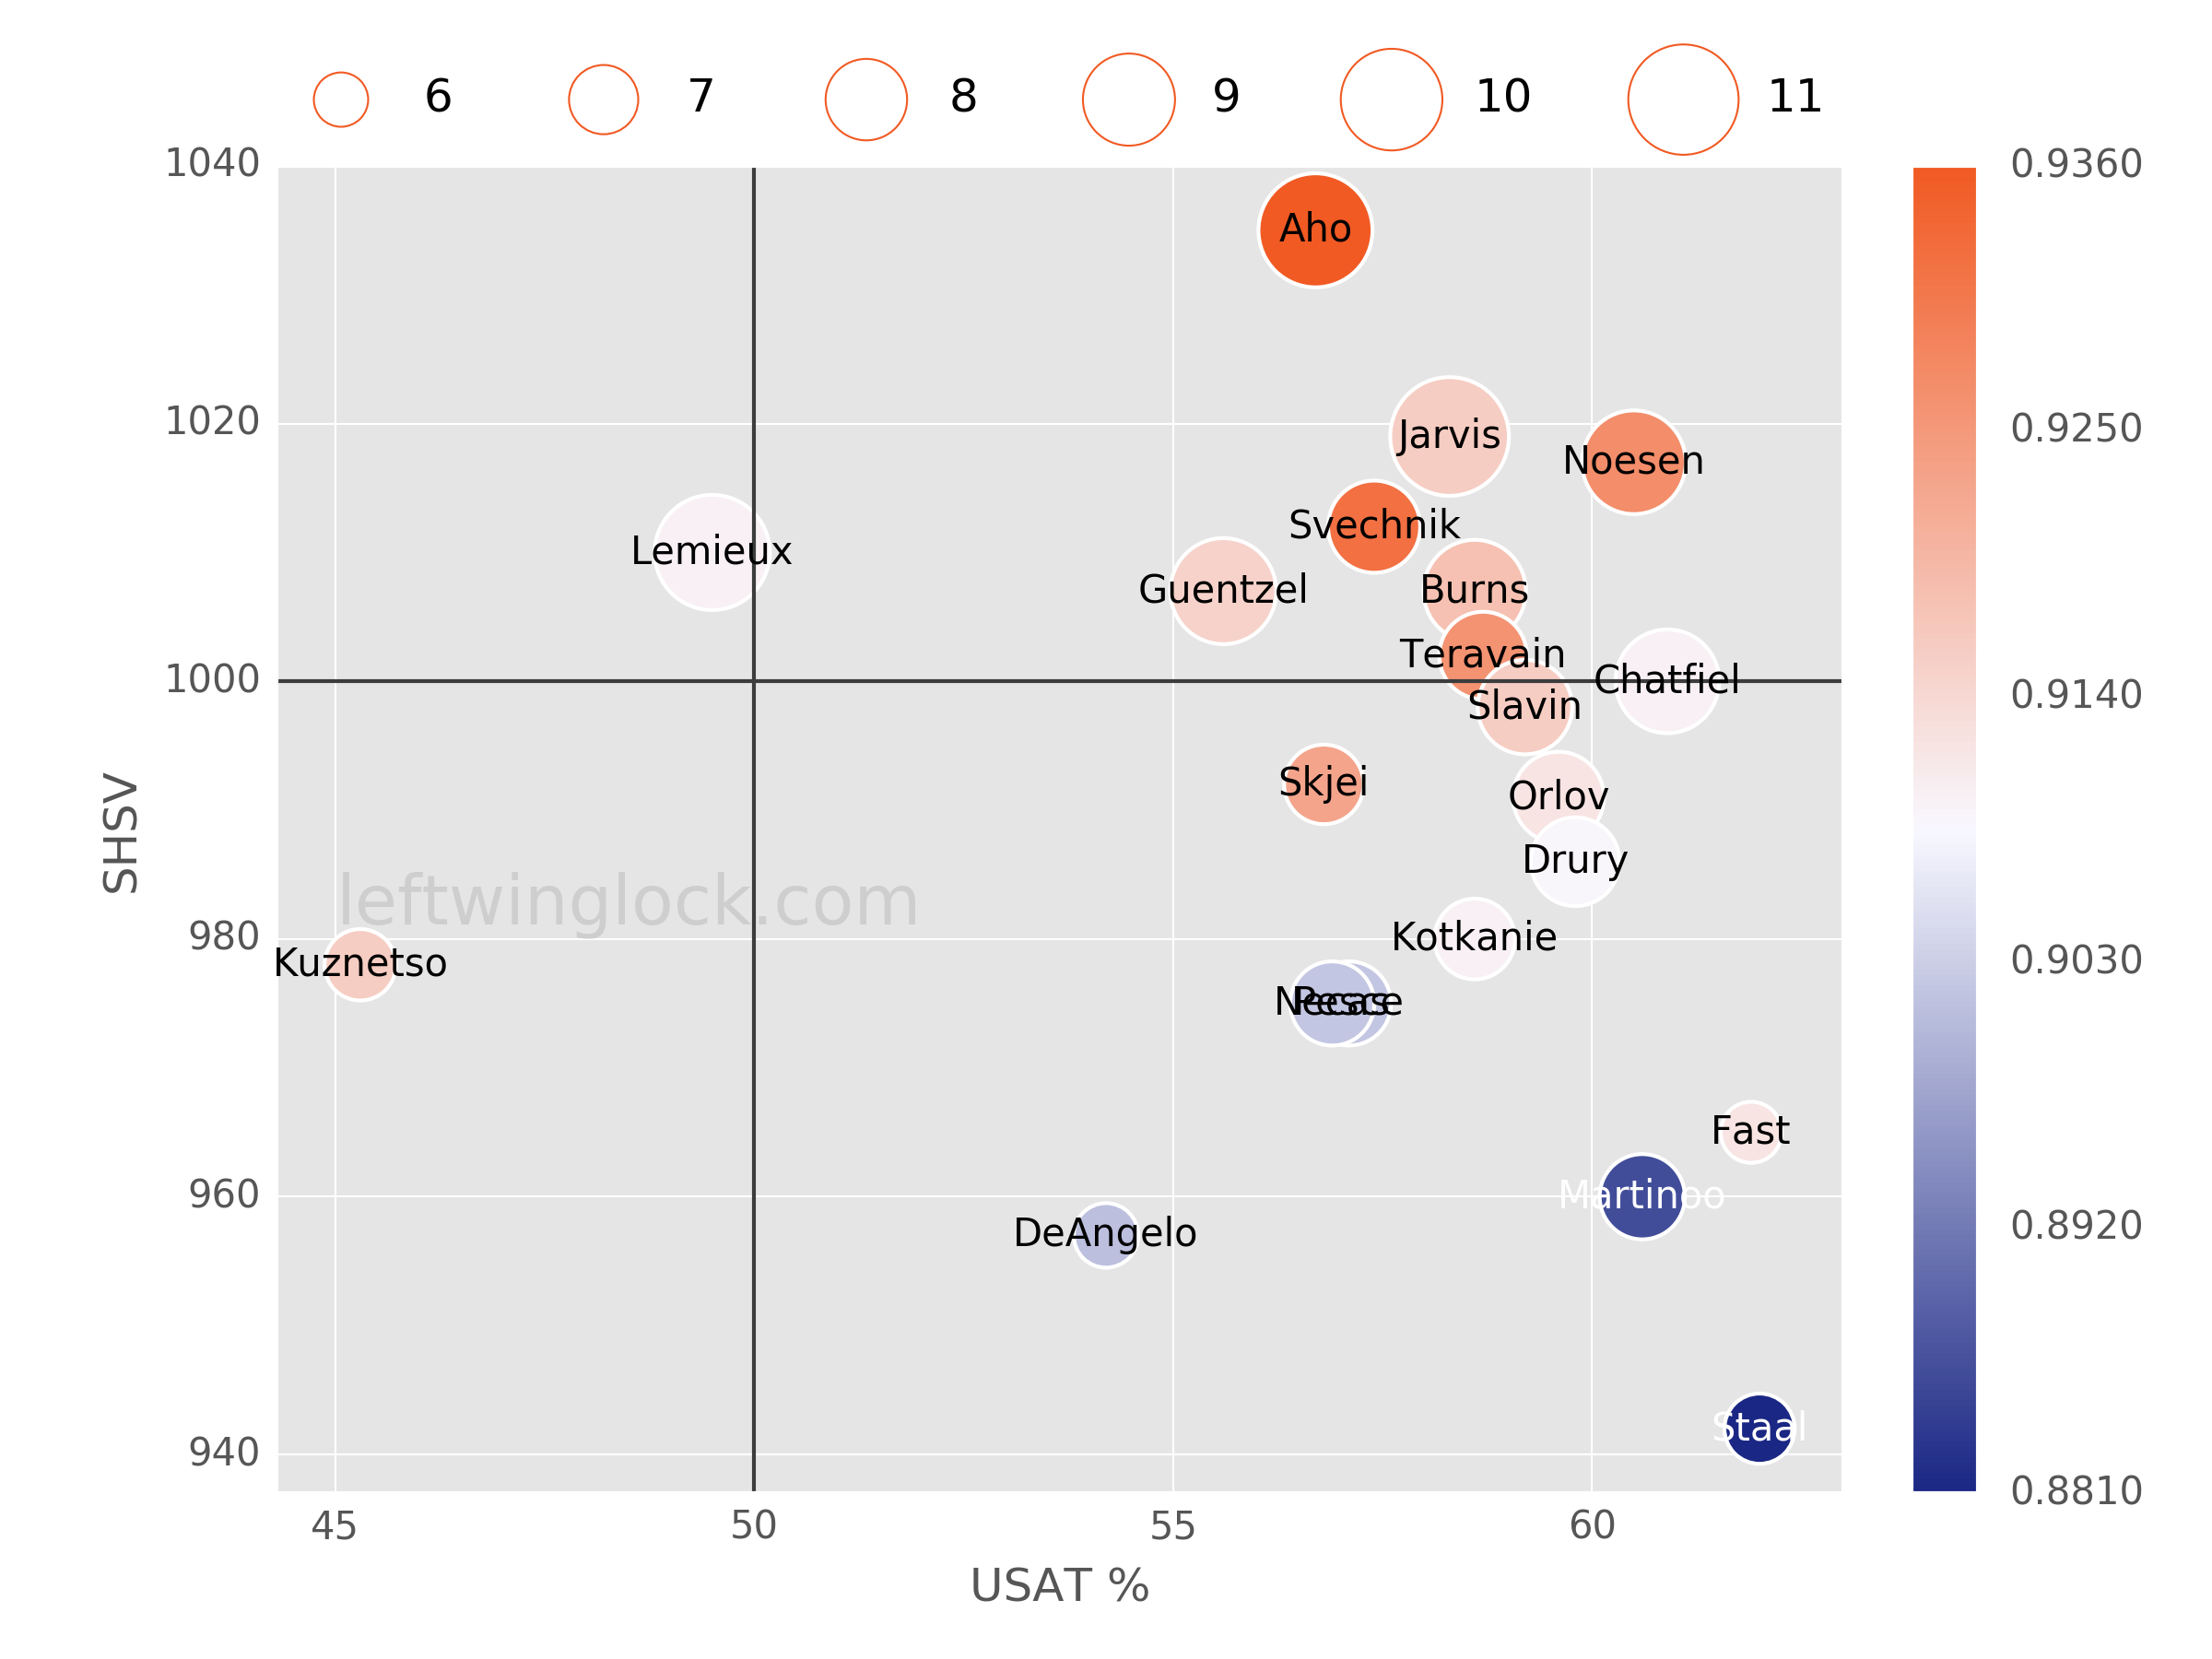
Player Usage Chart / Possession and Luck Chart