FABIAN ZETTERLUND
Explore projections, stats, news, player usage charts, and line combinations for members of the San Jose Sharks
-
Left Wing Leaders
2023 - 2024
Name G A Pts Artemi
Panarin49 71 120 Kirill Kaprizov 46 50 96 Filip Forsberg 48 46 94 Matthew Tkachuk 26 62 88 Jesper Bratt 27 56 83 Jason Robertson 29 51 80 Zach Hyman 54 23 77 Chris Kreider 39 36 75 Brandon Hagel 26 49 75 Brady Tkachuk 37 37 74 Kevin Fiala 29 44 73 Lucas Raymond 31 41 72 -
Player Card

FABIAN ZETTERLUND
San Jose Sharks2023 - 2024- G 24
- A 20
- PTS 44
- +/- -34
- PIM 33
- PPP 16
- SH% 11.8
- L 36%
- C 0%
- R 64%
-
San Jose Sharks Leaders
2023 - 2024
Name G A Pts Mikael
Granlund12 48 60 William Eklund 16 29 45 Fabian Zetterlund 24 20 44 Filip Zadina 13 10 23 Mike Hoffman 10 13 23 Mario Ferraro 3 18 21 Jan Rutta 5 14 19 Luke Kunin 11 7 18 Calen Addison 1 16 17 Klim Kostin 8 6 14 Justin Bailey 5 9 14 Nico Sturm 5 8 13
News
-
Fabian Zetterlund
Has signed a two-year contract with the San Jose Sharks.
Jul 1, 2023 - 8:06 pm -
Fabian Zetterlund
Has been traded to the San Jose Sharks, along with Andreas Johnsson, Nikita Okhotiuk, Shakir Mukhamadullin, a 2023 1st round draft pick, a 2024 2nd round draft pick, and a 2024 7th round draft pick, i...
Feb 26, 2023 - 9:41 pm -
Fabian Zetterlund
Is not expected to be in the lineup for today's game.
Feb 25, 2023 - 6:38 pm -
Fabian Zetterlund
Is not expected to be in the lineup for today's game.
Jan 13, 2023 - 9:41 pm
Feature
-
Trending
Buy-Low and Sell-High: Skaters
Replies 0
Basic Stats
| Season | Team | GP | G | A | P | +/- | PIM | S | S/GP | SH% | PPP | H | BS | FW | FO% | TOI | EVTOI | PPTOI | PKTOI |
|---|---|---|---|---|---|---|---|---|---|---|---|---|---|---|---|---|---|---|---|
| 23-24 | SJS | 82 | 24 | 20 | 44 | -34 | 33 | 204 | 2.5 | 11.8 | 16 | 120 | 71 | 28 | 32.9 | 18.86 | 15.68 | 2.48 | 0.70 |
| 22-23 | SJS | 67 | 6 | 17 | 23 | -6 | 14 | 118 | 1.8 | 5.1 | 3 | 53 | 20 | 7 | 41.2 | 13.26 | 12.42 | 0.82 | 0.01 |
| 21-22 | NJD | 14 | 3 | 5 | 8 | 5 | 0 | 36 | 2.6 | 8.3 | 0 | 16 | 7 | 2 | 66.7 | 13.34 | 11.80 | 1.54 | 0.00 |
Enhanced Stats (5-on-5 unless denoted with *)
| Season | G/60 | A/60 | P/60 | IPP | ΔPEN/60 | 1A | 2A | EVS/60* | PPS/60* | SATF | SAT% | tEVSH% | tEVSV% | SHSV | ZS% |
|---|---|---|---|---|---|---|---|---|---|---|---|---|---|---|---|
| 23-24 | 0.80 | 0.45 | 1.26 | 52 | -0.04 | 8 | 1 | 7.8 | 10.3 | 1060 | 42.8 | 9.3 | 0.899 | 992 | 44.5 |
| 22-23 | 0.37 | 1.10 | 1.47 | 43 | 0.14 | 11 | 4 | 7.4 | 15.2 | 814 | 50.5 | 7.4 | 0.917 | 991 | 46.9 |
| 21-22 | 1.11 | 1.84 | 2.95 | 62 | 0.00 | 3 | 2 | 9.9 | 16.7 | 157 | 52.6 | 14.4 | 0.927 | 1071 | 50.0 |
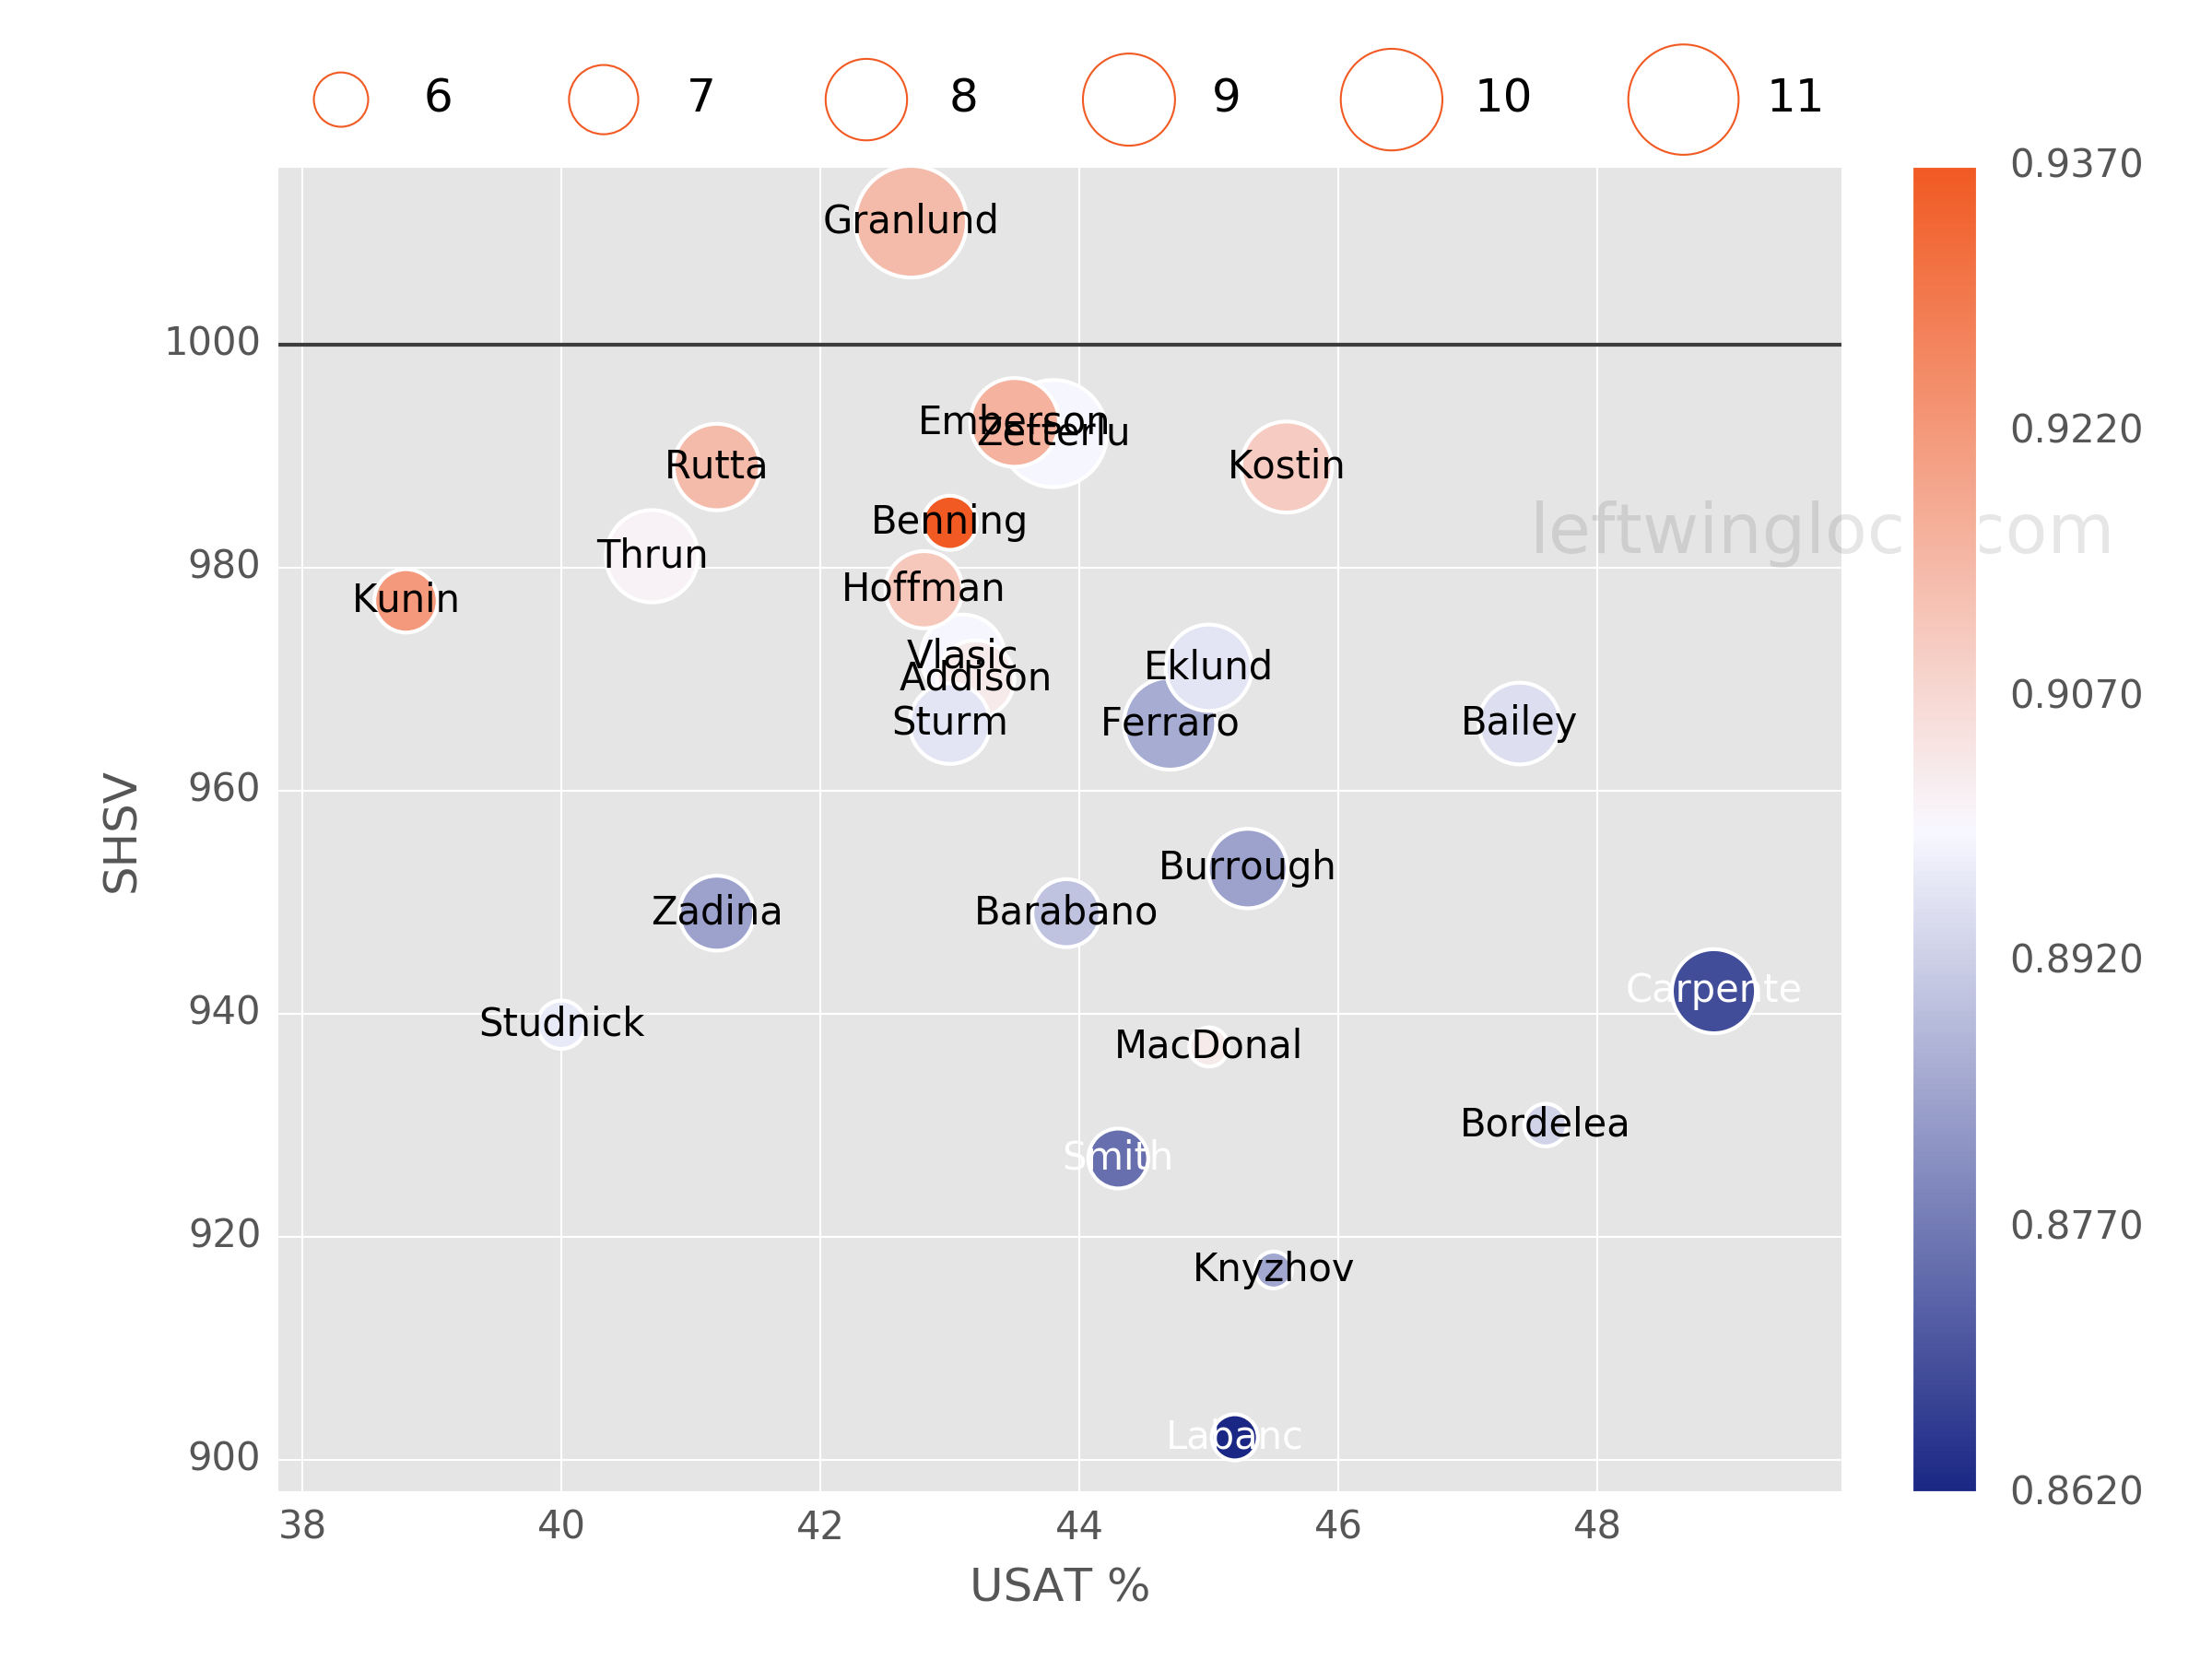
Regression Meter
This meter measures whether or not a player's point production is being influenced by luck. Orange indicates the player has been lucky. Dark grey indicates the player has been unlucky.
Positional Data
| Season | Team | Left | Center | Right |
|---|---|---|---|---|
| 23-24 | SJS | 36 | 0 | 64 |
| 22-23 | SJ | 0 | 0 | 100 |
| 21-22 | NJ | 0 | 0 | 100 |
Most Common Linemates and Line Production
See also: San Jose Sharks Line Combo Tool | Line Production Tool
| Team | F1 | F2 | F3 | GF | GA | GF% | SATF | SATA | SAT% | USATF | USATA | USAT% | SH% | SV% | SHSV | ZS% |
|---|---|---|---|---|---|---|---|---|---|---|---|---|---|---|---|---|
| SJS | ZETTERLUND | GRANLUND | DUCLAIR | 16 | 14 | 53.3 | 281 | 361 | 43.8 | 201 | 267 | 42.9 | 11.3 | 0.919 | 1033 | 41.7 |
| SJS | ZETTERLUND | KOSTIN | GRANLUND | 6 | 10 | 37.5 | 107 | 119 | 47.3 | 76 | 83 | 47.8 | 11.3 | 0.815 | 928 | 62.2 |
| SJS | EKLUND | GRANLUND | ZETTERLUND | 7 | 8 | 46.7 | 107 | 131 | 45.0 | 78 | 92 | 45.9 | 13.7 | 0.875 | 1012 | 46.2 |
Most Recent 10 Games
| OPP | G | A | P | +/- | PIM | SOG | SH% | H | BS | FW | FL | FO% | TOI | EVTOI | PPTOI | PKTOI | ID |
|---|---|---|---|---|---|---|---|---|---|---|---|---|---|---|---|---|---|
| CGY | 1 | 0 | 1 | -3 | 0 | 4 | 25 | 0 | 0 | 0 | 0 | 0 | 19:50 | 17:00 | 02:50 | 00:00 | 21309 |
| EDM | 1 | 0 | 1 | -2 | 0 | 2 | 50 | 5 | 1 | 0 | 0 | 0 | 17:54 | 16:26 | 01:28 | 00:00 | 21293 |
| MIN | 0 | 0 | 0 | 1 | 2 | 1 | 0 | 0 | 0 | 0 | 1 | 0 | 19:20 | 15:17 | 04:03 | 00:00 | 21282 |
| SEA | 1 | 0 | 1 | 2 | 0 | 4 | 25 | 1 | 2 | 1 | 1 | 50 | 20:20 | 18:34 | 01:46 | 00:00 | 21263 |
| CGY | 0 | 1 | 1 | 1 | 0 | 2 | 0 | 1 | 0 | 1 | 1 | 50 | 21:34 | 14:50 | 06:44 | 00:00 | 21251 |
| ARI | 0 | 1 | 1 | -1 | 0 | 4 | 0 | 0 | 1 | 2 | 0 | 100 | 19:07 | 13:38 | 05:26 | 00:03 | 21231 |
| STL | 0 | 1 | 1 | -1 | 2 | 5 | 0 | 1 | 0 | 1 | 2 | 33 | 18:33 | 12:13 | 06:20 | 00:00 | 21221 |
| LAK | 0 | 0 | 0 | 0 | 0 | 2 | 0 | 1 | 0 | 0 | 5 | 0 | 18:44 | 15:01 | 03:40 | 00:03 | 21210 |
| SEA | 1 | 1 | 2 | -1 | 0 | 5 | 20 | 1 | 1 | 0 | 0 | 0 | 17:54 | 15:20 | 02:34 | 00:00 | 21188 |
| STL | 0 | 1 | 1 | 1 | 0 | 5 | 0 | 2 | 1 | 0 | 4 | 0 | 20:18 | 17:39 | 02:37 | 00:02 | 21177 |
Player Usage Chart / Possession and Luck Chart