Matthew Peca
Explore projections, stats, news, player usage charts, and line combinations for members of the St. Louis Blues
-
Center Leaders
2023 - 2024
Name PPG PPA PPP Nathan
MacKinnon10 38 48 Connor McDavid 7 37 44 J.T. Miller 10 30 40 Leon Draisaitl 21 18 39 Steven Stamkos 19 20 39 Sam Reinhart 27 7 34 Brayden Point 15 17 32 Sebastian Aho 11 21 32 Elias Pettersson 13 18 31 Mika Zibanejad 12 19 31 Nick Suzuki 12 19 31 Jack Hughes 9 22 31 -
Player Card
-
St. Louis Blues Leaders
2023 - 2024
Name G A Pts Robert
Thomas26 60 86 Jordan Kyrou 31 36 67 Pavel Buchnevich 27 36 63 Brayden Schenn 20 26 46 Brandon Saad 26 16 42 Torey Krug 4 35 39 Jake Neighbours 27 11 38 Justin Faulk 2 28 30 Kevin Hayes 13 16 29 Nick Leddy 3 25 28 Colton Parayko 10 16 26 Kasperi Kapanen 6 16 22

News
-
Matthew Peca
Has cleared waivers.
Jan 27, 2023 - 2:21 pm -
Matthew Peca
Has been placed on waivers.
Jan 26, 2023 - 2:08 pm -
Matthew Peca
Has been reassigned to the AHL.
Dec 20, 2021 - 11:37 am -
Matthew Peca
Has been recalled from the AHL.
Dec 10, 2021 - 5:31 pm
Feature
-
Trending
No articles available
Replies 0
Basic Stats
| Season | Team | GP | G | A | P | +/- | PIM | S | S/GP | SH% | PPP | H | BS | FW | FO% | TOI | EVTOI | PPTOI | PKTOI |
|---|---|---|---|---|---|---|---|---|---|---|---|---|---|---|---|---|---|---|---|
| 21-22 | STL | 5 | 0 | 1 | 1 | -1 | 0 | 3 | 0.6 | 0.0 | 0 | 3 | 1 | 5 | 41.7 | 9.63 | 9.49 | 0.00 | 0.14 |
| 20-21 | OTT | 5 | 0 | 1 | 1 | 1 | 0 | 3 | 0.6 | 0.0 | 0 | 9 | 3 | 0 | 0.0 | 8.89 | 8.85 | 0.04 | 0.00 |
| 19-20 | MTL | 14 | 0 | 2 | 2 | -4 | 0 | 7 | 0.5 | 0.0 | 0 | 15 | 4 | 43 | 54.4 | 10.44 | 9.84 | 0.03 | 0.58 |
Enhanced Stats (5-on-5 unless denoted with *)
| Season | G/60 | A/60 | P/60 | IPP | ΔPEN/60 | 1A | 2A | EVS/60* | PPS/60* | SATF | SAT% | tEVSH% | tEVSV% | SHSV | ZS% |
|---|---|---|---|---|---|---|---|---|---|---|---|---|---|---|---|
| 21-22 | 0.00 | 1.27 | 1.27 | 0 | 2.49 | 0 | 1 | 3.8 | 0.0 | 29 | 50.8 | 0.0 | 0.933 | 0 | 55.0 |
| 20-21 | 0.00 | 1.36 | 1.36 | 50 | 0.00 | 1 | 0 | 4.1 | 0.0 | 46 | 47.4 | 8.0 | 0.966 | 1046 | 17.6 |
| 19-20 | 0.00 | 0.88 | 0.88 | 0 | 0.41 | 1 | 1 | 3.1 | 0.0 | 133 | 50.5 | 6.0 | 0.891 | 951 | 43.9 |
Regression Meter
This meter measures whether or not a player's point production is being influenced by luck. Orange indicates the player has been lucky. Dark grey indicates the player has been unlucky.
2A/60
tEVSH%
SH%
IPP
PPSH%
Positional Data
| Season | Team | Left | Center | Right |
|---|---|---|---|---|
| 21-22 | STL | 0 | 0 | 100 |
| 20-21 | OTT | 57 | 43 | 0 |
| 19-20 | MTL | 80 | 0 | 20 |
Most Common Linemates and Line Production
See also: St. Louis Blues Line Combo Tool | Line Production Tool
| Team | F1 | F2 | F3 | GF | GA | GF% | SATF | SATA | SAT% | USATF | USATA | USAT% | SH% | SV% | SHSV | ZS% |
|---|
Most Recent 10 Games
| OPP | G | A | P | +/- | PIM | SOG | SH% | H | BS | FW | FL | FO% | TOI | EVTOI | PPTOI | PKTOI | ID |
|---|
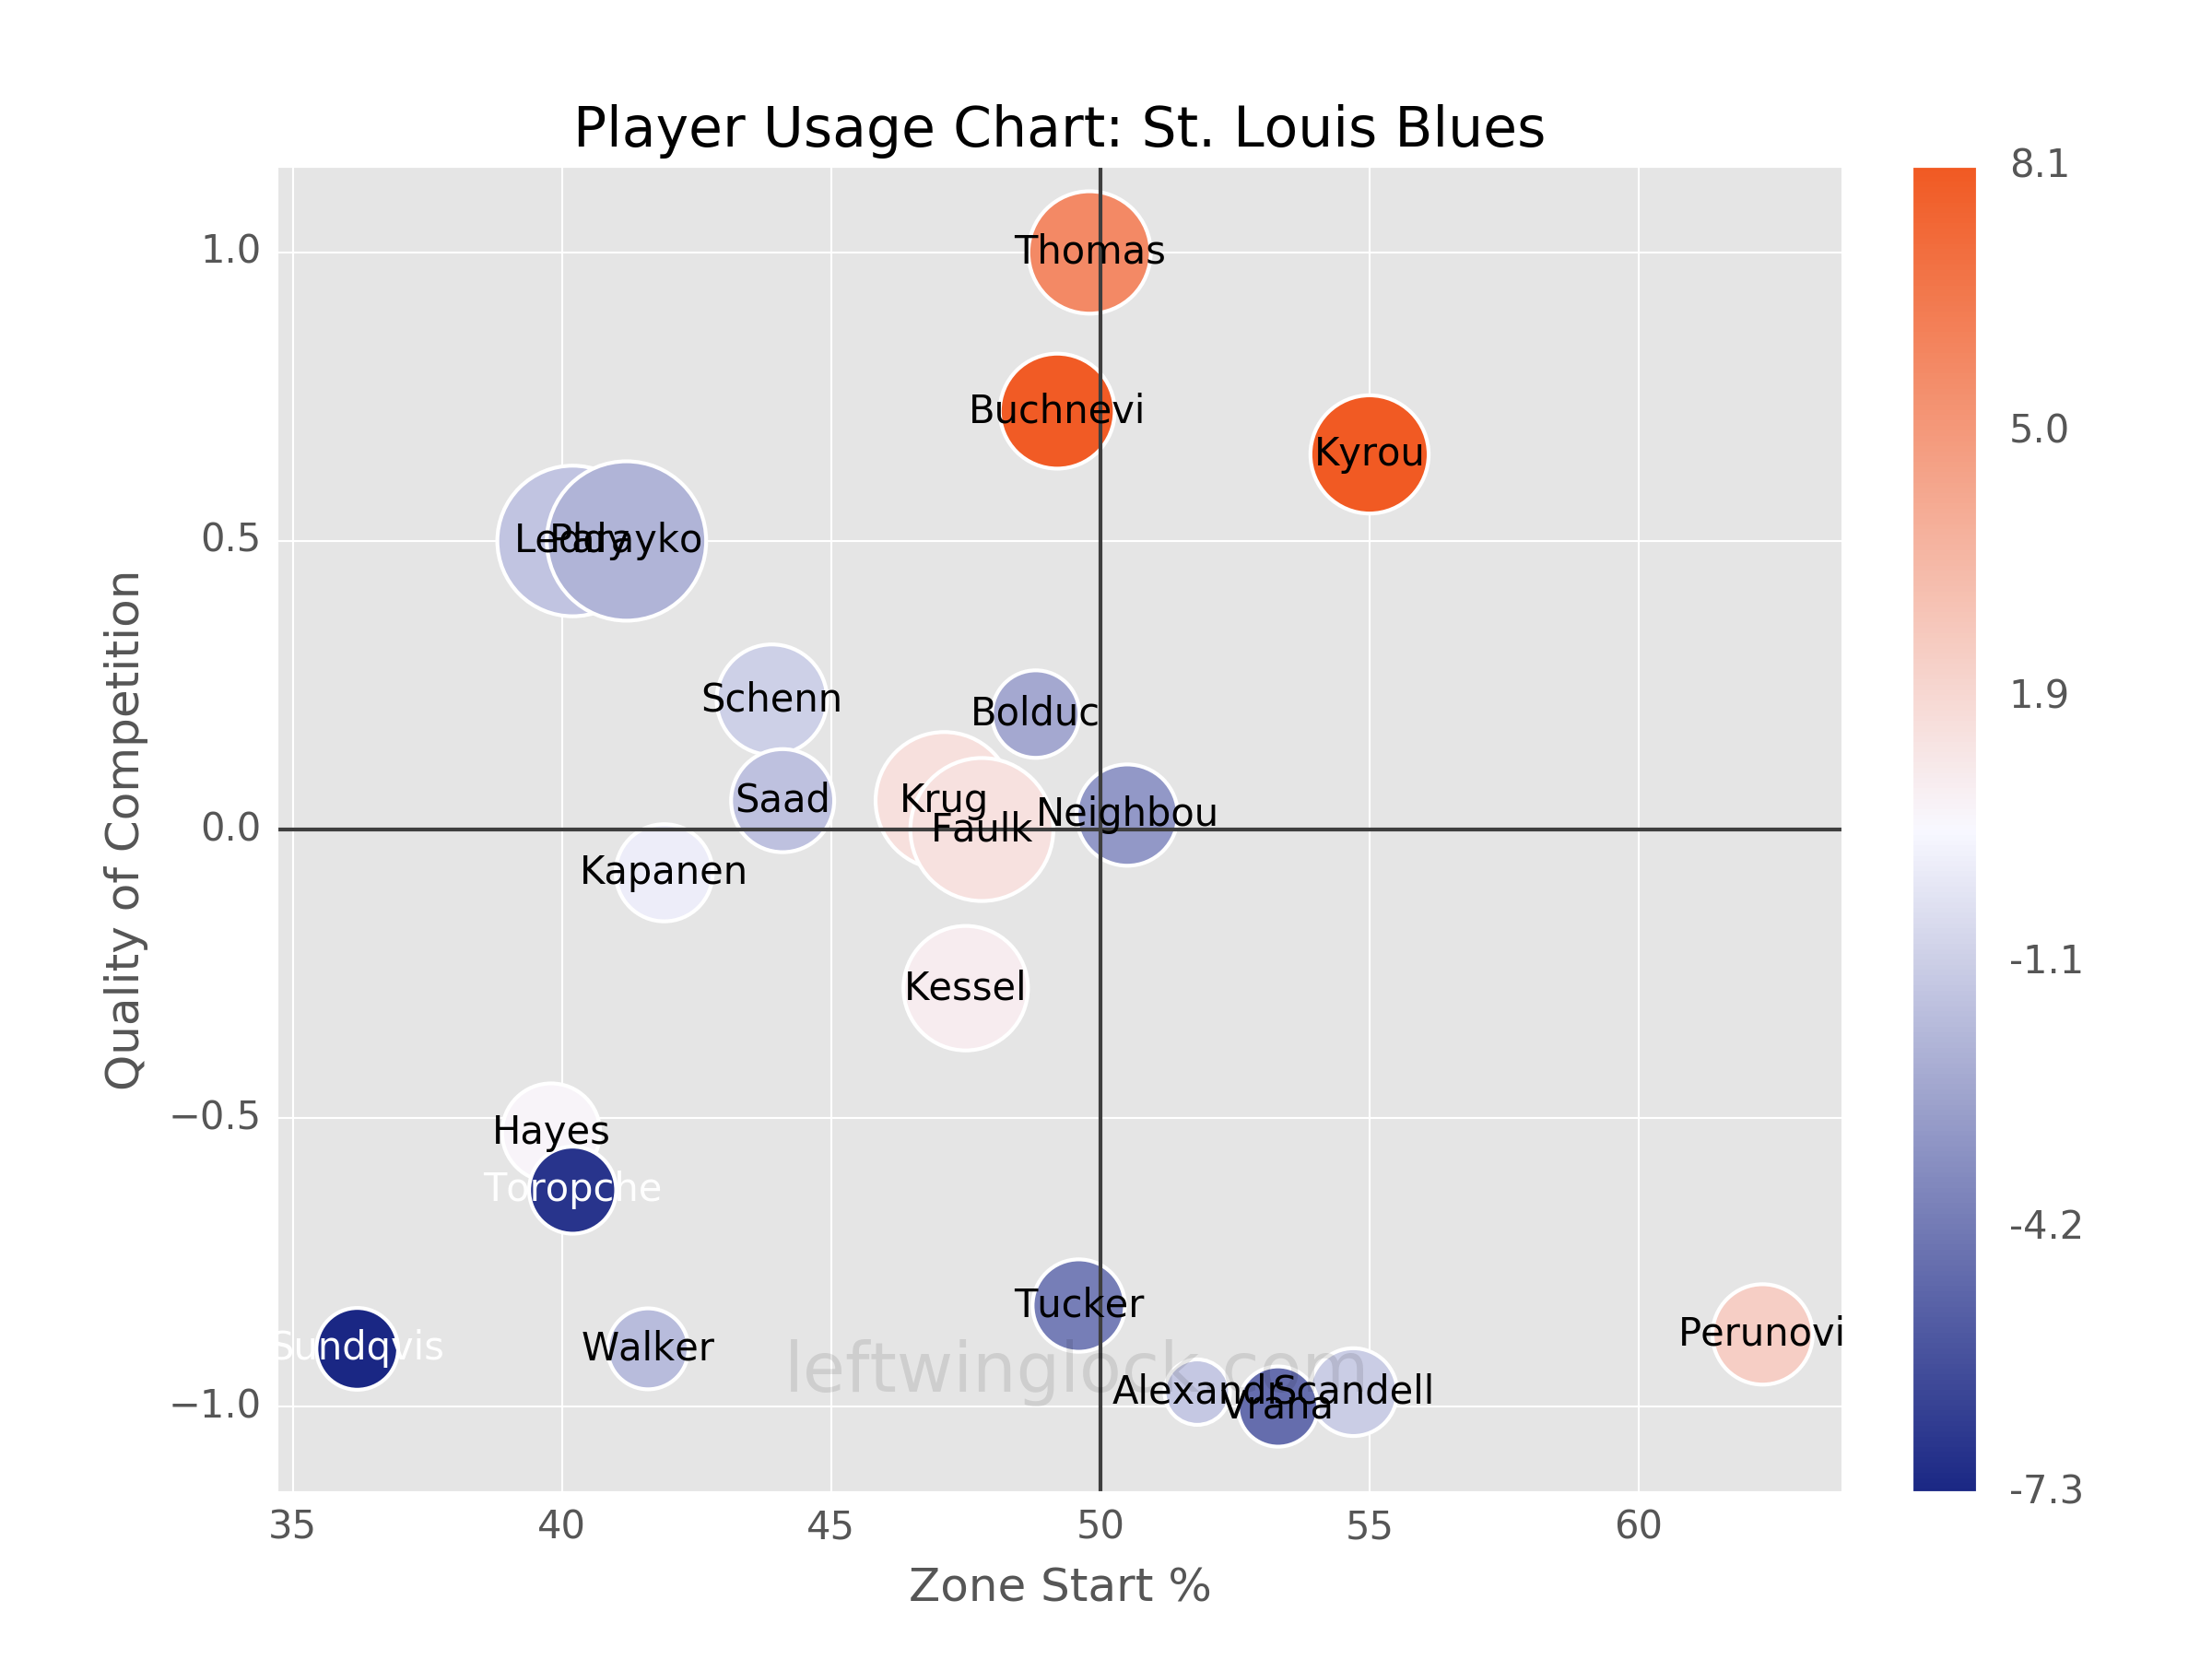
Player Usage Chart / Possession and Luck Chart