NICK RITCHIE
Explore projections, stats, news, player usage charts, and line combinations for members of the Calgary Flames
-
Left Wing Leaders
2023 - 2024
Name G A Pts Artemi
Panarin49 71 120 Kirill Kaprizov 46 50 96 Filip Forsberg 48 46 94 Matthew Tkachuk 26 62 88 Jesper Bratt 27 56 83 Jason Robertson 29 51 80 Zach Hyman 54 23 77 Chris Kreider 39 36 75 Brandon Hagel 26 49 75 Brady Tkachuk 37 37 74 Kevin Fiala 29 44 73 Lucas Raymond 31 41 72 -
Player Card
-
Calgary Flames Leaders
2023 - 2024
Name G A Pts Nazem
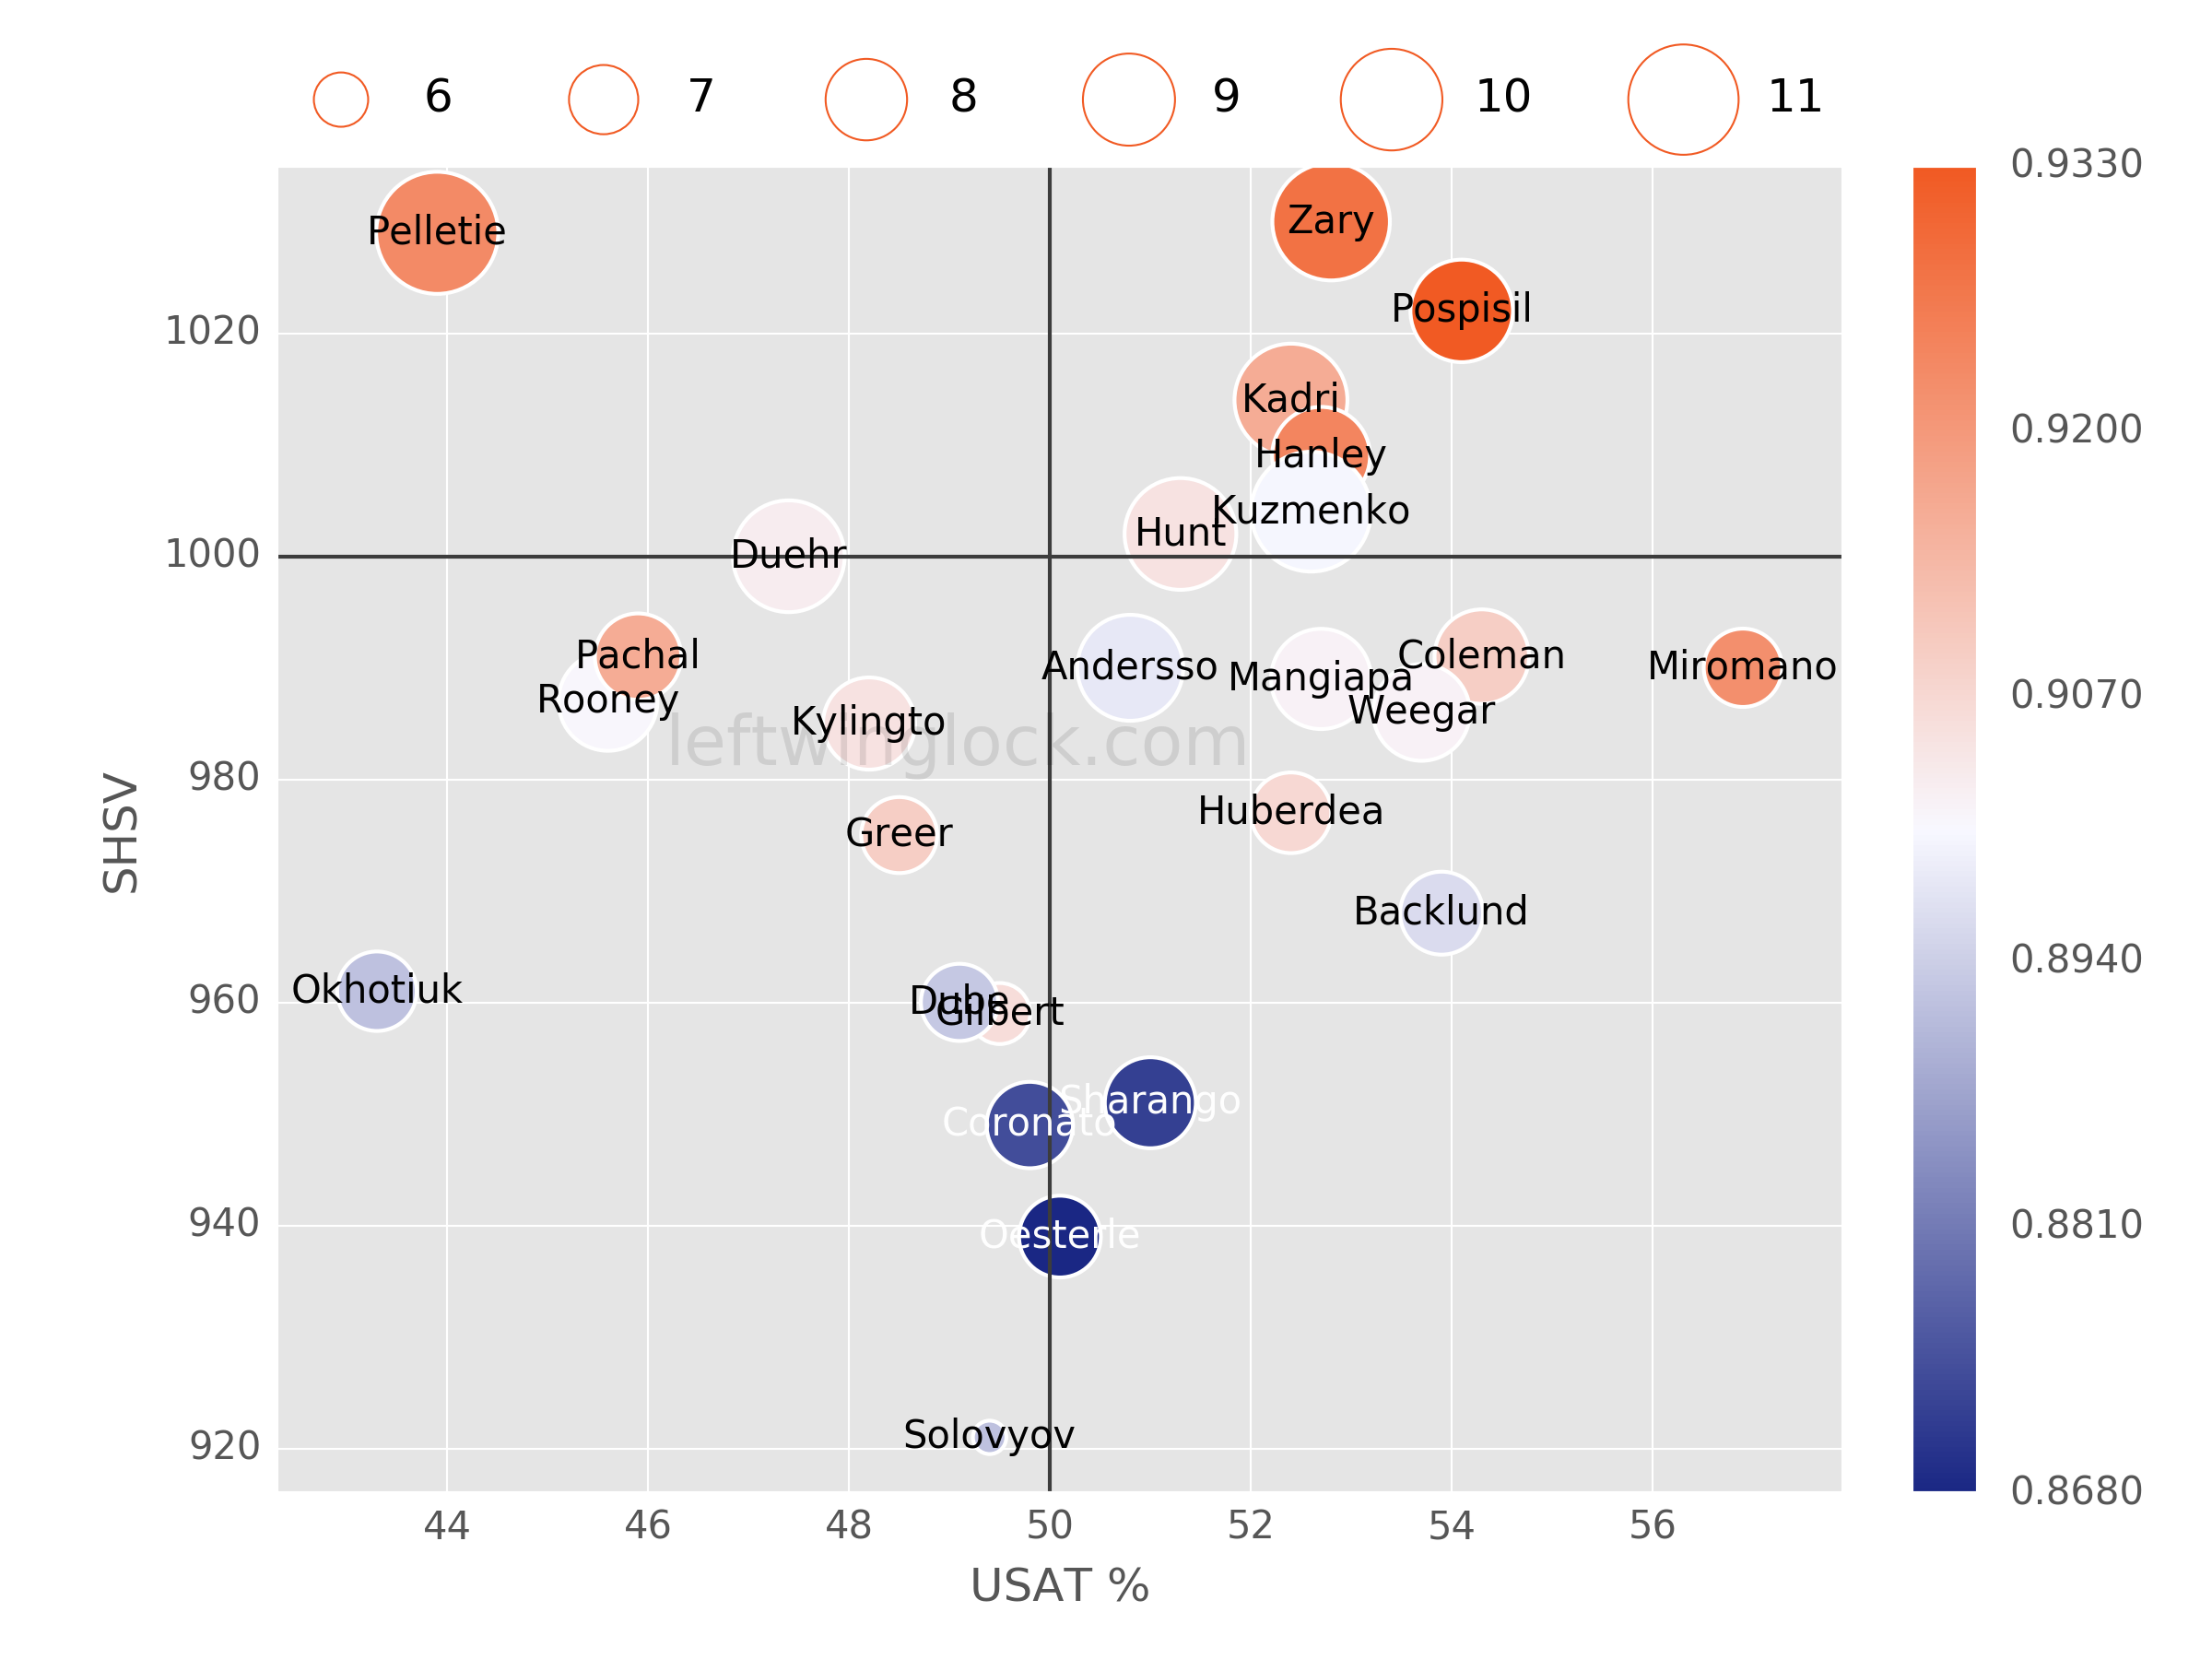
Kadri29 46 75 Yegor Sharangovich 31 28 59 Blake Coleman 30 24 54 MacKenzie Weegar 20 32 52 Jonathan Huberdeau 12 40 52 Andrei Kuzmenko 22 24 46 Andrew Mangiapane 14 26 40 Mikael Backlund 15 24 39 Rasmus Andersson 9 30 39 Connor Zary 14 20 34 Martin Pospisil 8 16 24 A.J. Greer 6 6 12

News
-
Nick Ritchie
Has been traded to the Calgary Flames, along with Troy Stecher, in exchange for Connor Mackey and Brett Ritchie.
Mar 3, 2023 - 3:13 pm -
Nick Ritchie
Is considered day-to-day with an upper-body injury.
Apr 20, 2022 - 11:09 pm -
Nick Ritchie
Has been suspended one game for slashing Kevin Shattenkirk of the Anaheim Ducks.
Apr 2, 2022 - 8:40 pm -
Nick Ritchie
Will have a hearing with the league regarding his actions in the most recent game.
Apr 2, 2022 - 11:54 am
Feature
-
Trending
Buy-Low and Sell-High: Skaters
Replies 0
Basic Stats
| Season | Team | GP | G | A | P | +/- | PIM | S | S/GP | SH% | PPP | H | BS | FW | FO% | TOI | EVTOI | PPTOI | PKTOI |
|---|---|---|---|---|---|---|---|---|---|---|---|---|---|---|---|---|---|---|---|
| 22-23 | CGY | 74 | 13 | 13 | 26 | -21 | 53 | 120 | 1.6 | 10.8 | 10 | 218 | 32 | 2 | 16.7 | 13.55 | 11.23 | 2.31 | 0.01 |
| 21-22 | ARI | 57 | 12 | 11 | 23 | -13 | 43 | 93 | 1.6 | 12.9 | 4 | 153 | 22 | 0 | 0.0 | 12.70 | 11.20 | 1.49 | 0.01 |
| 20-21 | BOS | 56 | 15 | 11 | 26 | -7 | 37 | 121 | 2.2 | 12.4 | 9 | 102 | 17 | 0 | 0.0 | 15.37 | 12.61 | 2.75 | 0.01 |
| 19-20 | ANA | 48 | 9 | 12 | 21 | 1 | 97 | 78 | 1.6 | 11.5 | 3 | 102 | 17 | 1 | 12.5 | 14.15 | 12.51 | 1.58 | 0.06 |
Enhanced Stats (5-on-5 unless denoted with *)
| Season | G/60 | A/60 | P/60 | IPP | ΔPEN/60 | 1A | 2A | EVS/60* | PPS/60* | SATF | SAT% | tEVSH% | tEVSV% | SHSV | ZS% |
|---|---|---|---|---|---|---|---|---|---|---|---|---|---|---|---|
| 22-23 | 0.66 | 0.51 | 1.17 | 65 | -0.90 | 5 | 2 | 6.7 | 9.1 | 744 | 47.2 | 7.4 | 0.901 | 975 | 48.3 |
| 21-22 | 1.04 | 0.76 | 1.80 | 78 | -1.24 | 3 | 5 | 7.4 | 10.6 | 601 | 49.8 | 8.5 | 0.894 | 979 | 49.8 |
| 20-21 | 0.88 | 0.61 | 1.49 | 68 | -0.56 | 4 | 3 | 7.7 | 10.5 | 657 | 52.8 | 6.5 | 0.918 | 983 | 57.4 |
| 19-20 | 0.71 | 0.92 | 1.63 | 61 | -2.21 | 6 | 3 | 6.8 | 7.1 | 596 | 51.9 | 7.5 | 0.926 | 1001 | 55.0 |
Regression Meter
This meter measures whether or not a player's point production is being influenced by luck. Orange indicates the player has been lucky. Dark grey indicates the player has been unlucky.
Positional Data
| Season | Team | Left | Center | Right |
|---|---|---|---|---|
| 22-23 | CGY | 100 | 0 | 0 |
| 21-22 | ARI | 92 | 0 | 8 |
| 20-21 | BOS | 98 | 0 | 2 |
| 19-20 | ANA | 98 | 0 | 2 |
Most Common Linemates and Line Production
See also: Calgary Flames Line Combo Tool | Line Production Tool
| Team | F1 | F2 | F3 | GF | GA | GF% | SATF | SATA | SAT% | USATF | USATA | USAT% | SH% | SV% | SHSV | ZS% |
|---|
Most Recent 10 Games
| OPP | G | A | P | +/- | PIM | SOG | SH% | H | BS | FW | FL | FO% | TOI | EVTOI | PPTOI | PKTOI | ID |
|---|
Player Usage Chart / Possession and Luck Chart