Paul Carey
Explore projections, stats, news, player usage charts, and line combinations for members of the Boston Bruins
-
Center Leaders
2023 - 2024
Name G A Pts Nathan
MacKinnon51 89 140 Connor McDavid 32 100 132 Auston Matthews 69 38 107 Leon Draisaitl 41 65 106 J.T. Miller 37 66 103 Sam Reinhart 57 37 94 Sidney Crosby 42 52 94 Brayden Point 46 44 90 Sebastian Aho 36 53 89 Elias Pettersson 34 55 89 Robert Thomas 26 60 86 Steven Stamkos 40 41 81 -
Player Card
-
Boston Bruins Leaders
2023 - 2024
Name G A Pts David
Pastrnak47 63 110 Brad Marchand 29 38 67 Charlie Coyle 25 35 60 Pavel Zacha 21 38 59 Charlie McAvoy 12 35 47 Jake DeBrusk 19 21 40 Trent Frederic 18 22 40 Morgan Geekie 17 22 39 James van Riemsdyk 11 27 38 Danton Heinen 17 19 36 Hampus Lindholm 3 23 26 Kevin Shattenkirk 6 18 24

News
-
Paul Carey
Has been reassigned to the AHL.
Mar 22, 2019 - 12:20 pm -
Paul Carey
Has been recalled from the AHL.
Mar 13, 2019 - 3:26 pm -
Paul Carey
Has been traded to the Boston Bruins in exchange for Cody Goloubef...
Jan 11, 2019 - 2:32 pm -
Paul Carey
Has been recalled from the AHL.
Dec 10, 2018 - 11:57 am
Feature
-
Trending
No articles available
Replies 0
Basic Stats
| Season | Team | GP | G | A | P | +/- | PIM | S | S/GP | SH% | PPP | H | BS | FW | FO% | TOI | EVTOI | PPTOI | PKTOI |
|---|---|---|---|---|---|---|---|---|---|---|---|---|---|---|---|---|---|---|---|
| 19-20 | BOS | 1 | 0 | 0 | 0 | -1 | 0 | 0 | 0 | 0.0 | 0 | 0 | 0 | 0 | 0.0 | 6.37 | 5.85 | 0.52 | 0.00 |
Enhanced Stats (5-on-5 unless denoted with *)
| Season | G/60 | A/60 | P/60 | IPP | ΔPEN/60 | 1A | 2A | EVS/60* | PPS/60* | SATF | SAT% | tEVSH% | tEVSV% | SHSV | ZS% |
|---|---|---|---|---|---|---|---|---|---|---|---|---|---|---|---|
| 19-20 | 0.00 | 0.00 | 0.00 | 0 | 9.42 | 0 | 0 | 0.0 | 0.0 | 0 |
Regression Meter
This meter measures whether or not a player's point production is being influenced by luck. Orange indicates the player has been lucky. Dark grey indicates the player has been unlucky.
2A/60
tEVSH%
SH%
IPP
PPSH%
Positional Data
| Season | Team | Left | Center | Right |
|---|---|---|---|---|
| 19-20 | BOS | 0 | 0 | 100 |
Most Common Linemates and Line Production
See also: Boston Bruins Line Combo Tool | Line Production Tool
| Team | F1 | F2 | F3 | GF | GA | GF% | SATF | SATA | SAT% | USATF | USATA | USAT% | SH% | SV% | SHSV | ZS% |
|---|
Next Opponent (With Line Matching)
Florida Panthers on May 8, 2024 | See also: Line Matching Tool
*** You are seeing no results because these teams have not played yet this season or Paul Carey was likely ill, injured, or scratched for the previous matchup. ***| FORWARD 1 | FORWARD 2 | FORWARD 3 | Frequency |
|---|
Most Recent 10 Games
| OPP | G | A | P | +/- | PIM | SOG | SH% | H | BS | FW | FL | FO% | TOI | EVTOI | PPTOI | PKTOI | ID |
|---|
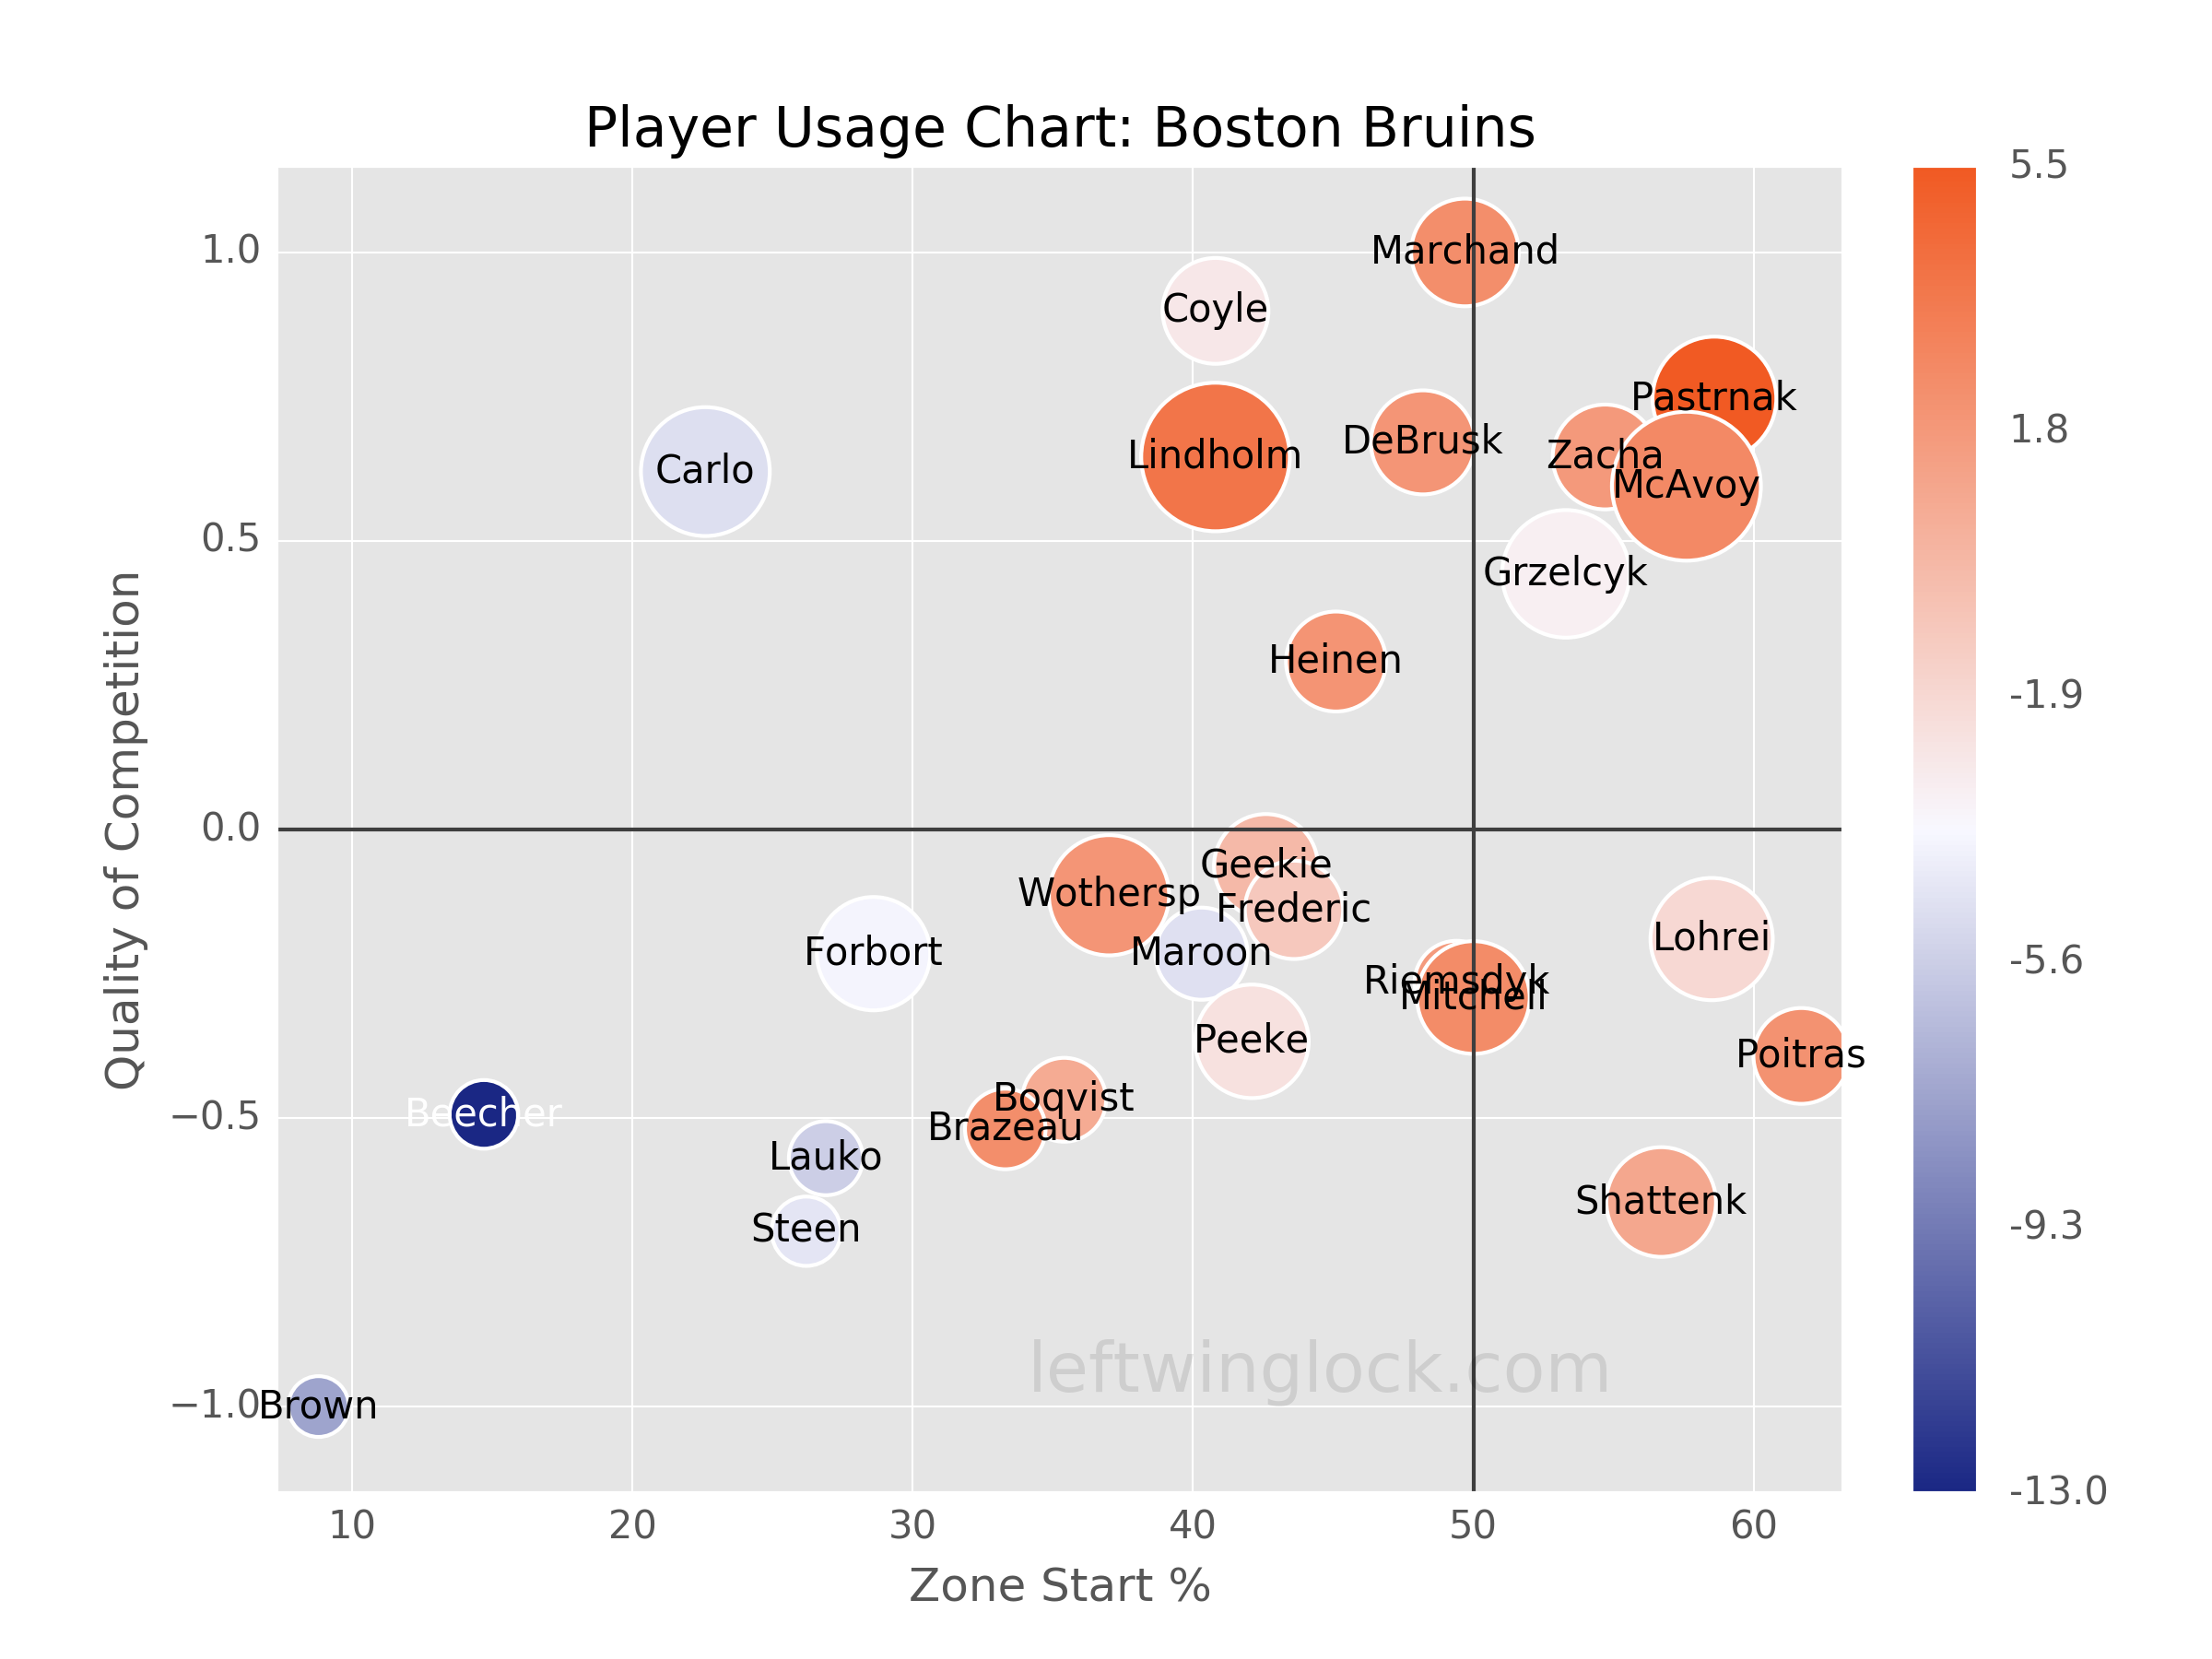
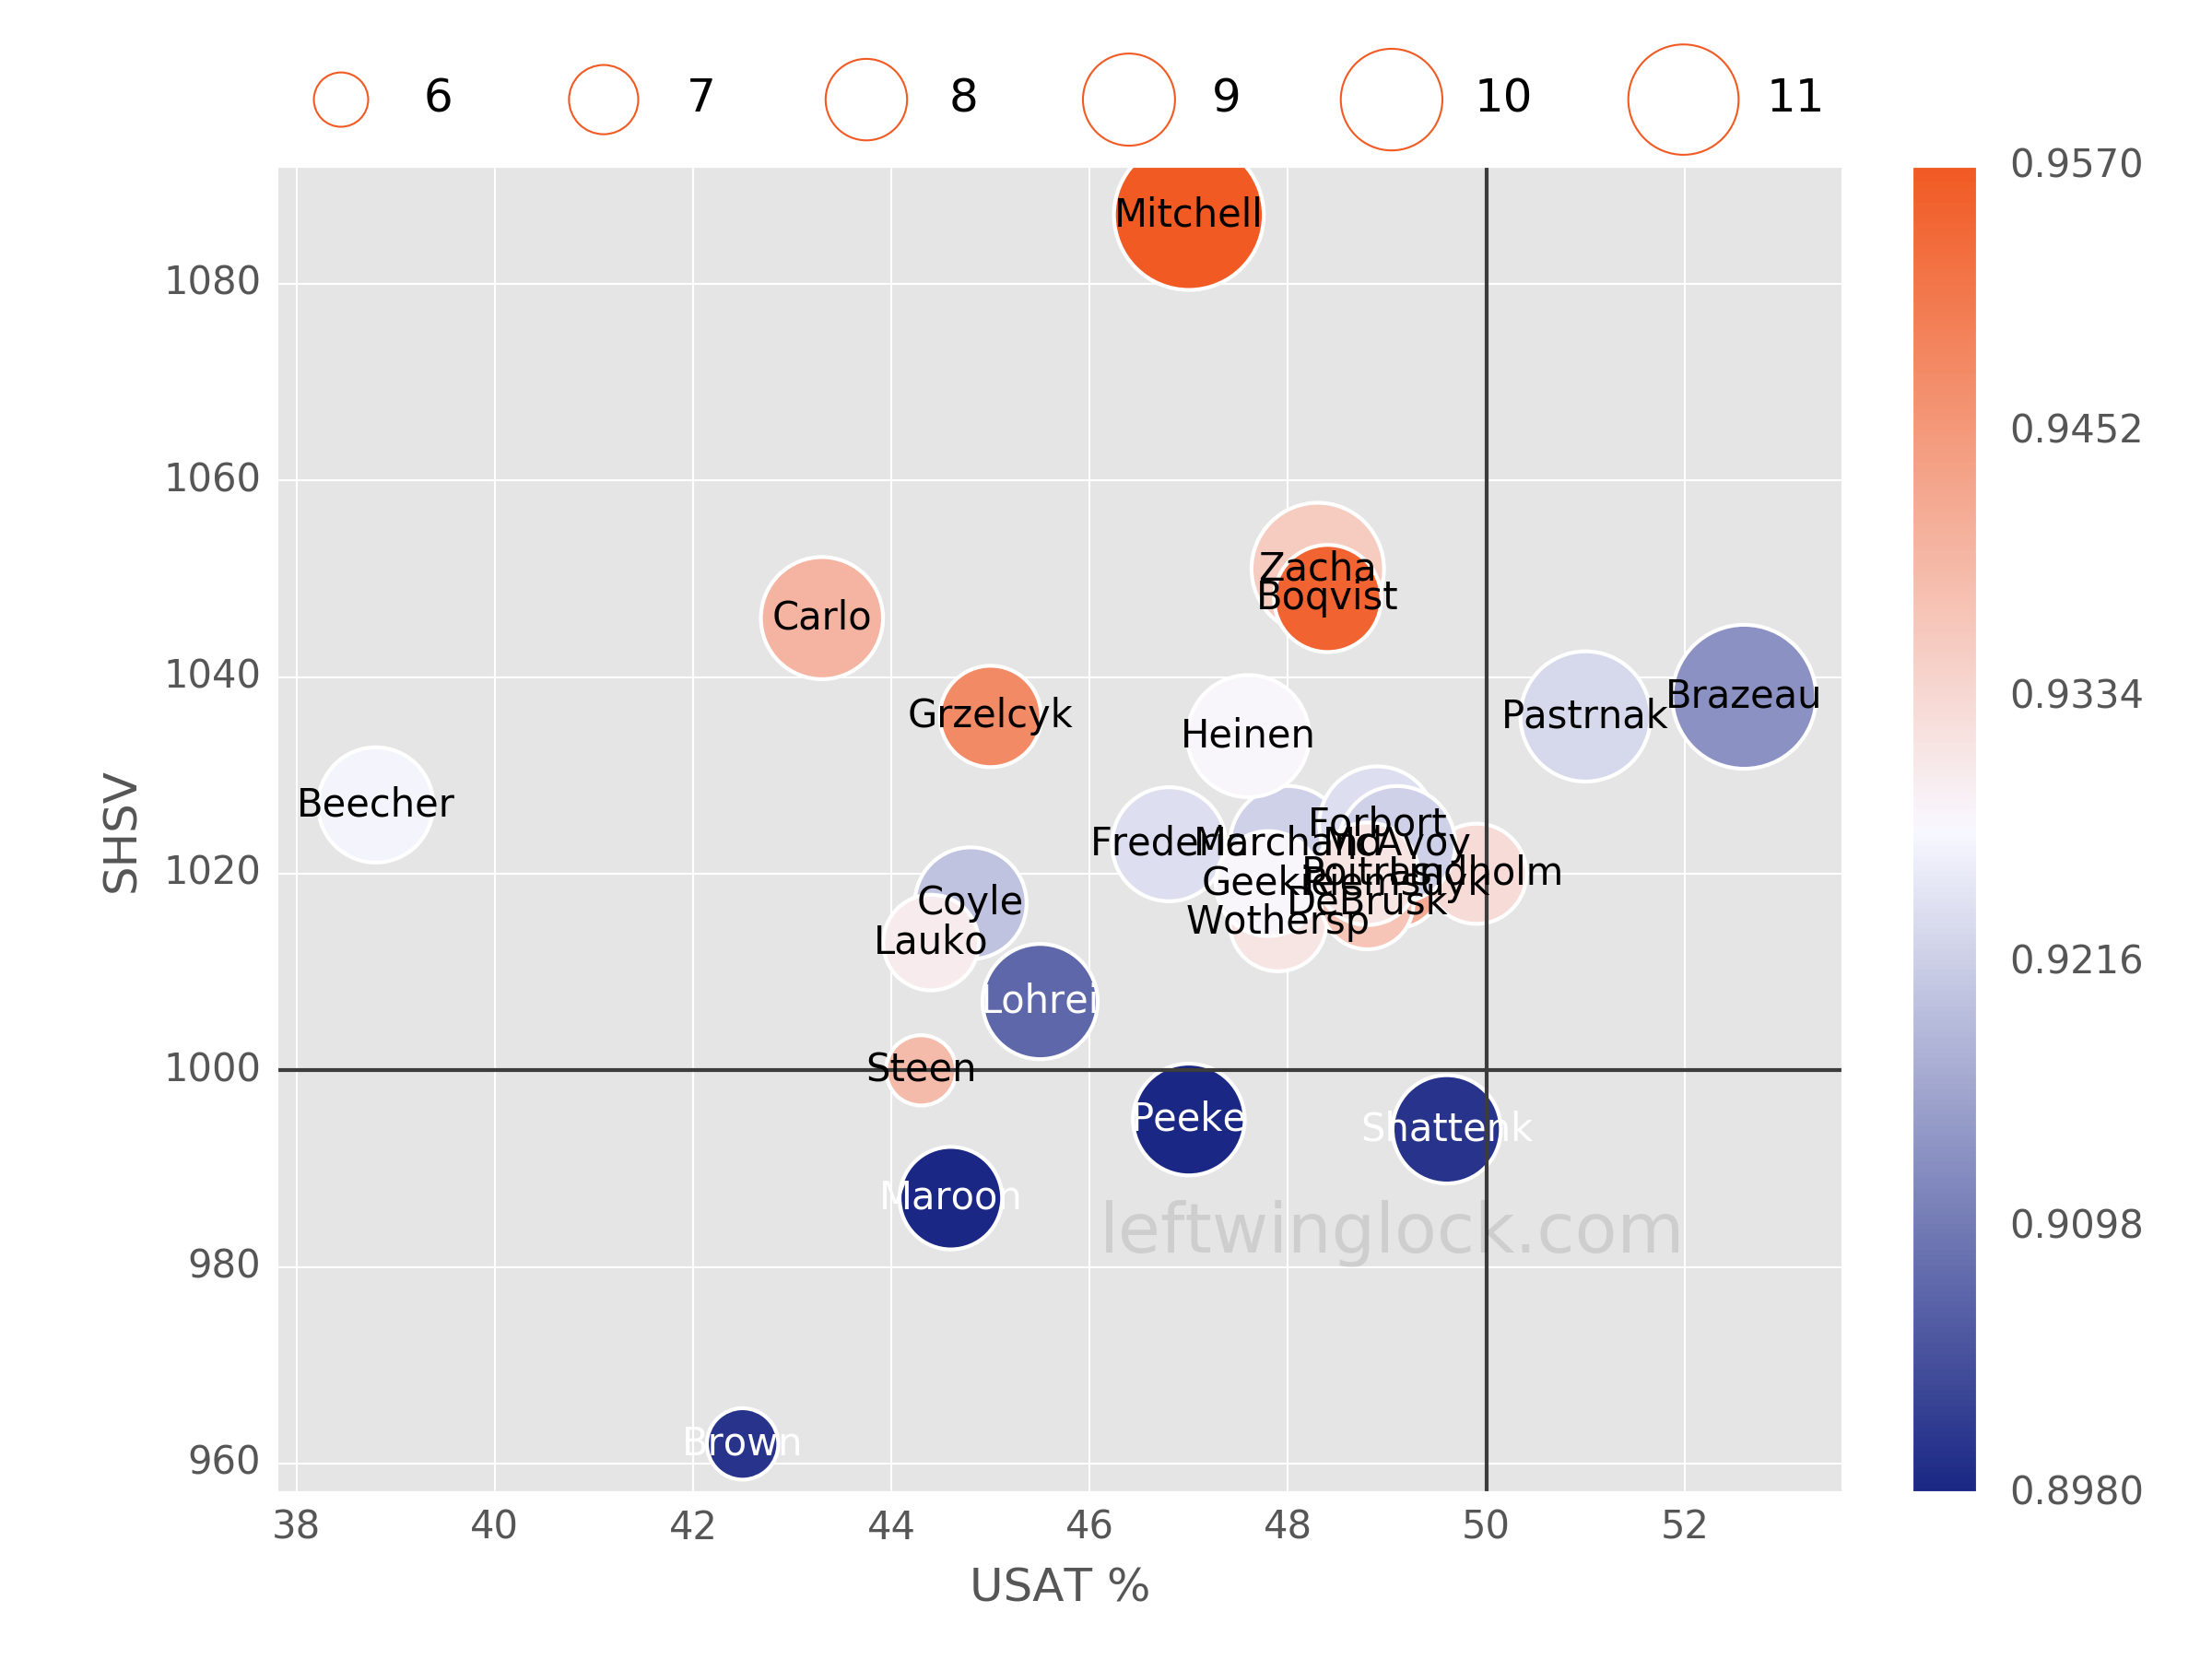
Player Usage Chart / Possession and Luck Chart