TANNER PEARSON
Explore projections, stats, news, player usage charts, and line combinations for members of the Montreal Canadiens
-
Left Wing Leaders
2023 - 2024
Name PPG PPA PPP Artemi
Panarin11 33 44 Kirill Kaprizov 19 22 41 Filip Forsberg 13 19 32 Matthew Tkachuk 6 26 32 Kevin Fiala 11 19 30 Chris Kreider 18 11 29 Alex Ovechkin 13 15 28 Jason Robertson 9 19 28 Jesper Bratt 7 20 27 Brad Marchand 7 19 26 Matt Boldy 10 15 25 Jared McCann 9 14 23 -
Player Card

TANNER PEARSON
Montreal Canadiens2023 - 2024- G 5
- A 8
- PTS 13
- +/- -12
- PIM 21
- PPP 2
- SH% 6.5
- L 89%
- C 0%
- R 11%
-
Montreal Canadiens Leaders
2023 - 2024
Name G A Pts Nick
Suzuki33 44 77 Cole Caufield 28 37 65 Mike Matheson 11 51 62 Juraj Slafkovsky 20 30 50 Alex Newhook 15 19 34 Brendan Gallagher 16 15 31 Jake Evans 7 21 28 Joel Armia 17 8 25 David Savard 6 18 24 Kaiden Guhle 6 16 22 Josh Anderson 9 11 20 Jordan Harris 3 11 14
News
-
Tanner Pearson
Is expected to be in the lineup for today's game.
Apr 16, 2024 - 4:55 pm -
Tanner Pearson
Is not expected to be in the lineup for today's game.
Apr 13, 2024 - 12:08 pm -
Tanner Pearson
Is expected to be in the lineup for today's game.
Apr 6, 2024 - 10:59 am -
Tanner Pearson
Is not expected to be in the lineup for today's game.
Mar 24, 2024 - 2:21 pm
Feature
-
Trending
No articles available
Replies 0
Basic Stats
| Season | Team | GP | G | A | P | +/- | PIM | S | S/GP | SH% | PPP | H | BS | FW | FO% | TOI | EVTOI | PPTOI | PKTOI |
|---|---|---|---|---|---|---|---|---|---|---|---|---|---|---|---|---|---|---|---|
| 23-24 | MTL | 54 | 5 | 8 | 13 | -12 | 21 | 77 | 1.4 | 6.5 | 2 | 50 | 35 | 5 | 22.7 | 12.94 | 10.79 | 1.21 | 0.94 |
| 22-23 | VAN | 14 | 1 | 4 | 5 | -9 | 21 | 17 | 1.2 | 5.9 | 1 | 20 | 3 | 7 | 38.9 | 13.49 | 11.46 | 1.49 | 0.54 |
| 21-22 | VAN | 68 | 14 | 20 | 34 | 9 | 30 | 159 | 2.3 | 8.8 | 3 | 84 | 41 | 20 | 35.1 | 16.05 | 13.76 | 1.61 | 0.68 |
| 20-21 | VAN | 51 | 10 | 8 | 18 | -15 | 26 | 110 | 2.2 | 9.1 | 3 | 54 | 28 | 6 | 37.5 | 17.07 | 14.15 | 1.87 | 1.05 |
| 19-20 | VAN | 69 | 21 | 24 | 45 | -4 | 27 | 164 | 2.4 | 12.8 | 10 | 96 | 40 | 3 | 17.7 | 16.51 | 13.86 | 1.59 | 1.06 |
Enhanced Stats (5-on-5 unless denoted with *)
| Season | G/60 | A/60 | P/60 | IPP | ΔPEN/60 | 1A | 2A | EVS/60* | PPS/60* | SATF | SAT% | tEVSH% | tEVSV% | SHSV | ZS% |
|---|---|---|---|---|---|---|---|---|---|---|---|---|---|---|---|
| 23-24 | 0.42 | 0.73 | 1.15 | 71 | -0.09 | 3 | 4 | 6.6 | 8.3 | 491 | 43.4 | 6.9 | 0.909 | 978 | 41.5 |
| 22-23 | 0.39 | 1.17 | 1.55 | 67 | -1.27 | 2 | 1 | 6.6 | 0.0 | 135 | 44.2 | 7.6 | 0.863 | 939 | 54.9 |
| 21-22 | 0.73 | 1.00 | 1.73 | 62 | 0.22 | 7 | 8 | 8.9 | 8.2 | 943 | 52.8 | 7.8 | 0.936 | 1014 | 48.9 |
| 20-21 | 0.62 | 0.53 | 1.14 | 48 | 0.21 | 4 | 2 | 7.9 | 8.8 | 629 | 46.9 | 7.5 | 0.914 | 989 | 39.0 |
| 19-20 | 0.80 | 0.93 | 1.73 | 80 | -0.11 | 7 | 7 | 8.7 | 9.8 | 880 | 48.8 | 6.2 | 0.916 | 978 | 44.5 |
Regression Meter
This meter measures whether or not a player's point production is being influenced by luck. Orange indicates the player has been lucky. Dark grey indicates the player has been unlucky.
2A/60
tEVSH%
SH%
IPP
PPSH%
Positional Data
| Season | Team | Left | Center | Right |
|---|---|---|---|---|
| 23-24 | MTL | 89 | 0 | 11 |
| 22-23 | VAN | 100 | 0 | 0 |
| 21-22 | VAN | 100 | 0 | 0 |
| 20-21 | VAN | 100 | 0 | 0 |
| 19-20 | VAN | 100 | 0 | 0 |
Most Common Linemates and Line Production
See also: Montreal Canadiens Line Combo Tool | Line Production Tool
| Team | F1 | F2 | F3 | GF | GA | GF% | SATF | SATA | SAT% | USATF | USATA | USAT% | SH% | SV% | SHSV | ZS% |
|---|---|---|---|---|---|---|---|---|---|---|---|---|---|---|---|---|
| MTL | PEARSON | MONAHAN | GALLAGHER | 4 | 8 | 33.3 | 139 | 127 | 52.3 | 93 | 94 | 49.7 | 6.6 | 0.869 | 934 | 40.5 |
| MTL | PEARSON | EVANS | ANDERSON | 3 | 8 | 27.3 | 89 | 100 | 47.1 | 63 | 79 | 44.4 | 8.1 | 0.855 | 936 | 48.5 |
| MTL | PEARSON | EVANS | YLNEN | 0 | 1 | 0.0 | 28 | 44 | 38.9 | 16 | 30 | 34.8 | 0.0 | 0.955 | 955 | 37.5 |
Most Recent 10 Games
| OPP | G | A | P | +/- | PIM | SOG | SH% | H | BS | FW | FL | FO% | TOI | EVTOI | PPTOI | PKTOI | ID |
|---|---|---|---|---|---|---|---|---|---|---|---|---|---|---|---|---|---|
| DET | 0 | 0 | 0 | -1 | 0 | 0 | 0 | 1 | 0 | 0 | 0 | 0 | 12:00 | 10:49 | 01:11 | 00:00 | 21298 |
| NYI | 0 | 0 | 0 | 0 | 0 | 1 | 0 | 0 | 0 | 0 | 0 | 0 | 12:20 | 12:20 | 00:00 | 00:00 | 21261 |
| PHI | 0 | 1 | 1 | 1 | 0 | 0 | 0 | 1 | 1 | 0 | 0 | 0 | 14:40 | 13:58 | 00:00 | 00:42 | 21242 |
| NYR | 0 | 0 | 0 | -1 | 0 | 1 | 0 | 3 | 0 | 0 | 0 | 0 | 13:30 | 13:30 | 00:00 | 00:00 | 21234 |
| TOR | 0 | 0 | 0 | 0 | 0 | 4 | 0 | 0 | 0 | 0 | 0 | 0 | 15:16 | 14:23 | 00:00 | 00:53 | 21223 |
| VAN | 0 | 0 | 0 | 0 | 0 | 0 | 0 | 0 | 0 | 0 | 1 | 0 | 10:31 | 07:57 | 01:10 | 01:24 | 21106 |
| CGY | 0 | 1 | 1 | 1 | 0 | 1 | 0 | 0 | 0 | 0 | 0 | 0 | 11:01 | 10:03 | 00:22 | 00:36 | 21066 |
| BOS | 0 | 0 | 0 | 0 | 0 | 0 | 0 | 0 | 1 | 0 | 0 | 0 | 10:50 | 08:16 | 00:00 | 02:34 | 21049 |
| CBJ | 0 | 0 | 0 | 0 | 0 | 1 | 0 | 0 | 0 | 0 | 0 | 0 | 11:21 | 08:58 | 00:00 | 02:23 | 21033 |
| TOR | 0 | 0 | 0 | -1 | 0 | 0 | 0 | 1 | 0 | 0 | 0 | 0 | 07:53 | 07:53 | 00:00 | 00:00 | 21014 |
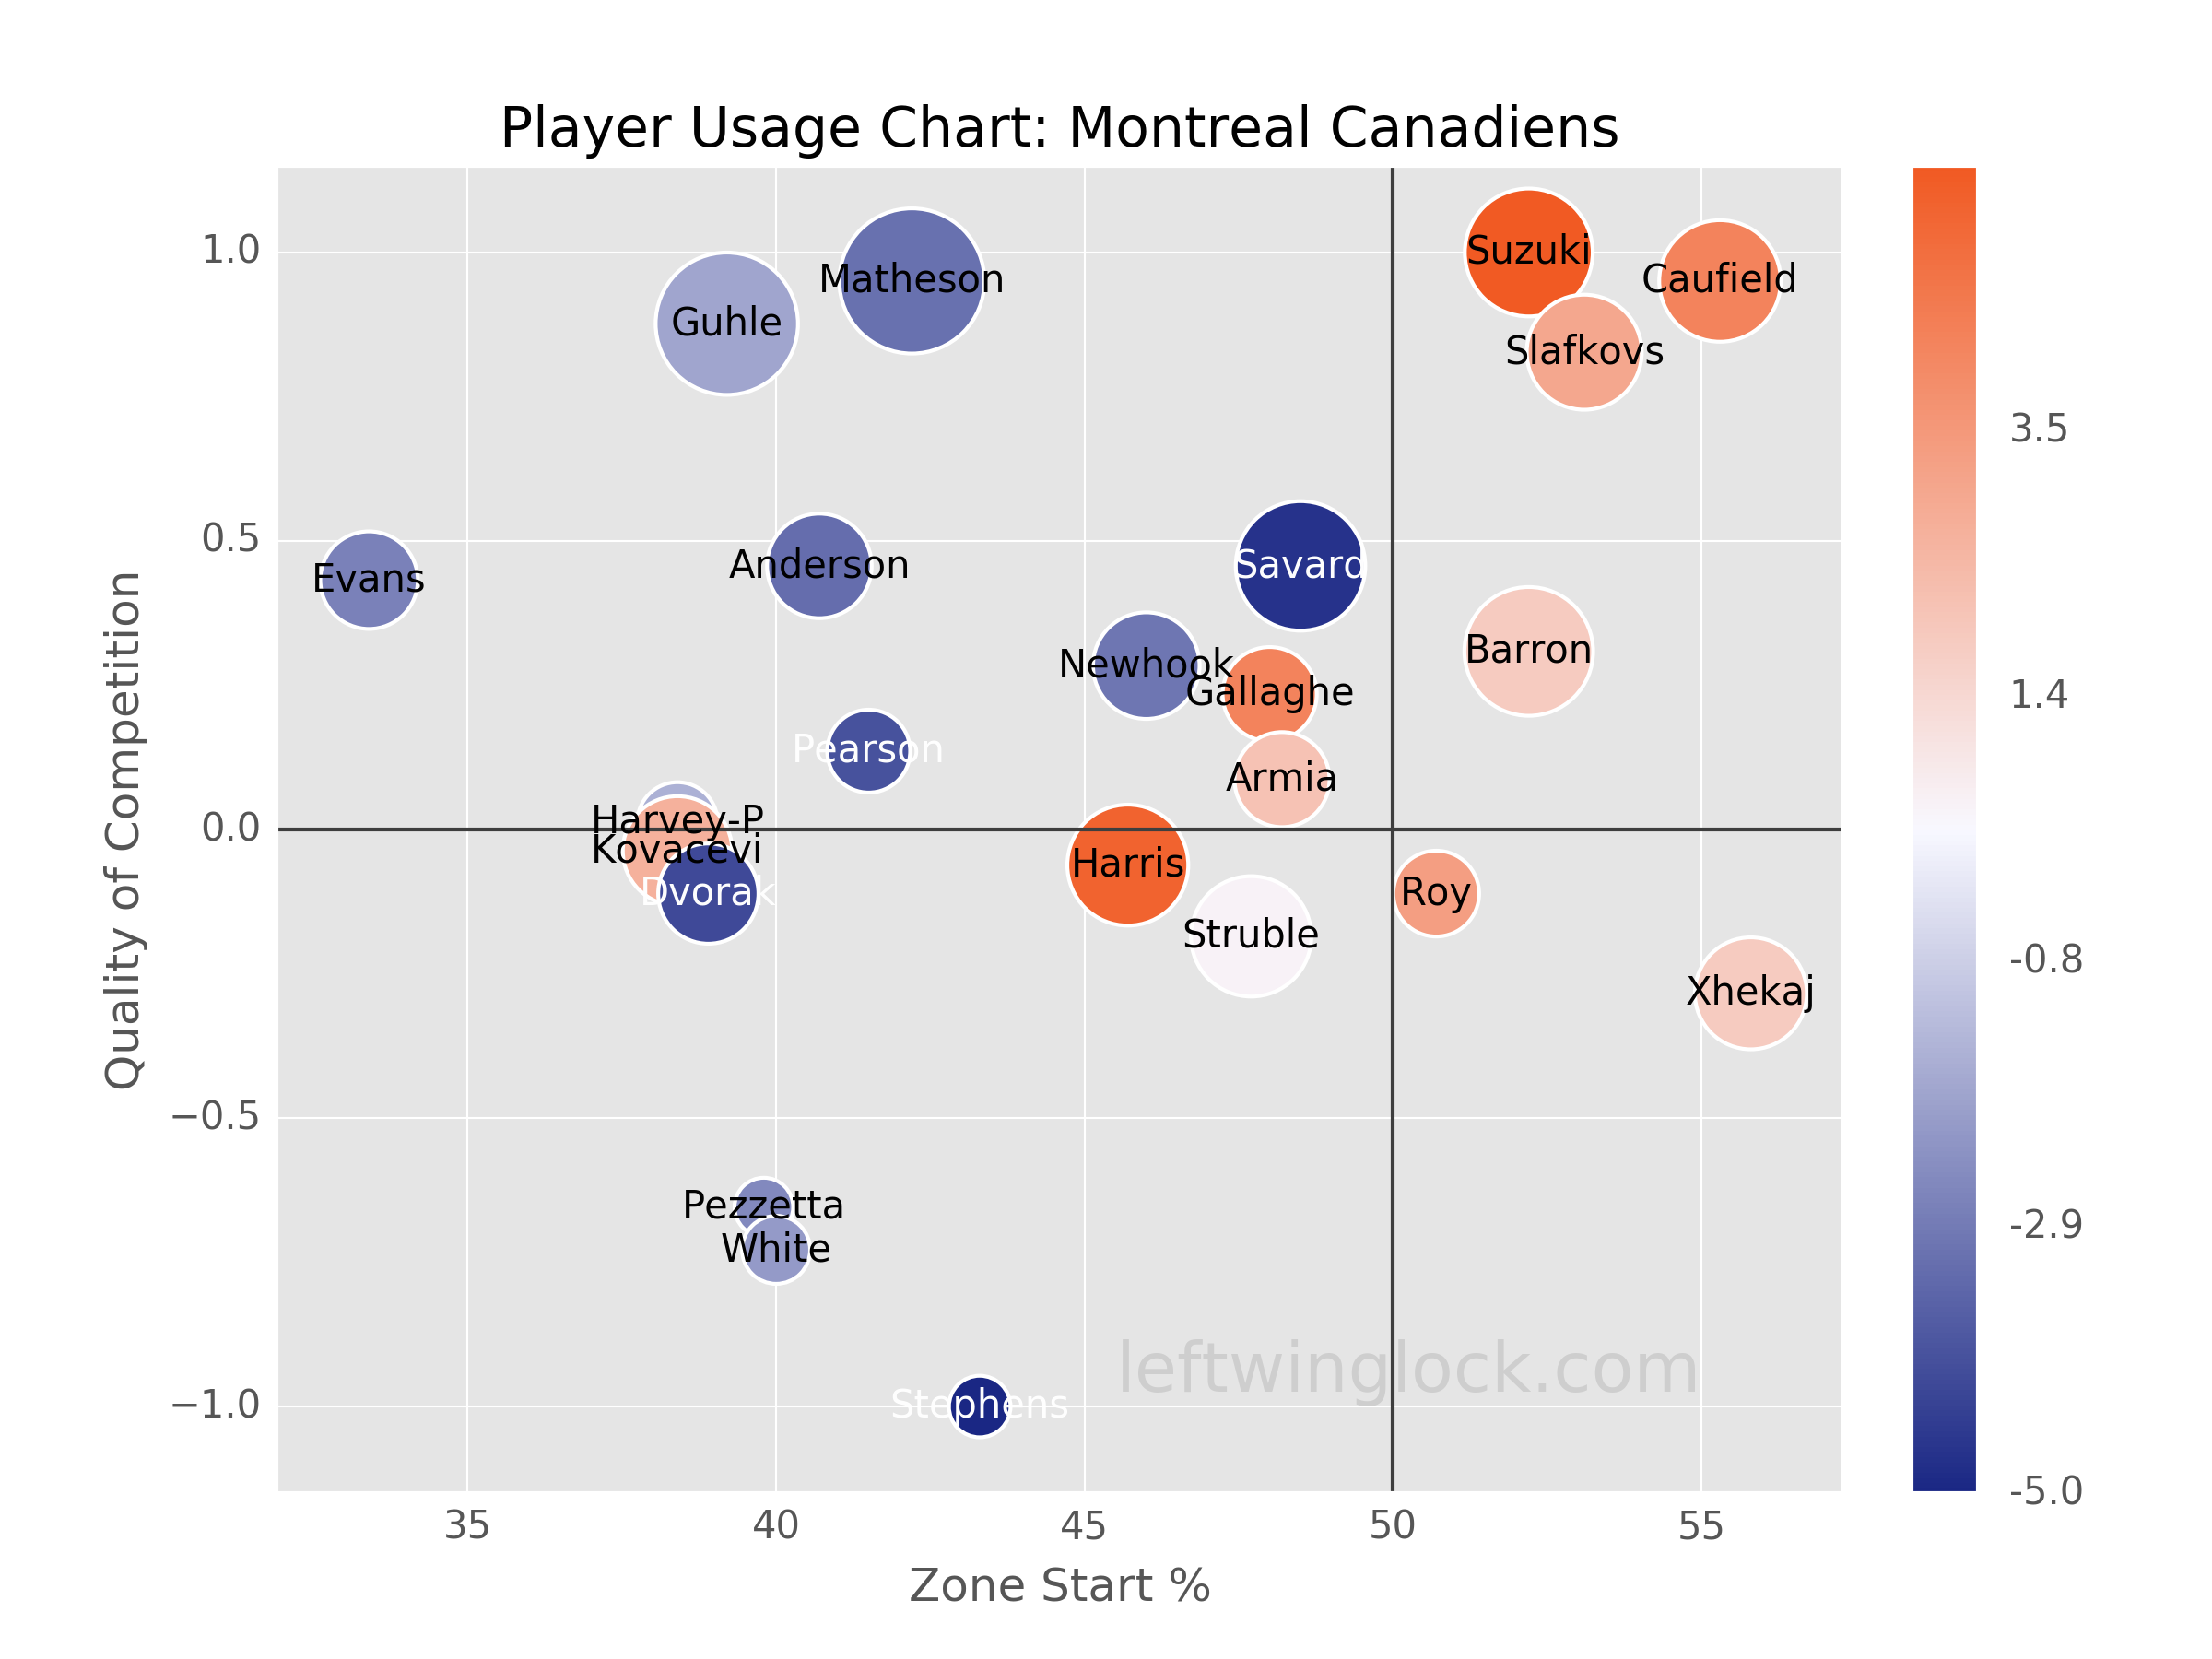
Player Usage Chart / Possession and Luck Chart