TYSON BARRIE
Explore projections, stats, news, player usage charts, and line combinations for members of the Nashville Predators
-
Defenseman Leaders
2023 - 2024
Name G A Pts Quinn
Hughes17 75 92 Cale Makar 21 69 90 Roman Josi 23 62 85 Evan Bouchard 18 64 82 Victor Hedman 13 63 76 Adam Fox 17 56 73 Noah Dobson 10 60 70 Josh Morrissey 10 59 69 Mike Matheson 11 51 62 Rasmus Dahlin 20 39 59 Morgan Rielly 7 51 58 Zach Werenski 11 46 57 -
Player Card

TYSON BARRIE
Nashville Predators2023 - 2024- G 1
- A 14
- PTS 15
- +/- -10
- PIM 16
- PPP 6
- SH% 1.5
- L 23%
- C 0%
- R 78%
-
Nashville Predators Leaders
2023 - 2024
Name G A Pts Filip
Forsberg48 46 94 Roman Josi 23 62 85 Gustav Nyquist 23 52 75 Ryan O'Reilly 26 43 69 Tommy Novak 18 27 45 Luke Evangelista 16 23 39 Colton Sissons 15 20 35 Jason Zucker 14 18 32 Ryan McDonagh 3 29 32 Kiefer Sherwood 10 17 27 Cole Smith 9 14 23 Michael McCarron 12 10 22
News
-
Tyson Barrie
Is expected to be in the lineup for today's game.
Jan 31, 2024 - 12:27 pm -
Tyson Barrie
Is expected to be in the lineup for today's game.
Jan 20, 2024 - 2:38 pm -
Tyson Barrie
Is considered day-to-day with an upper-body injury.
Dec 28, 2023 - 1:05 pm -
Tyson Barrie
Is expected to be in the lineup for today's game.
Dec 9, 2023 - 6:47 pm
Feature
-
Trending
Buy-Low and Sell-High: Skaters
Replies 0
Basic Stats
| Season | Team | GP | G | A | P | +/- | PIM | S | S/GP | SH% | PPP | H | BS | FW | FO% | TOI | EVTOI | PPTOI | PKTOI |
|---|---|---|---|---|---|---|---|---|---|---|---|---|---|---|---|---|---|---|---|
| 23-24 | NSH | 41 | 1 | 14 | 15 | -10 | 16 | 65 | 1.6 | 1.5 | 6 | 14 | 47 | 0 | 0.0 | 18.32 | 15.40 | 2.79 | 0.13 |
| 22-23 | NSH | 85 | 13 | 42 | 55 | -7 | 36 | 163 | 1.9 | 8.0 | 31 | 55 | 90 | 0 | 0.0 | 19.78 | 16.09 | 3.10 | 0.59 |
| 21-22 | EDM | 73 | 7 | 34 | 41 | 3 | 18 | 149 | 2 | 4.7 | 21 | 27 | 73 | 0 | 0.0 | 18.96 | 15.71 | 2.86 | 0.39 |
| 20-21 | EDM | 56 | 8 | 40 | 48 | 4 | 10 | 146 | 2.6 | 5.5 | 23 | 26 | 59 | 0 | 0.0 | 21.40 | 17.78 | 3.49 | 0.12 |
| 19-20 | TOR | 70 | 5 | 34 | 39 | -7 | 16 | 169 | 2.4 | 3.0 | 12 | 47 | 76 | 0 | 0.0 | 21.88 | 19.18 | 2.67 | 0.03 |
Enhanced Stats (5-on-5 unless denoted with *)
| Season | G/60 | A/60 | P/60 | IPP | ΔPEN/60 | 1A | 2A | EVS/60* | PPS/60* | SATF | SAT% | tEVSH% | tEVSV% | SHSV | ZS% |
|---|---|---|---|---|---|---|---|---|---|---|---|---|---|---|---|
| 23-24 | 0.10 | 0.70 | 0.80 | 36 | -0.40 | 4 | 3 | 4.2 | 10.0 | 534 | 43.8 | 8.6 | 0.927 | 1013 | 53.5 |
| 22-23 | 0.37 | 0.60 | 0.96 | 54 | -0.21 | 8 | 5 | 5.1 | 8.4 | 1177 | 47.5 | 7.8 | 0.922 | 1000 | 50.7 |
| 21-22 | 0.22 | 0.71 | 0.92 | 29 | -0.22 | 8 | 5 | 6.0 | 10.4 | 1035 | 50.6 | 9.8 | 0.924 | 1022 | 51.8 |
| 20-21 | 0.25 | 1.12 | 1.37 | 43 | 0.30 | 5 | 13 | 7.4 | 7.1 | 959 | 50.1 | 10.1 | 0.910 | 1011 | 58.2 |
| 19-20 | 0.19 | 0.94 | 1.13 | 42 | -0.12 | 10 | 10 | 6.5 | 6.1 | 1360 | 53.2 | 8.3 | 0.909 | 992 | 57.5 |
Regression Meter
This meter measures whether or not a player's point production is being influenced by luck. Orange indicates the player has been lucky. Dark grey indicates the player has been unlucky.
2A/60
tEVSH%
SH%
IPP
PPSH%
Positional Data
| Season | Team | Left | Center | Right |
|---|---|---|---|---|
| 23-24 | NSH | 23 | 0 | 78 |
| 22-23 | NSH | 45 | 0 | 55 |
| 21-22 | EDM | 0 | 0 | 100 |
| 20-21 | EDM | 0 | 0 | 100 |
| 19-20 | TOR | 0 | 0 | 100 |
Most Common Pairings and Pair Production
See also: Nashville Predators Line Combos | Line Production Tool
| Team | D1 | D2 | GF | GA | GF% | SATF | SATA | SAT% | USATF | USATA | USAT% | SH% | SV% | SHSV | ZS% |
|---|---|---|---|---|---|---|---|---|---|---|---|---|---|---|---|
| NSH | TYSON BARRIE | ROMAN JOSI | 6 | 7 | 46.2 | 141 | 182 | 43.7 | 98 | 133 | 42.4 | 9.0 | 0.926 | 1016 | 61.9 |
| NSH | JEREMY LAUZON | TYSON BARRIE | 3 | 6 | 33.3 | 129 | 147 | 46.7 | 90 | 109 | 45.2 | 4.4 | 0.925 | 969 | 29.8 |
| NSH | TYSON BARRIE | RYAN MCDONAGH | 6 | 3 | 66.7 | 121 | 160 | 43.1 | 91 | 114 | 44.4 | 9.0 | 0.963 | 1053 | 55.9 |
Next Opponent (With Line Matching)
Vancouver Canucks on April 26, 2024 | See also: Line Matching Tool
*** You are seeing no results because these teams have not played yet this season or TYSON BARRIE was likely ill, injured, or scratched for the previous matchup. ***| FORWARD 1 | FORWARD 2 | FORWARD 3 | Frequency |
|---|
Most Recent 10 Games
| OPP | G | A | P | +/- | PIM | SOG | SH% | H | BS | FW | FL | FO% | TOI | EVTOI | PPTOI | PKTOI | ID |
|---|---|---|---|---|---|---|---|---|---|---|---|---|---|---|---|---|---|
| ARI | 0 | 1 | 1 | -3 | 0 | 2 | 0 | 1 | 0 | 0 | 0 | 0 | 18:29 | 16:36 | 01:53 | 00:00 | 21161 |
| VGK | 0 | 0 | 0 | 0 | 2 | 2 | 0 | 1 | 3 | 0 | 0 | 0 | 17:19 | 14:50 | 02:29 | 00:00 | 21141 |
| DET | 0 | 0 | 0 | 0 | 0 | 2 | 0 | 1 | 2 | 0 | 0 | 0 | 17:25 | 15:54 | 01:27 | 00:04 | 21116 |
| FLA | 0 | 1 | 1 | 1 | 0 | 3 | 0 | 0 | 0 | 0 | 0 | 0 | 18:31 | 13:57 | 04:00 | 00:34 | 21101 |
| SJS | 0 | 1 | 1 | 2 | 0 | 2 | 0 | 0 | 2 | 0 | 0 | 0 | 18:44 | 16:16 | 02:28 | 00:00 | 21088 |
| SEA | 0 | 0 | 0 | 0 | 0 | 2 | 0 | 1 | 1 | 0 | 0 | 0 | 15:18 | 14:19 | 00:59 | 00:00 | 21071 |
| DAL | 0 | 0 | 0 | -3 | 0 | 1 | 0 | 0 | 0 | 0 | 0 | 0 | 19:13 | 16:47 | 02:26 | 00:00 | 20847 |
| NJD | 0 | 0 | 0 | 0 | 0 | 3 | 0 | 1 | 3 | 0 | 0 | 0 | 20:40 | 17:16 | 03:24 | 00:00 | 20831 |
| ARI | 0 | 1 | 1 | 1 | 0 | 2 | 0 | 1 | 0 | 0 | 0 | 0 | 19:14 | 15:07 | 03:50 | 00:17 | 20815 |
| TBL | 0 | 0 | 0 | -1 | 0 | 1 | 0 | 0 | 0 | 0 | 0 | 0 | 21:18 | 16:02 | 05:01 | 00:15 | 20001 |
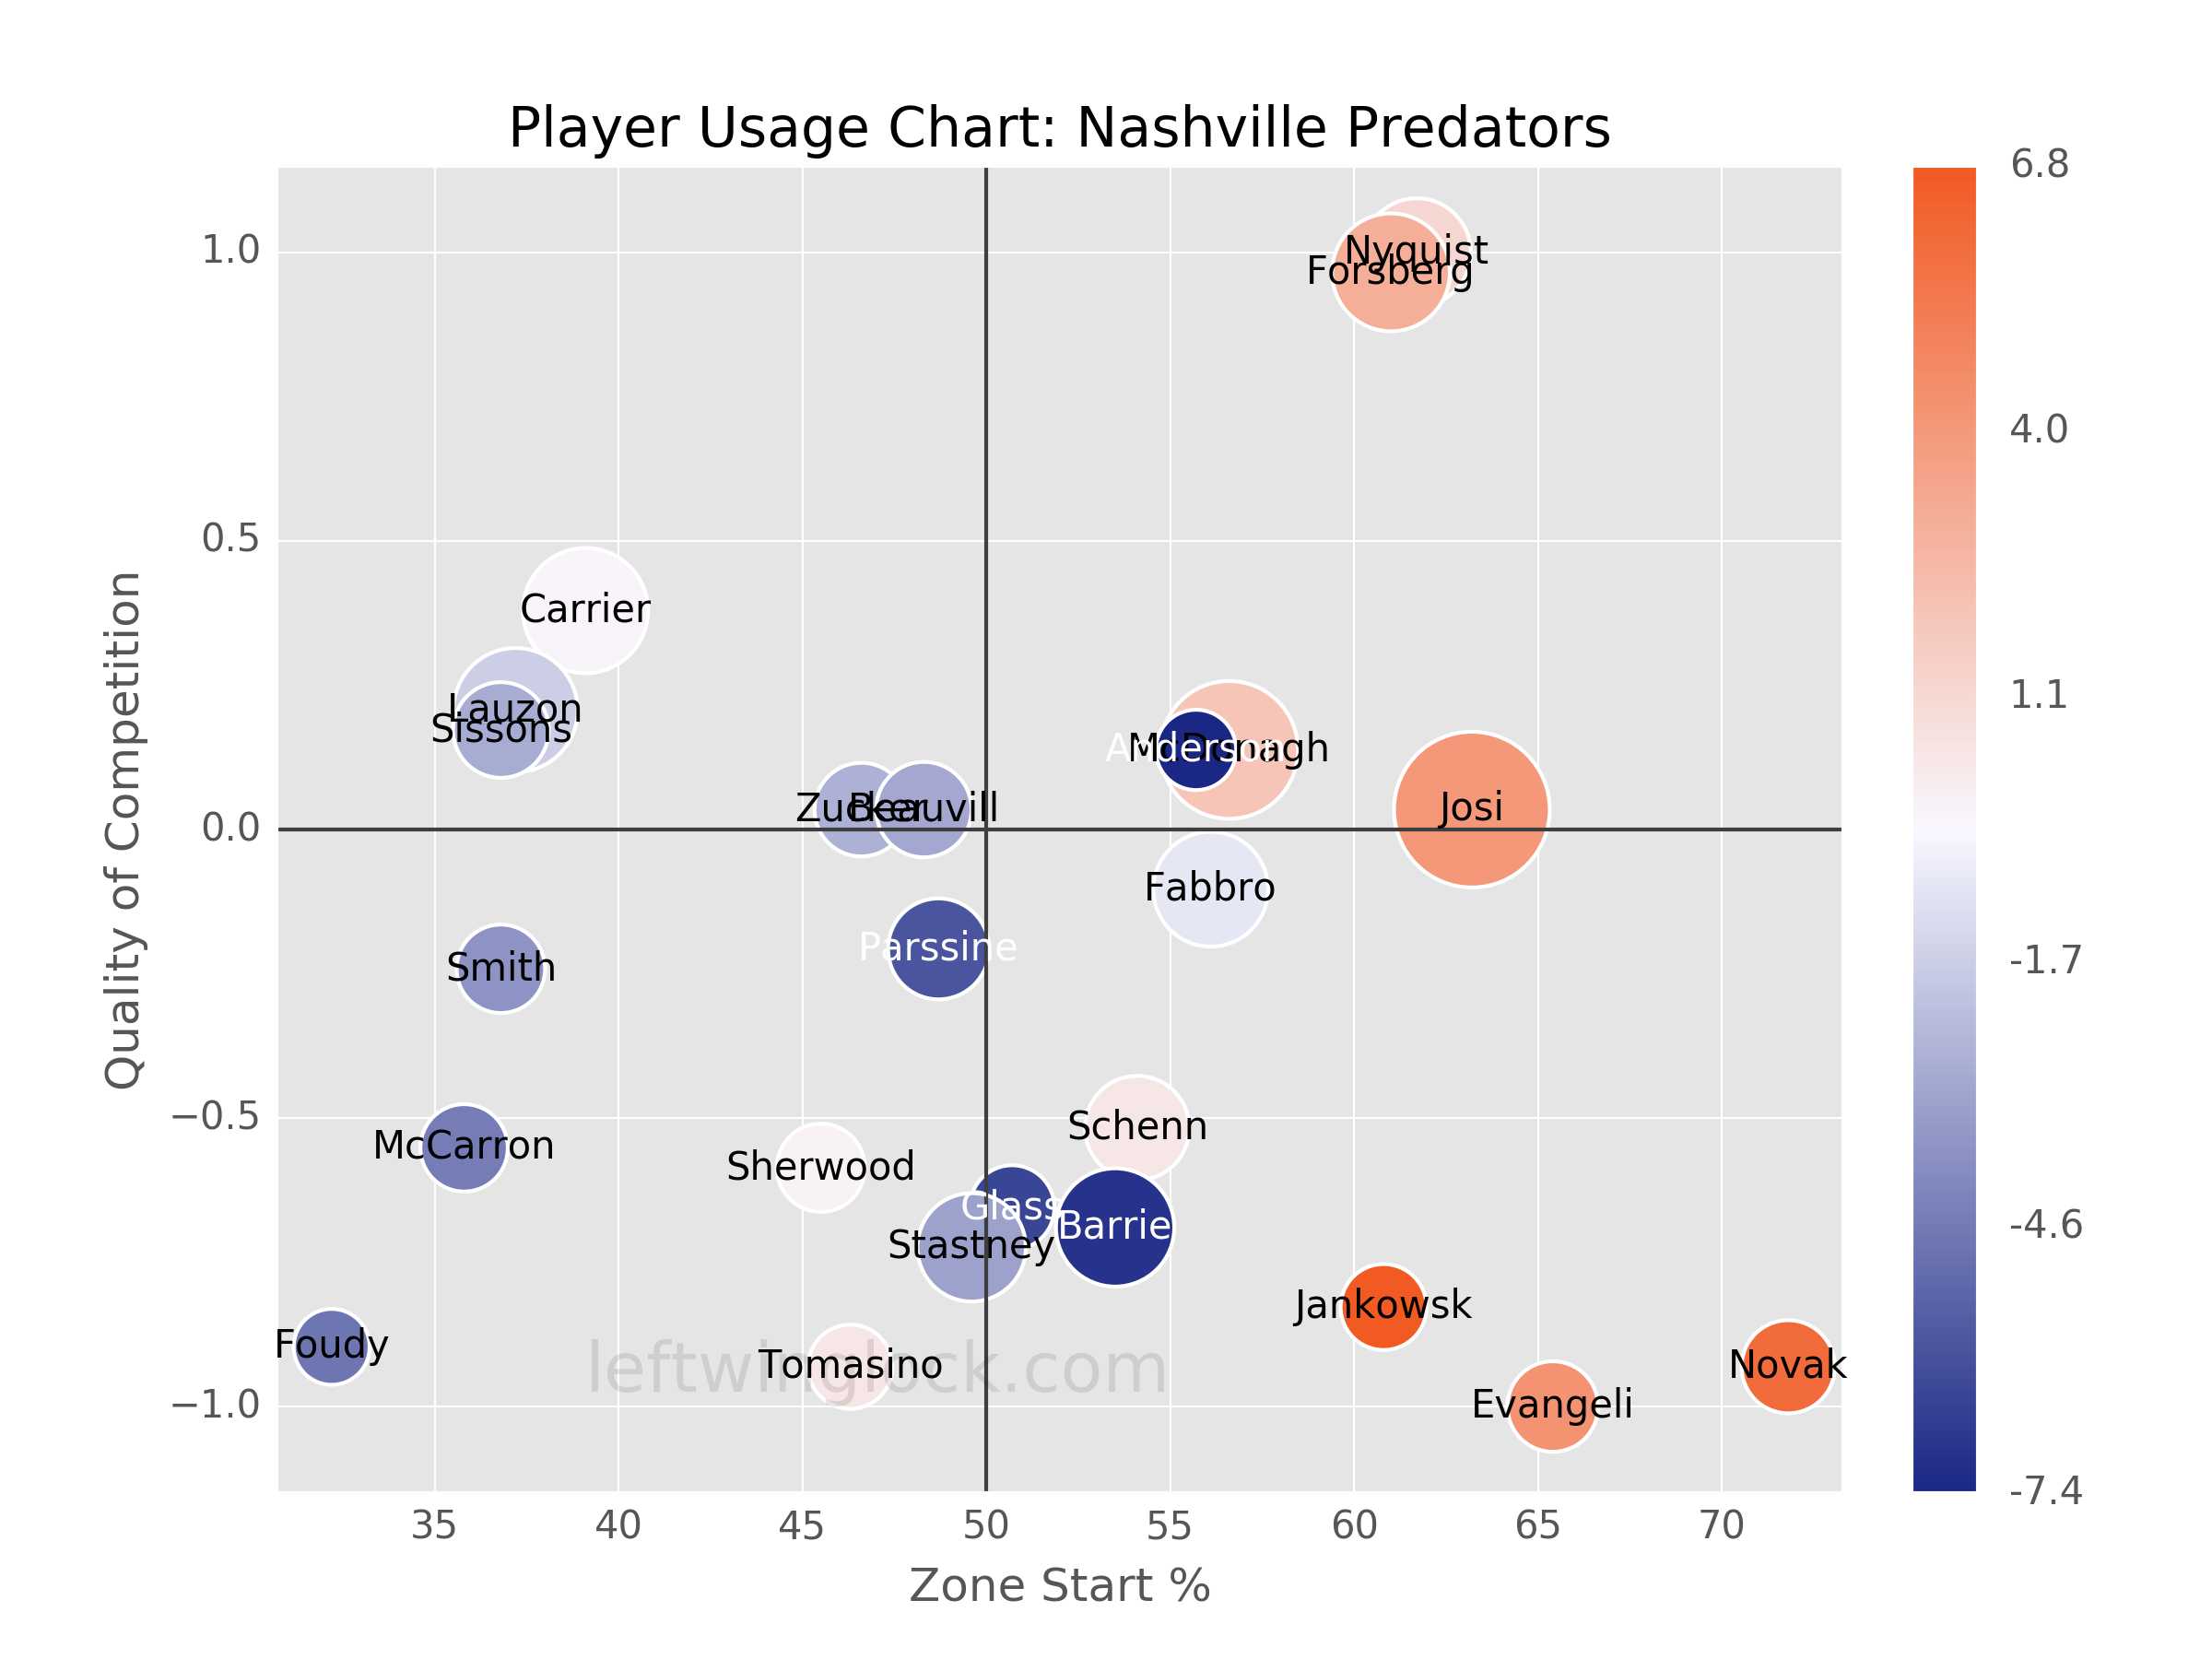
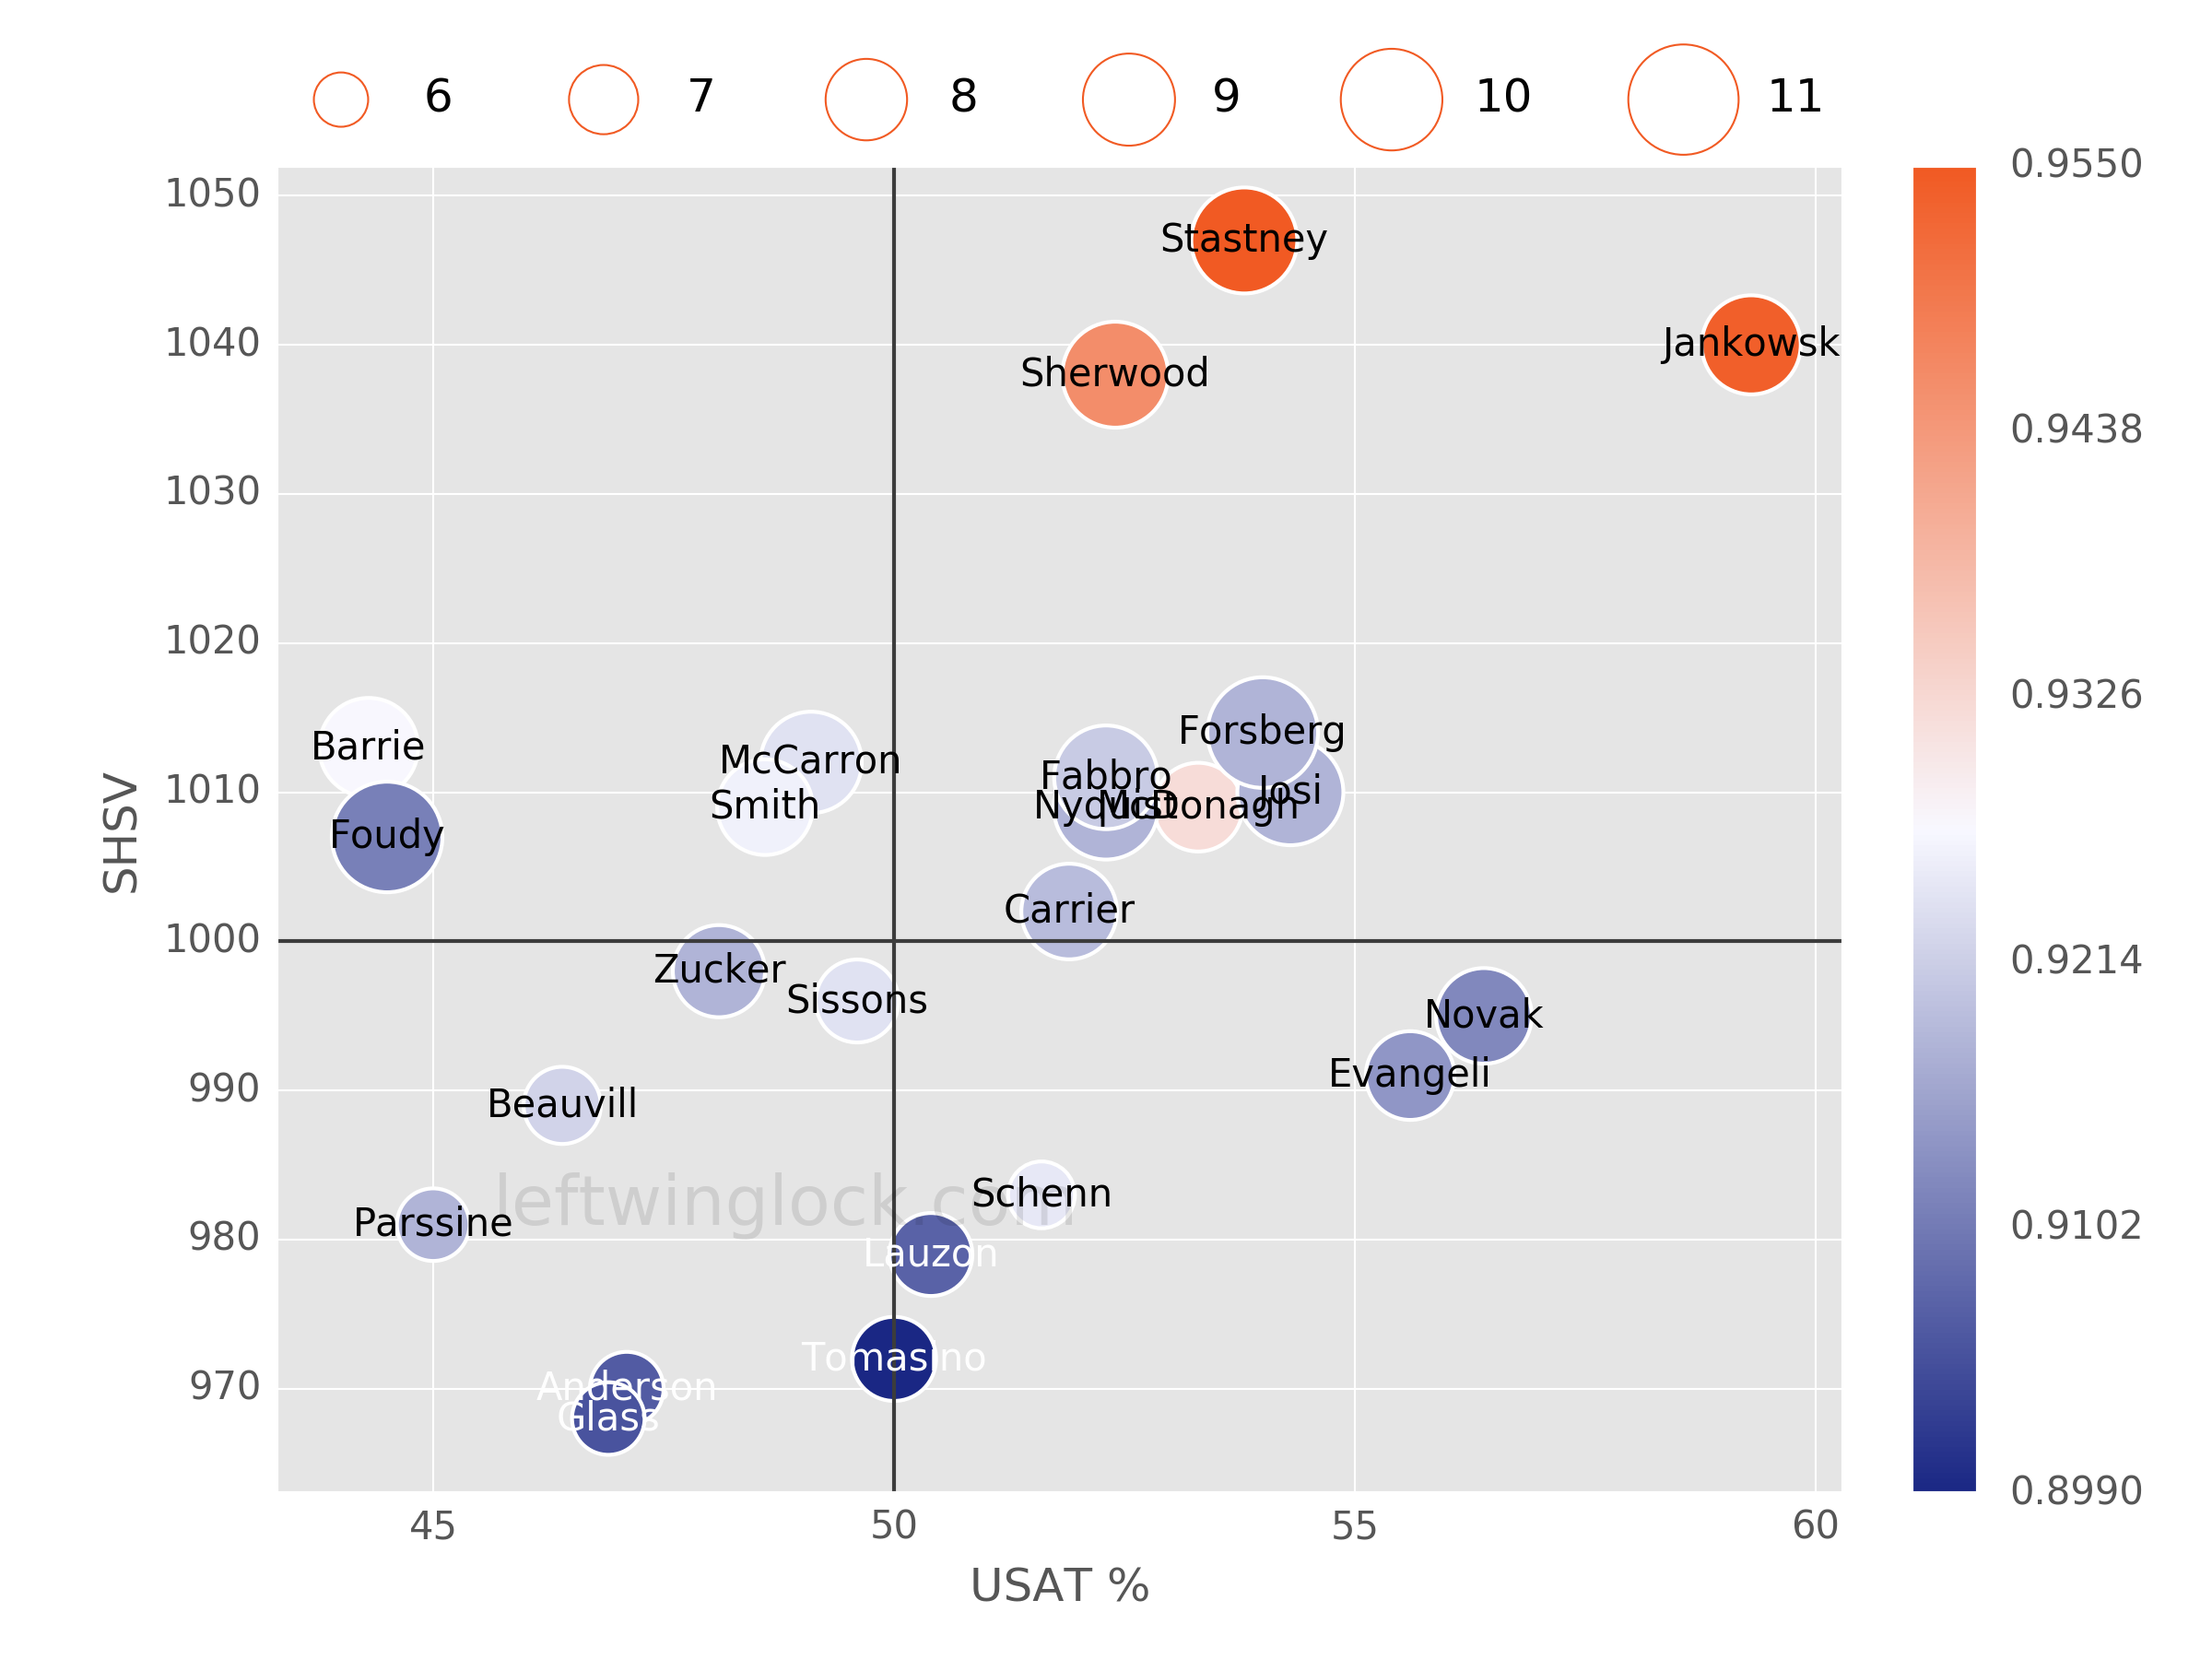
Player Usage Chart / Possession and Luck Chart