Alex Wennberg
Explore projections, stats, news, player usage charts, and line combinations for members of the San Jose Sharks
-
Center Leaders
2023 - 2024
Name PPG PPA PPP Nathan
MacKinnon10 38 48 Connor McDavid 7 37 44 J.T. Miller 10 30 40 Leon Draisaitl 21 18 39 Steven Stamkos 19 20 39 Sam Reinhart 27 7 34 Brayden Point 15 17 32 Sebastian Aho 11 21 32 Elias Pettersson 13 18 31 Mika Zibanejad 12 19 31 Nick Suzuki 12 19 31 Jack Hughes 9 22 31 -
Player Card
-
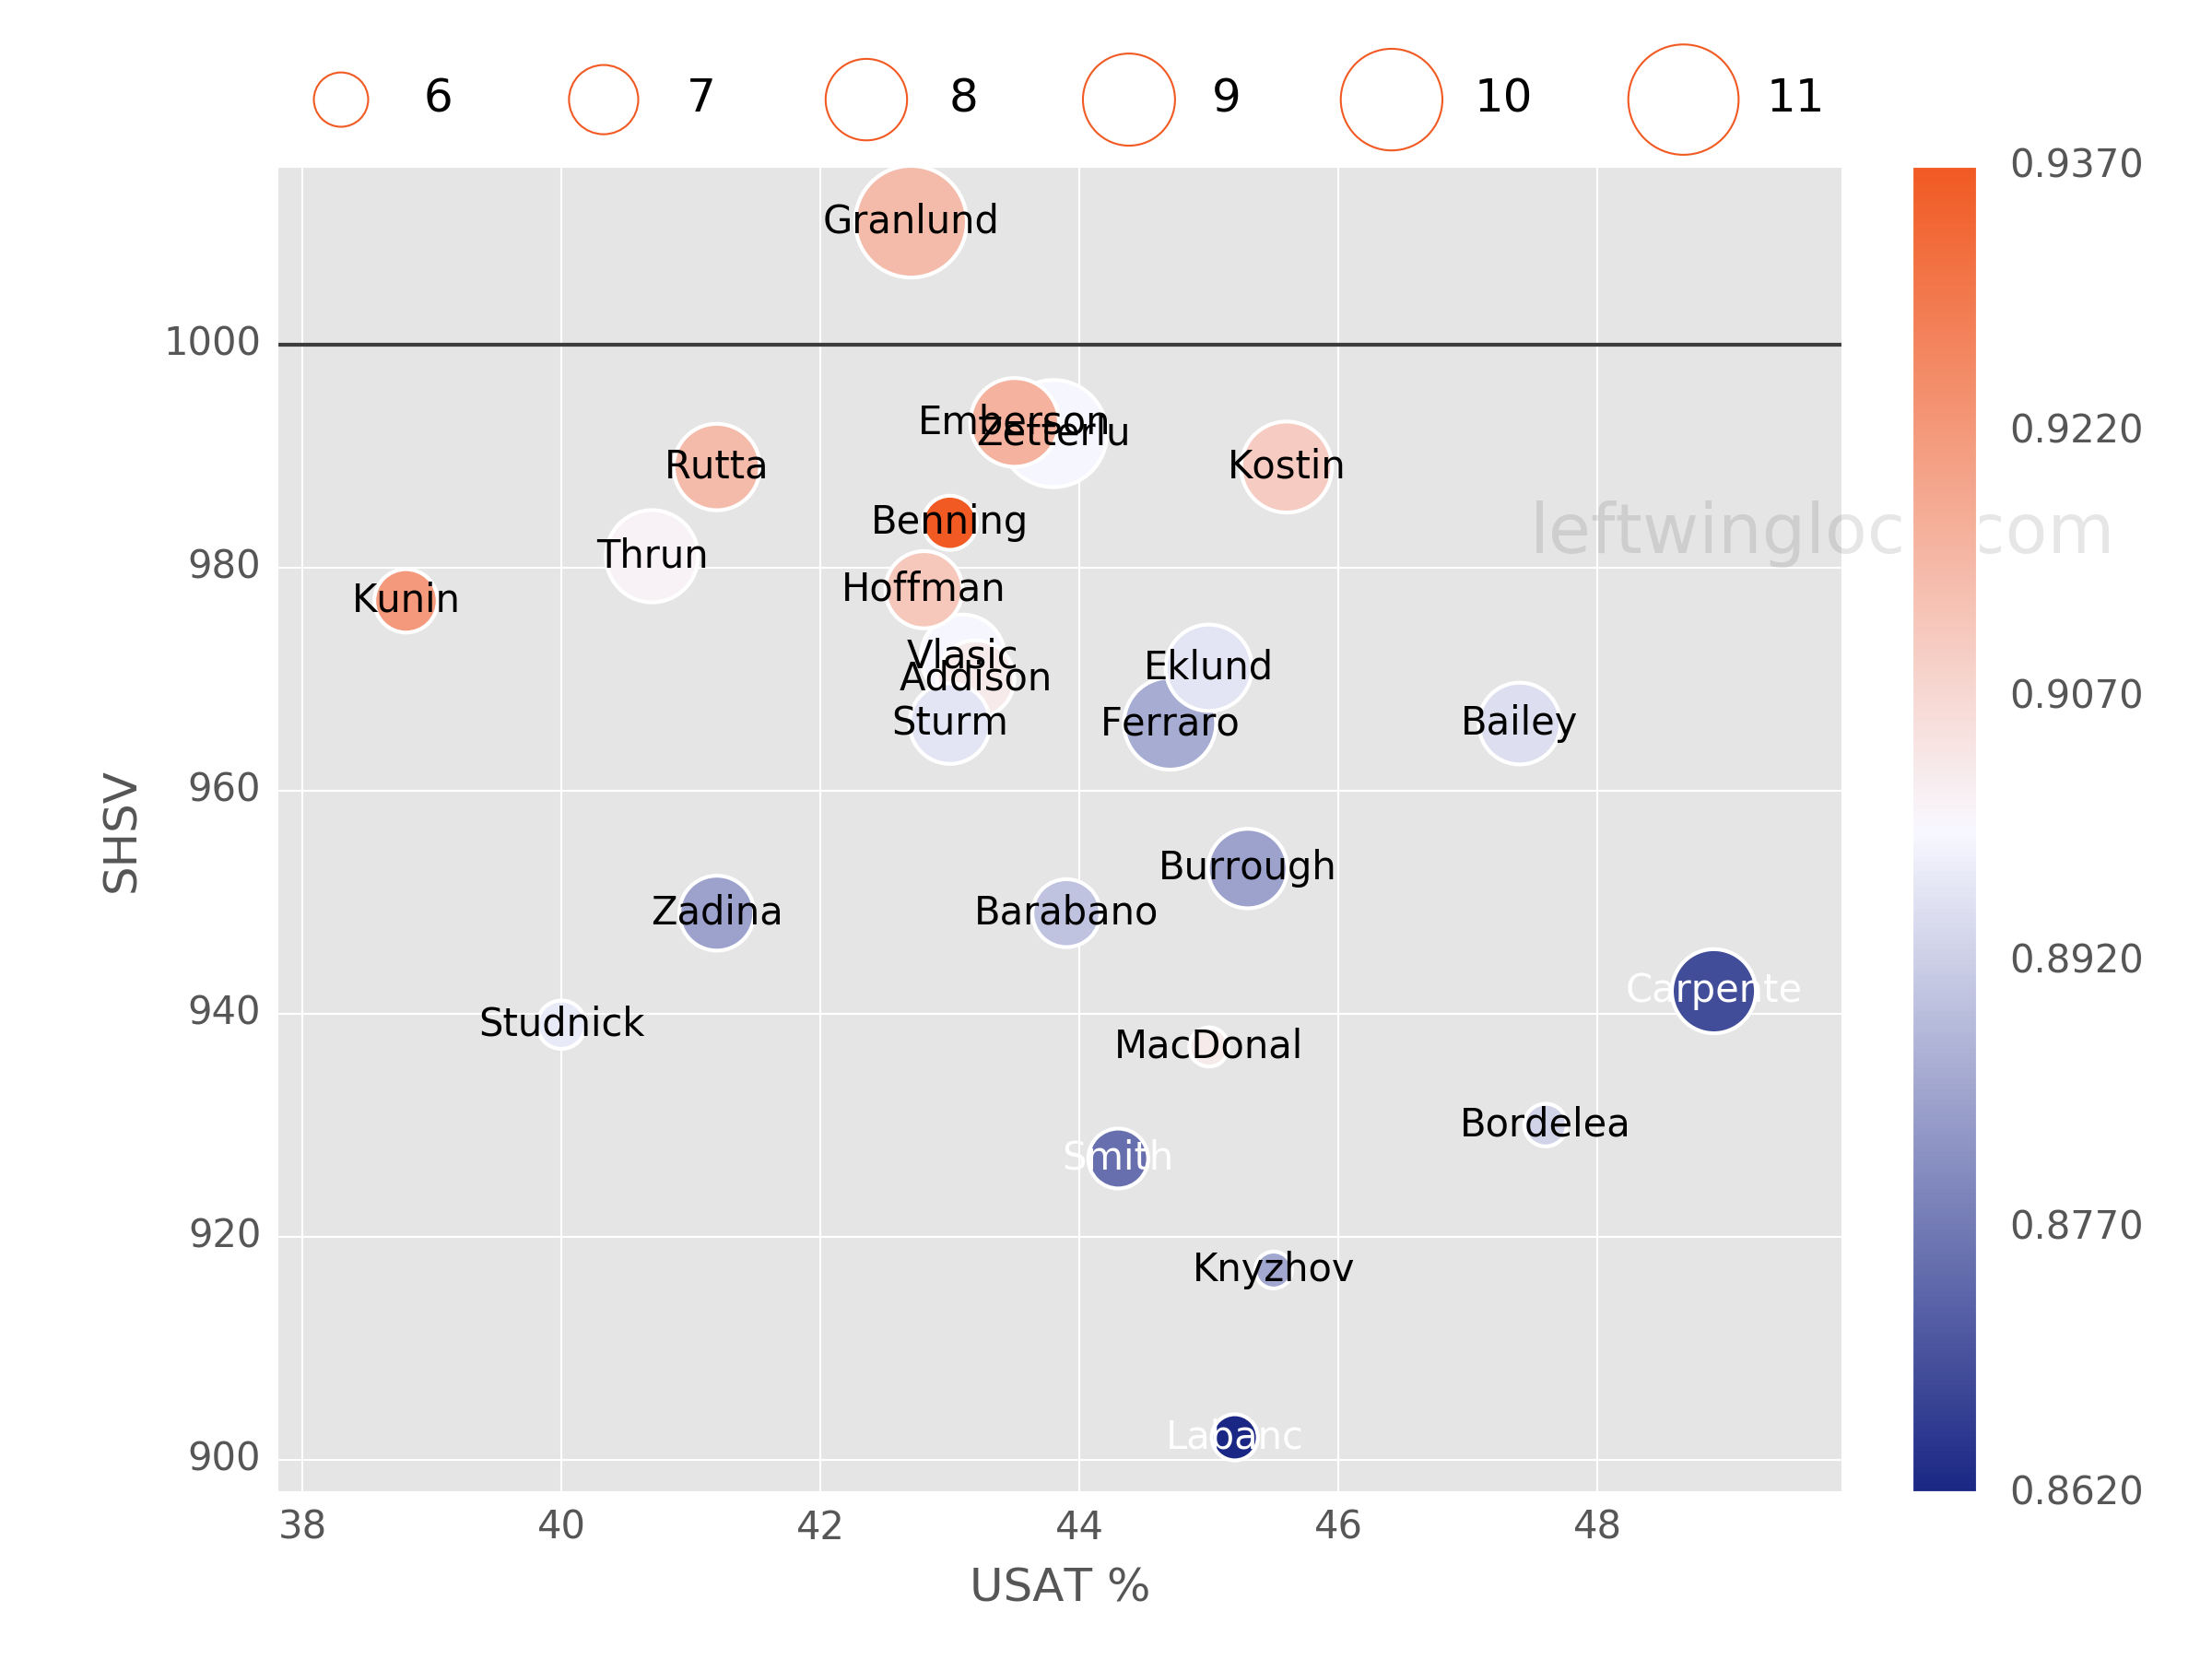
San Jose Sharks Leaders
2023 - 2024
Name G A Pts Mikael
Granlund12 48 60 William Eklund 16 29 45 Fabian Zetterlund 24 20 44 Filip Zadina 13 10 23 Mike Hoffman 10 13 23 Mario Ferraro 3 18 21 Jan Rutta 5 14 19 Luke Kunin 11 7 18 Calen Addison 1 16 17 Klim Kostin 8 6 14 Justin Bailey 5 9 14 Nico Sturm 5 8 13

News
-
Alex Wennberg
Has signed a two-year contract with the San Jose Sharks.
Jul 1, 2024 - 3:49 pm -
Alex Wennberg
Will miss tonight's game due to personal reasons.
Mar 26, 2024 - 6:30 pm -
Alex Wennberg
Has been traded to the New York Rangers in exchange for a 2024 2nd round draft pick and a 2025 4th round draft pick.
Mar 6, 2024 - 3:57 pm -
Alex Wennberg
Will be held out of tonight's game for trade-related reasons.
Mar 5, 2024 - 6:43 pm
Feature
-
Trending
Buy-Low and Sell-High: Skaters
Replies 0
Basic Stats
| Season | Team | GP | G | A | P | +/- | PIM | S | S/GP | SH% | PPP | H | BS | FW | FO% | TOI | EVTOI | PPTOI | PKTOI |
|---|---|---|---|---|---|---|---|---|---|---|---|---|---|---|---|---|---|---|---|
| 23-24 | NYR | 79 | 10 | 20 | 30 | 0 | 14 | 90 | 1.1 | 11.1 | 6 | 46 | 75 | 552 | 46.5 | 17.99 | 14.13 | 1.76 | 2.10 |
| 22-23 | SEA | 82 | 13 | 25 | 38 | -7 | 20 | 101 | 1.2 | 12.9 | 9 | 43 | 63 | 627 | 45.6 | 18.69 | 14.05 | 2.28 | 2.36 |
| 21-22 | SEA | 80 | 11 | 26 | 37 | -26 | 28 | 95 | 1.2 | 11.6 | 6 | 47 | 44 | 555 | 46.6 | 17.85 | 14.99 | 2.07 | 0.79 |
| 20-21 | FLA | 56 | 17 | 12 | 29 | 6 | 8 | 82 | 1.5 | 20.7 | 6 | 29 | 36 | 388 | 49.2 | 18.17 | 13.70 | 1.92 | 2.55 |
| 19-20 | CBJ | 57 | 5 | 17 | 22 | -5 | 16 | 72 | 1.3 | 6.9 | 5 | 21 | 31 | 309 | 46.0 | 16.68 | 13.11 | 2.08 | 1.49 |
Enhanced Stats (5-on-5 unless denoted with *)
| Season | G/60 | A/60 | P/60 | IPP | ΔPEN/60 | 1A | 2A | EVS/60* | PPS/60* | SATF | SAT% | tEVSH% | tEVSV% | SHSV | ZS% |
|---|---|---|---|---|---|---|---|---|---|---|---|---|---|---|---|
| 23-24 | 0.35 | 0.93 | 1.28 | 49 | 0.46 | 9 | 7 | 3.6 | 7.3 | 968 | 48.9 | 9.4 | 0.918 | 1012 | 45.1 |
| 22-23 | 0.38 | 0.99 | 1.37 | 58 | 0.04 | 11 | 7 | 3.9 | 8.0 | 1016 | 52.7 | 7.8 | 0.896 | 974 | 50.6 |
| 21-22 | 0.43 | 0.96 | 1.38 | 67 | -0.08 | 11 | 7 | 3.7 | 7.6 | 978 | 50.9 | 7.4 | 0.900 | 974 | 47.4 |
| 20-21 | 0.85 | 0.68 | 1.53 | 46 | 0.47 | 5 | 3 | 4.5 | 7.2 | 635 | 52.5 | 10.2 | 0.903 | 1005 | 56.6 |
| 19-20 | 0.33 | 1.00 | 1.33 | 71 | 0.38 | 5 | 7 | 4.4 | 6.6 | 631 | 50.0 | 6.0 | 0.934 | 994 | 48.7 |
Regression Meter
This meter measures whether or not a player's point production is being influenced by luck. Orange indicates the player has been lucky. Dark grey indicates the player has been unlucky.
Positional Data
| Season | Team | Left | Center | Right |
|---|---|---|---|---|
| 22-23 | SEA | 0 | 100 | 0 |
| 21-22 | SEA | 0 | 100 | 0 |
| 20-21 | FLA | 0 | 100 | 0 |
| 19-20 | CBJ | 11 | 87 | 2 |
Most Common Linemates and Line Production
See also: San Jose Sharks Line Combo Tool | Line Production Tool
| Team | F1 | F2 | F3 | GF | GA | GF% | SATF | SATA | SAT% | USATF | USATA | USAT% | SH% | SV% | SHSV | ZS% |
|---|---|---|---|---|---|---|---|---|---|---|---|---|---|---|---|---|
| SEA | BURAKOVSKY | SCHWARTZ | WENNBERG | 1 | 5 | 16.7 | 137 | 108 | 55.9 | 84 | 80 | 51.2 | 1.7 | 0.919 | 936 | 54.3 |
| SEA | BJORKSTRAND | SCHWARTZ | WENNBERG | 4 | 2 | 66.7 | 100 | 107 | 48.3 | 72 | 73 | 49.7 | 7.4 | 0.955 | 1029 | 45.2 |
| SEA | TANEV | SCHWARTZ | WENNBERG | 7 | 2 | 77.8 | 93 | 76 | 55.0 | 71 | 51 | 58.2 | 15.2 | 0.943 | 1095 | 50.0 |
Most Recent 10 Games
| OPP | G | A | P | +/- | PIM | SOG | SH% | H | BS | FW | FL | FO% | TOI | EVTOI | PPTOI | PKTOI | ID |
|---|---|---|---|---|---|---|---|---|---|---|---|---|---|---|---|---|---|
| EDM | 0 | 0 | 0 | -1 | 0 | 1 | 0 | 1 | 1 | 17 | 7 | 71 | 21:18 | 15:45 | 03:27 | 02:06 | 20958 |
| PIT | 1 | 1 | 2 | 1 | 0 | 3 | 33.3 | 0 | 1 | 8 | 7 | 53 | 18:35 | 12:05 | 02:45 | 03:45 | 20950 |
| BOS | 0 | 1 | 1 | 0 | 0 | 2 | 0 | 1 | 1 | 5 | 9 | 36 | 23:07 | 16:39 | 05:21 | 01:07 | 20926 |
| MIN | 0 | 0 | 0 | -1 | 0 | 2 | 0 | 0 | 0 | 14 | 15 | 48 | 20:45 | 09:19 | 06:03 | 05:23 | 20913 |
| VAN | 0 | 0 | 0 | 1 | 0 | 0 | 0 | 0 | 2 | 7 | 10 | 41 | 18:40 | 11:51 | 02:15 | 04:34 | 20897 |
| DET | 0 | 0 | 0 | 0 | 0 | 1 | 0 | 1 | 1 | 8 | 12 | 40 | 16:45 | 14:13 | 01:36 | 00:56 | 20870 |
| BOS | 0 | 1 | 1 | 0 | 0 | 3 | 0 | 3 | 2 | 8 | 3 | 73 | 18:02 | 14:53 | 01:03 | 02:06 | 20837 |
| NYI | 0 | 0 | 0 | 0 | 0 | 2 | 0 | 1 | 0 | 6 | 9 | 40 | 18:07 | 14:45 | 00:45 | 02:37 | 20829 |
| NJD | 0 | 0 | 0 | 0 | 2 | 0 | 0 | 2 | 1 | 8 | 13 | 38 | 19:40 | 13:04 | 02:27 | 04:09 | 20819 |
| PHI | 0 | 1 | 1 | 0 | 0 | 1 | 0 | 2 | 1 | 13 | 10 | 57 | 19:00 | 11:28 | 03:24 | 04:08 | 20813 |
Player Usage Chart / Possession and Luck Chart