Anthony Cirelli
Explore projections, stats, news, player usage charts, and line combinations for members of the Tampa Bay Lightning
-
Center Leaders
2023 - 2024
Name G A Pts Nathan
MacKinnon51 89 140 Connor McDavid 32 100 132 Auston Matthews 69 38 107 Leon Draisaitl 41 65 106 J.T. Miller 37 66 103 Sam Reinhart 57 37 94 Sidney Crosby 42 52 94 Brayden Point 46 44 90 Sebastian Aho 36 53 89 Elias Pettersson 34 55 89 Robert Thomas 26 60 86 Steven Stamkos 40 41 81 -
Player Card

Anthony Cirelli
Tampa Bay Lightning2023 - 2024- G 20
- A 25
- PTS 45
- +/- 2
- PIM 38
- PPP 7
- SH% 15.5
- L 0%
- C 100%
- R 0%
-
Tampa Bay Lightning Leaders
2023 - 2024
Name G A Pts Nikita
Kucherov44 100 144 Brayden Point 46 44 90 Steven Stamkos 40 41 81 Victor Hedman 13 63 76 Brandon Hagel 26 49 75 Nicholas Paul 24 22 46 Anthony Cirelli 20 25 45 Anthony Duclair 24 18 42 Darren Raddysh 6 27 33 Michael Eyssimont 11 14 25 Nick Perbix 2 22 24 Mikhail Sergachev 2 17 19
News
-
Anthony Cirelli
Is not expected to be in the lineup for today's game.
Apr 17, 2024 - 6:35 pm -
Anthony Cirelli
Is not expected to be in the lineup for today's game.
Apr 6, 2024 - 11:51 am -
Anthony Cirelli
Is on the ice for warmups.
Nov 20, 2023 - 6:30 pm -
Anthony Cirelli
Is on the ice for practice.
Nov 19, 2023 - 11:10 am
Feature
-
Trending
Buy-Low and Sell-High: Skaters
Replies 0
Basic Stats
| Season | Team | GP | G | A | P | +/- | PIM | S | S/GP | SH% | PPP | H | BS | FW | FO% | TOI | EVTOI | PPTOI | PKTOI |
|---|---|---|---|---|---|---|---|---|---|---|---|---|---|---|---|---|---|---|---|
| 23-24 | TBL | 79 | 20 | 25 | 45 | 2 | 38 | 129 | 1.6 | 15.5 | 7 | 64 | 75 | 460 | 49.2 | 18.52 | 14.92 | 1.43 | 2.17 |
| 22-23 | TBL | 58 | 11 | 18 | 29 | 13 | 33 | 111 | 1.9 | 9.9 | 2 | 34 | 46 | 427 | 51.4 | 16.56 | 13.66 | 0.56 | 2.34 |
| 21-22 | TBL | 76 | 17 | 26 | 43 | 15 | 70 | 146 | 1.9 | 11.6 | 8 | 75 | 67 | 441 | 46.5 | 18.31 | 14.79 | 1.42 | 2.10 |
| 20-21 | TBL | 50 | 9 | 13 | 22 | 0 | 10 | 75 | 1.5 | 12.0 | 4 | 64 | 32 | 227 | 49.1 | 17.75 | 13.78 | 1.93 | 2.04 |
| 19-20 | TBL | 68 | 16 | 28 | 44 | 28 | 30 | 113 | 1.7 | 14.2 | 5 | 89 | 47 | 434 | 47.5 | 18.46 | 14.69 | 0.95 | 2.82 |
Enhanced Stats (5-on-5 unless denoted with *)
| Season | G/60 | A/60 | P/60 | IPP | ΔPEN/60 | 1A | 2A | EVS/60* | PPS/60* | SATF | SAT% | tEVSH% | tEVSV% | SHSV | ZS% |
|---|---|---|---|---|---|---|---|---|---|---|---|---|---|---|---|
| 23-24 | 0.60 | 0.88 | 1.48 | 55 | 0.53 | 7 | 9 | 5.6 | 4.3 | 1119 | 52.3 | 9.6 | 0.890 | 986 | 42.6 |
| 22-23 | 0.57 | 1.13 | 1.70 | 62 | 0.56 | 10 | 4 | 7.3 | 5.5 | 722 | 50.8 | 9.1 | 0.938 | 1029 | 43.0 |
| 21-22 | 0.57 | 0.92 | 1.49 | 61 | 0.78 | 11 | 5 | 6.3 | 7.8 | 990 | 53.6 | 8.6 | 0.917 | 1003 | 44.1 |
| 20-21 | 0.28 | 0.94 | 1.23 | 68 | 0.54 | 3 | 7 | 5.2 | 4.4 | 560 | 52.1 | 6.1 | 0.913 | 974 | 50.1 |
| 19-20 | 0.71 | 1.15 | 1.86 | 59 | 0.86 | 13 | 5 | 5.7 | 6.5 | 840 | 52.0 | 10.7 | 0.946 | 1053 | 45.2 |
Regression Meter
This meter measures whether or not a player's point production is being influenced by luck. Orange indicates the player has been lucky. Dark grey indicates the player has been unlucky.
2A/60
tEVSH%
SH%
IPP
PPSH%
Positional Data
| Season | Team | Left | Center | Right |
|---|---|---|---|---|
| 23-24 | TBL | 0 | 100 | 0 |
| 22-23 | TB | 32 | 66 | 2 |
| 21-22 | TB | 1 | 75 | 24 |
| 20-21 | TB | 0 | 85 | 15 |
| 19-20 | TB | 0 | 100 | 0 |
Most Common Linemates and Line Production
See also: Tampa Bay Lightning Line Combo Tool | Line Production Tool
| Team | F1 | F2 | F3 | GF | GA | GF% | SATF | SATA | SAT% | USATF | USATA | USAT% | SH% | SV% | SHSV | ZS% |
|---|---|---|---|---|---|---|---|---|---|---|---|---|---|---|---|---|
| TBL | HAGEL | CIRELLI | STAMKOS | 12 | 20 | 37.5 | 251 | 289 | 46.5 | 170 | 199 | 46.1 | 9.8 | 0.850 | 947 | 34.3 |
| TBL | HAGEL | CIRELLI | PAUL | 10 | 9 | 52.6 | 144 | 121 | 54.3 | 102 | 85 | 54.5 | 15.2 | 0.852 | 1004 | 34.0 |
| TBL | HAGEL | EYSSIMONT | CIRELLI | 0 | 1 | 0.0 | 95 | 69 | 57.9 | 66 | 52 | 55.9 | 0.0 | 0.969 | 969 | 66.7 |
Most Recent 10 Games
| OPP | G | A | P | +/- | PIM | SOG | SH% | H | BS | FW | FL | FO% | TOI | EVTOI | PPTOI | PKTOI | ID |
|---|---|---|---|---|---|---|---|---|---|---|---|---|---|---|---|---|---|
| FLA | 0 | 0 | 0 | -3 | 0 | 2 | 0 | 3 | 0 | 3 | 6 | 33 | 20:14 | 14:13 | 01:13 | 04:48 | 30115 |
| FLA | 0 | 1 | 1 | 1 | 0 | 0 | 0 | 5 | 1 | 6 | 8 | 43 | 16:47 | 14:58 | 00:42 | 01:07 | 30114 |
| FLA | 0 | 0 | 0 | -3 | 0 | 0 | 0 | 9 | 5 | 2 | 4 | 33 | 18:52 | 17:41 | 01:11 | 00:00 | 30113 |
| FLA | 0 | 0 | 0 | -2 | 0 | 2 | 0 | 6 | 0 | 5 | 10 | 33 | 20:39 | 16:49 | 01:47 | 02:03 | 30112 |
| FLA | 0 | 1 | 1 | 1 | 0 | 1 | 0 | 2 | 0 | 5 | 5 | 50 | 16:03 | 13:13 | 00:30 | 02:20 | 30111 |
| BUF | 0 | 0 | 0 | -2 | 0 | 4 | 0 | 0 | 1 | 8 | 9 | 47 | 18:54 | 15:10 | 01:31 | 02:13 | 21290 |
| WSH | 0 | 1 | 1 | 0 | 0 | 1 | 0 | 0 | 1 | 6 | 5 | 55 | 19:28 | 15:44 | 01:05 | 02:39 | 21275 |
| OTT | 0 | 0 | 0 | -1 | 2 | 0 | 0 | 1 | 1 | 5 | 7 | 42 | 23:01 | 17:14 | 02:07 | 03:40 | 21259 |
| CBJ | 1 | 0 | 1 | 3 | 0 | 3 | 33.3 | 0 | 1 | 6 | 7 | 46 | 16:28 | 15:08 | 00:00 | 01:20 | 21245 |
| MTL | 0 | 2 | 2 | 1 | 2 | 1 | 0 | 0 | 0 | 4 | 3 | 57 | 08:51 | 07:00 | 00:30 | 01:21 | 21204 |
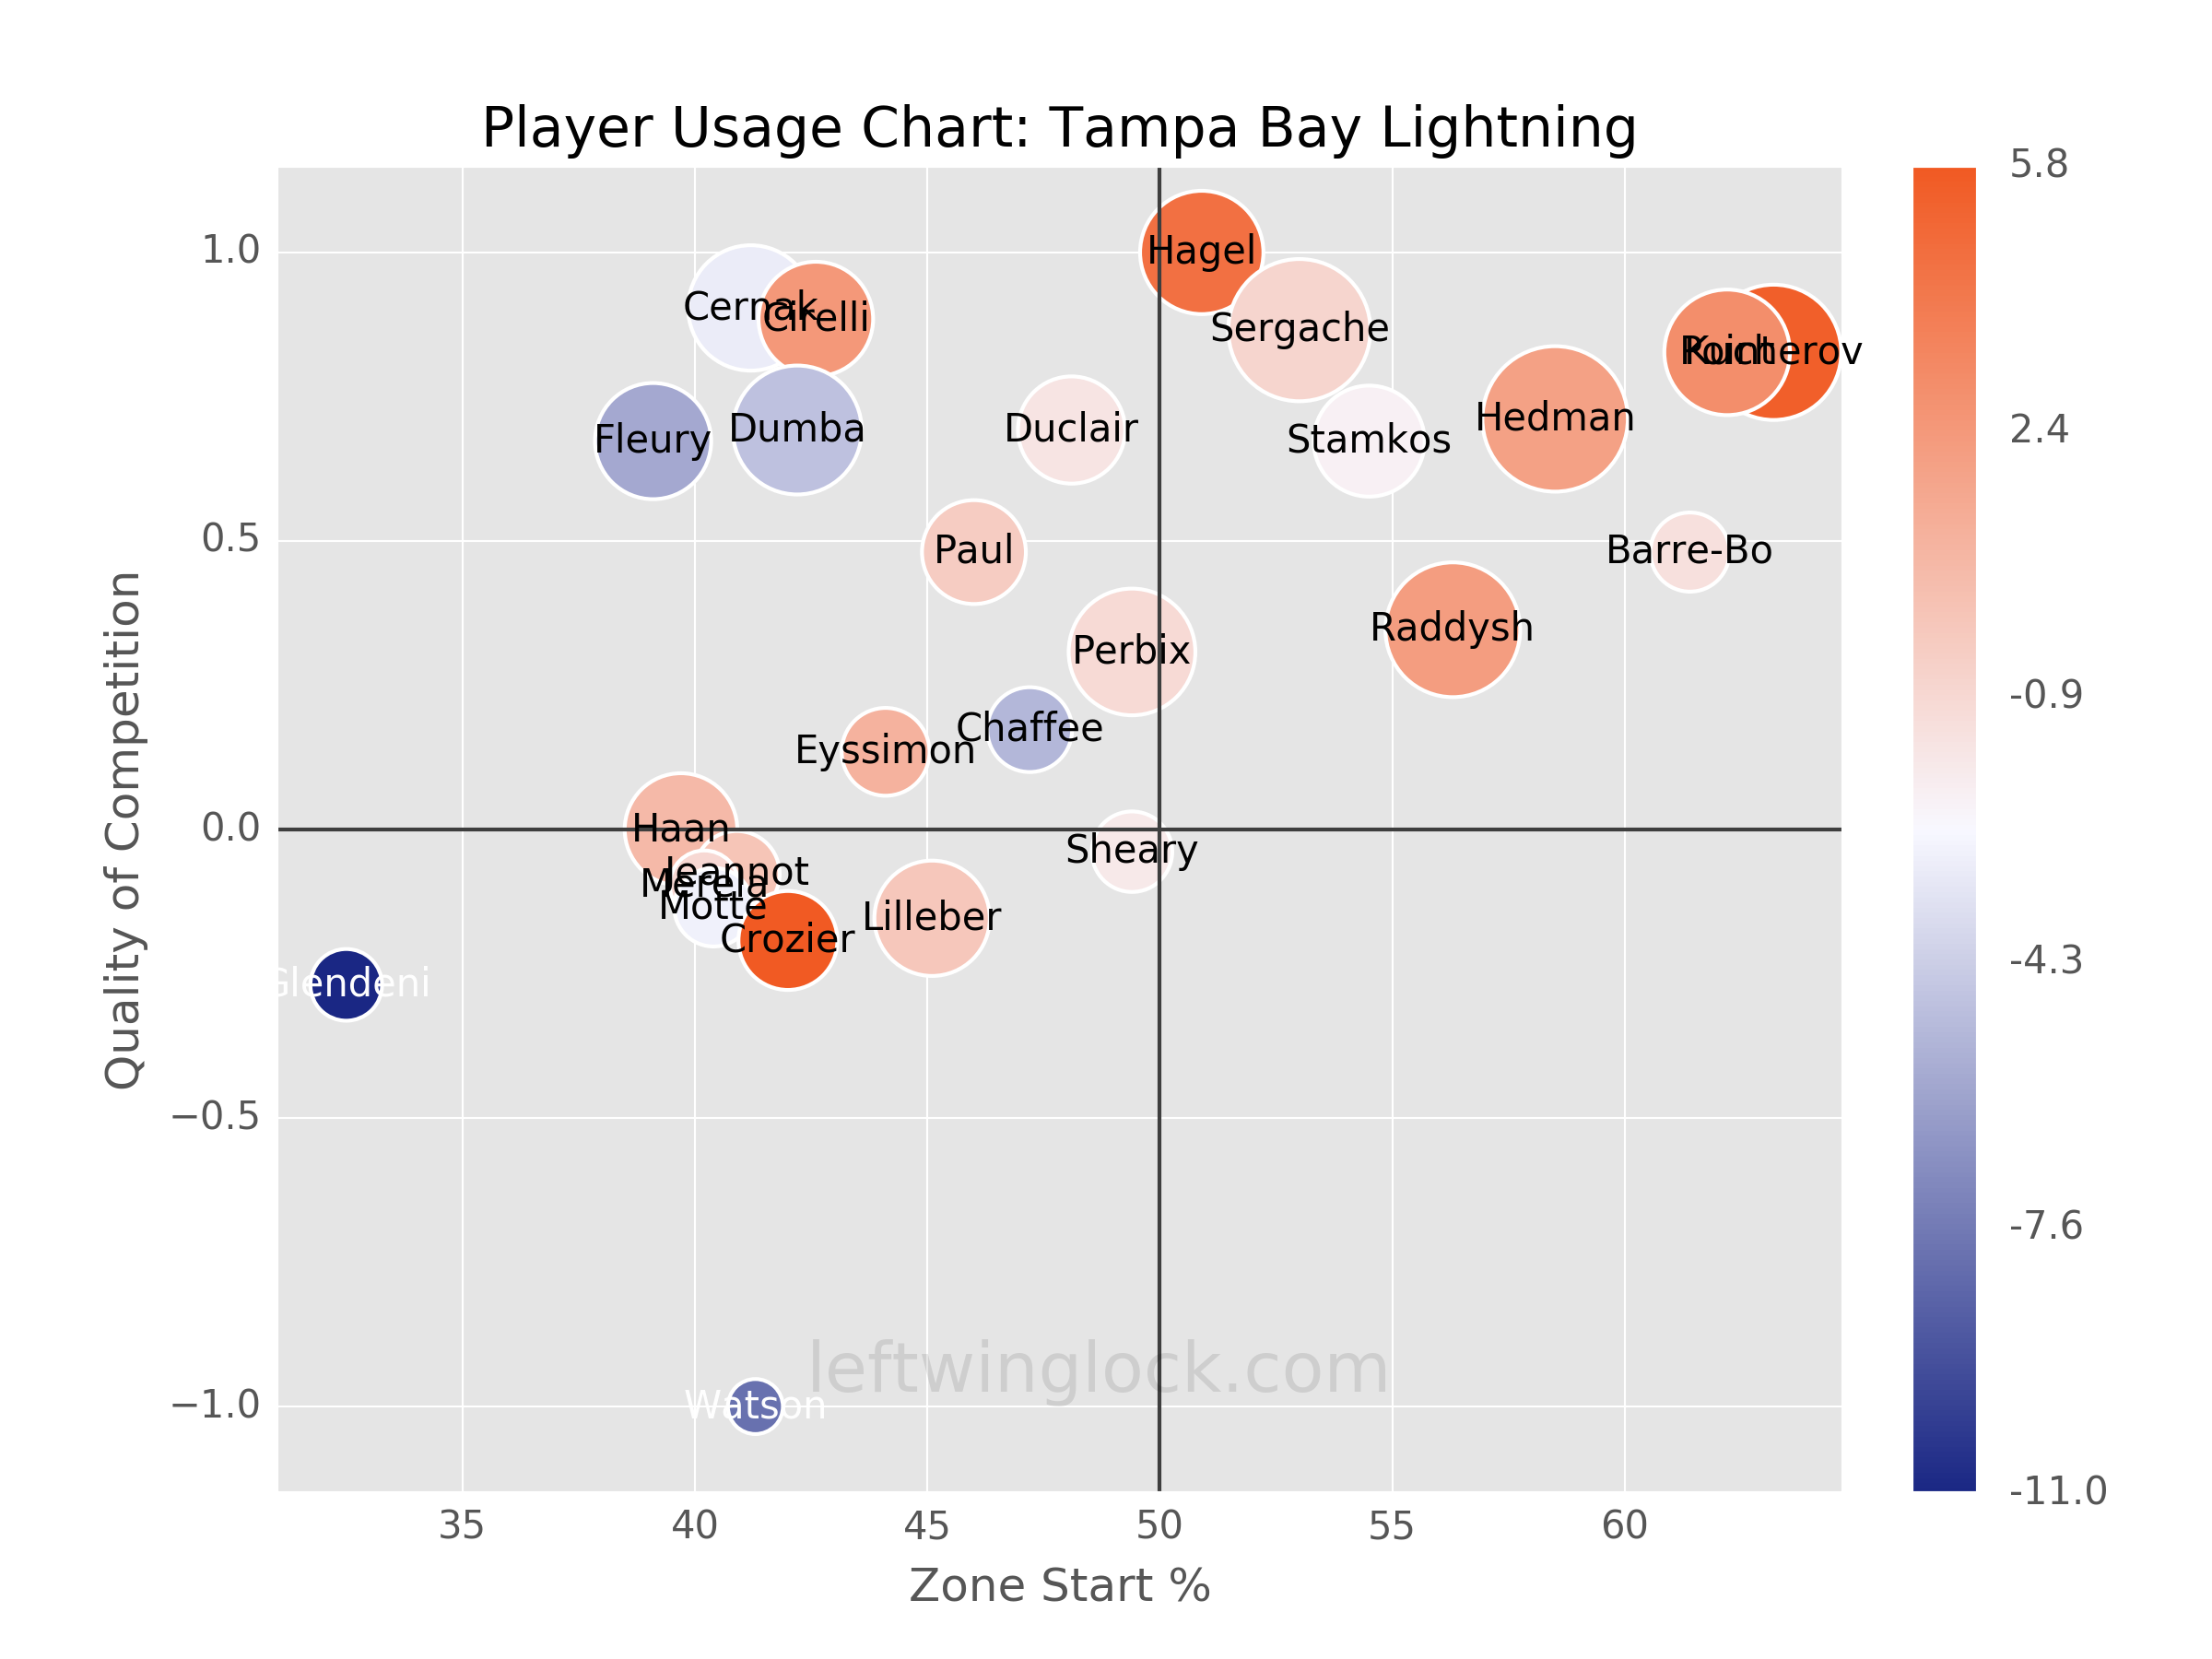
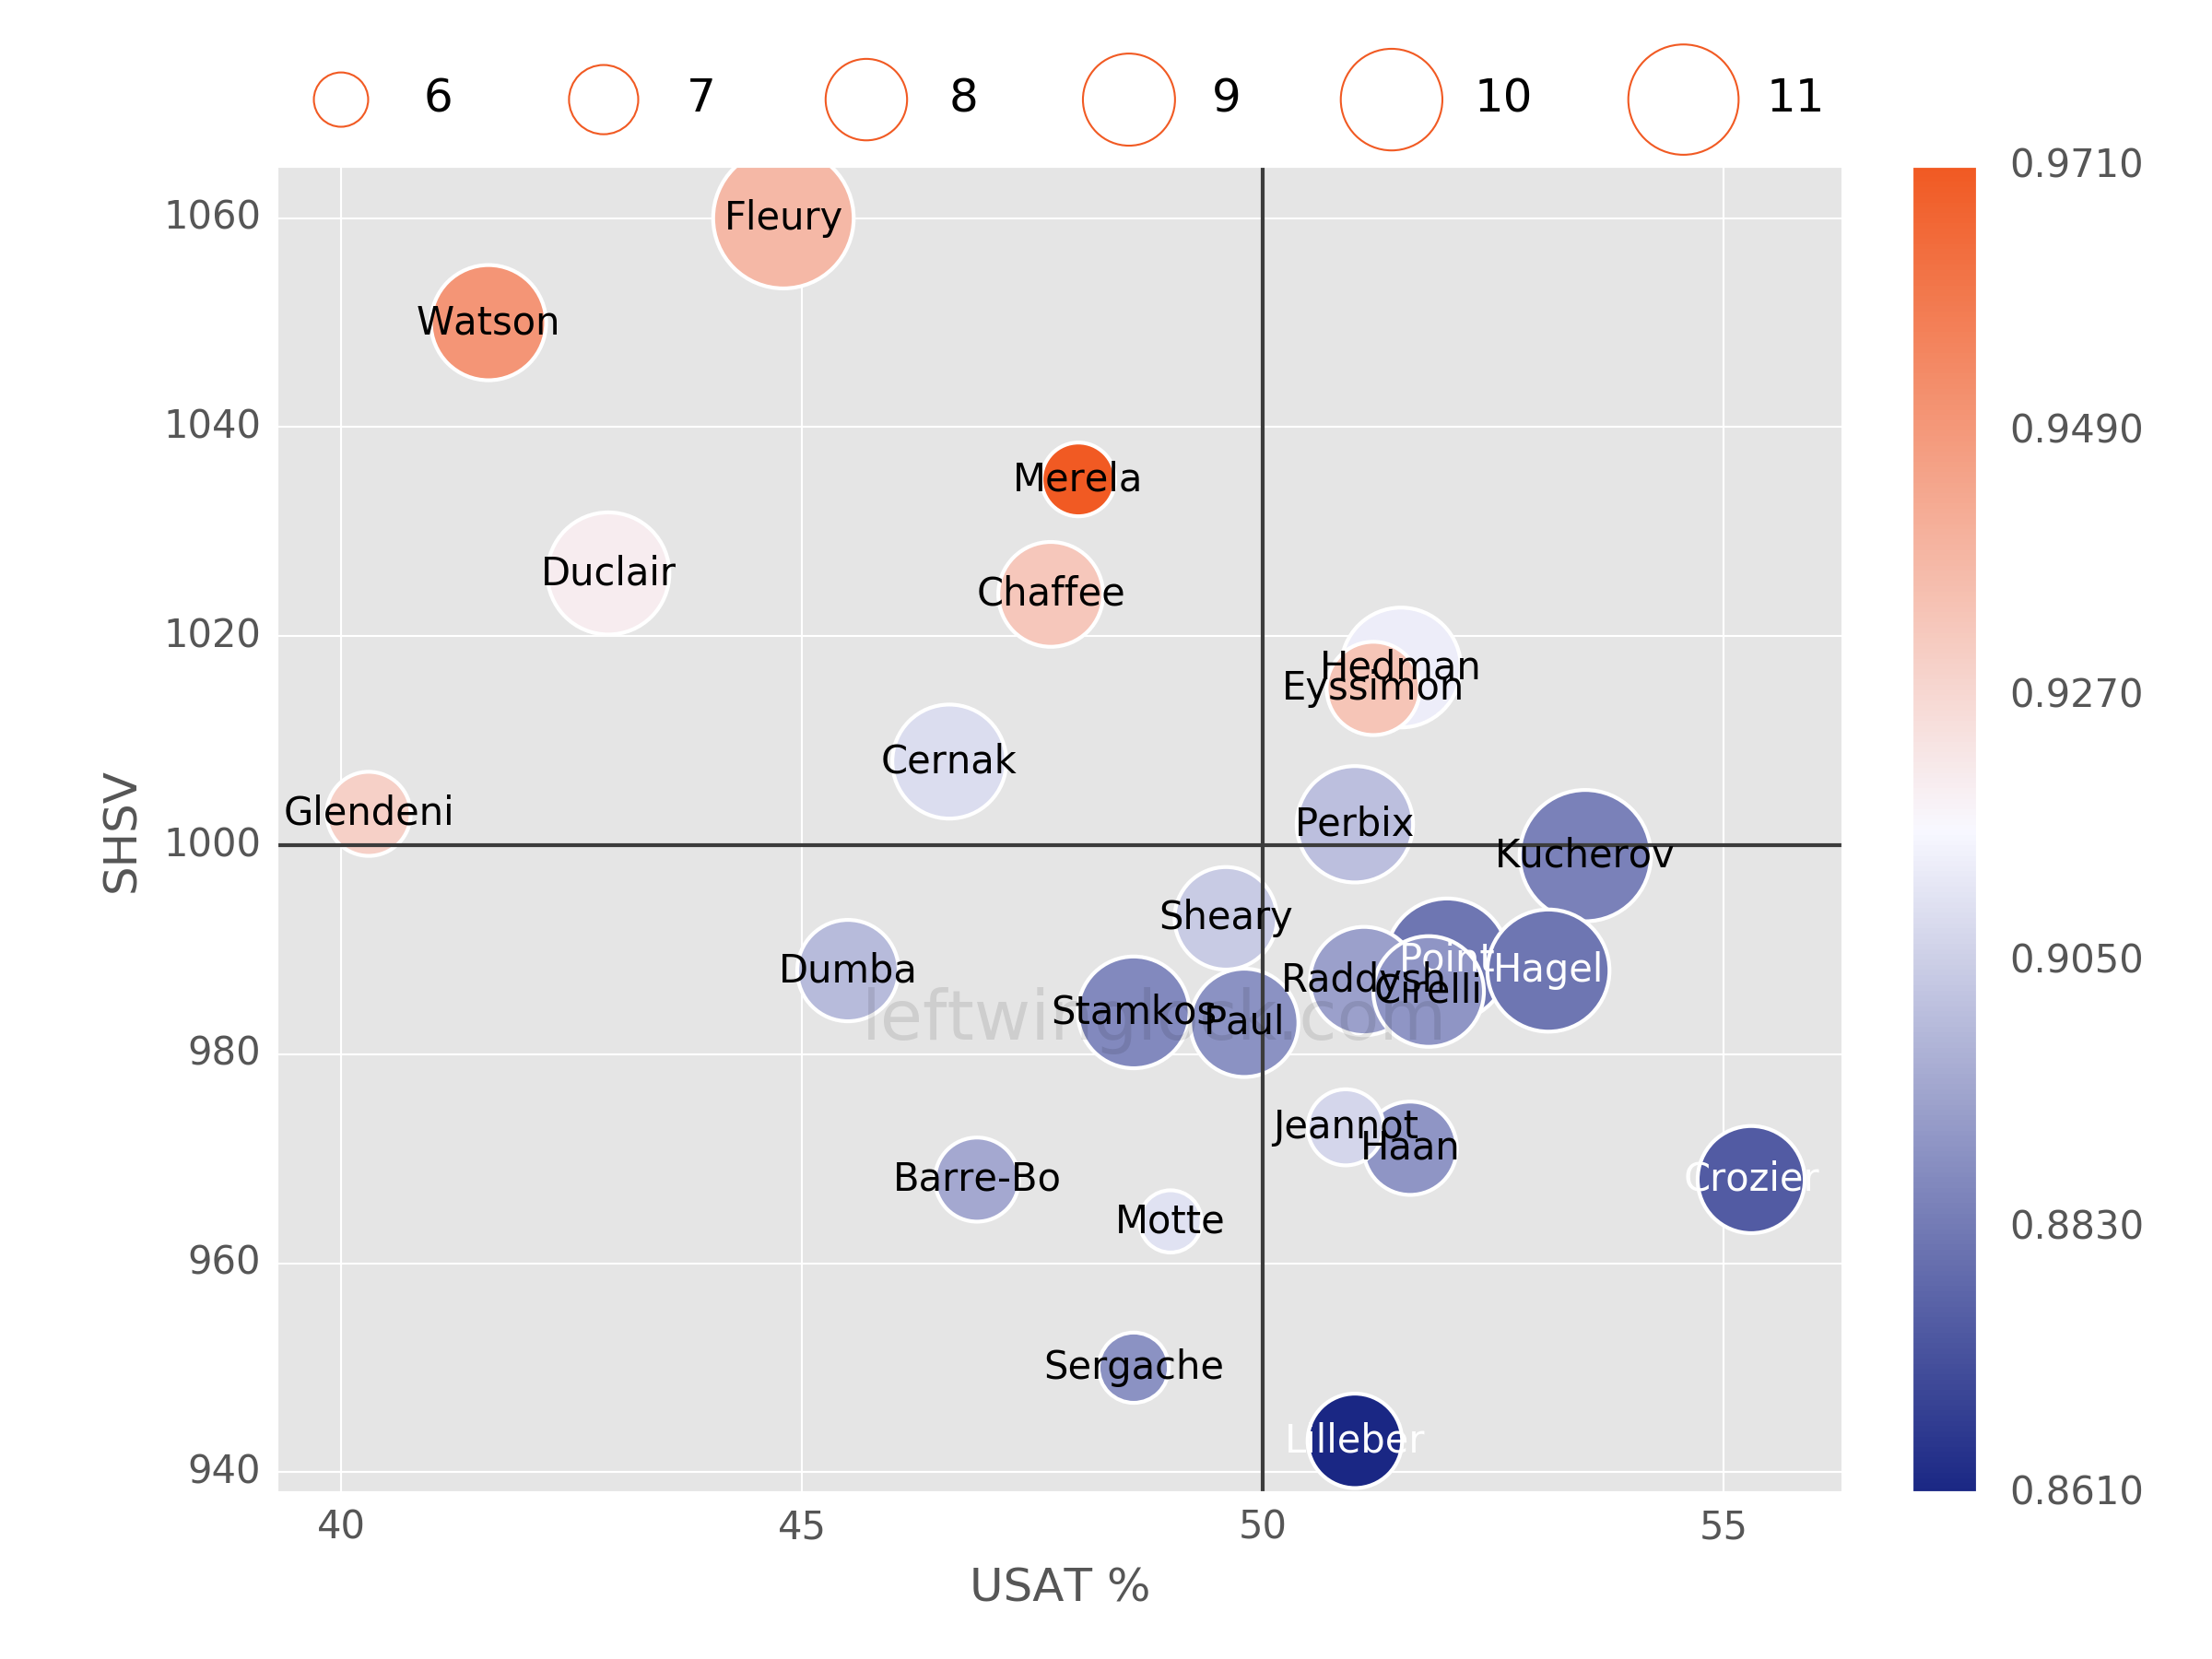
Player Usage Chart / Possession and Luck Chart