Brendan Perlini
Explore projections, stats, news, player usage charts, and line combinations for members of the Edmonton Oilers
-
Left Wing Leaders
2023 - 2024
Name PPG PPA PPP Artemi
Panarin11 33 44 Kirill Kaprizov 19 22 41 Filip Forsberg 13 19 32 Matthew Tkachuk 6 26 32 Kevin Fiala 11 19 30 Chris Kreider 18 11 29 Alex Ovechkin 13 15 28 Jason Robertson 9 19 28 Jesper Bratt 7 20 27 Brad Marchand 7 19 26 Matt Boldy 10 15 25 Jared McCann 9 14 23 -
Player Card
-
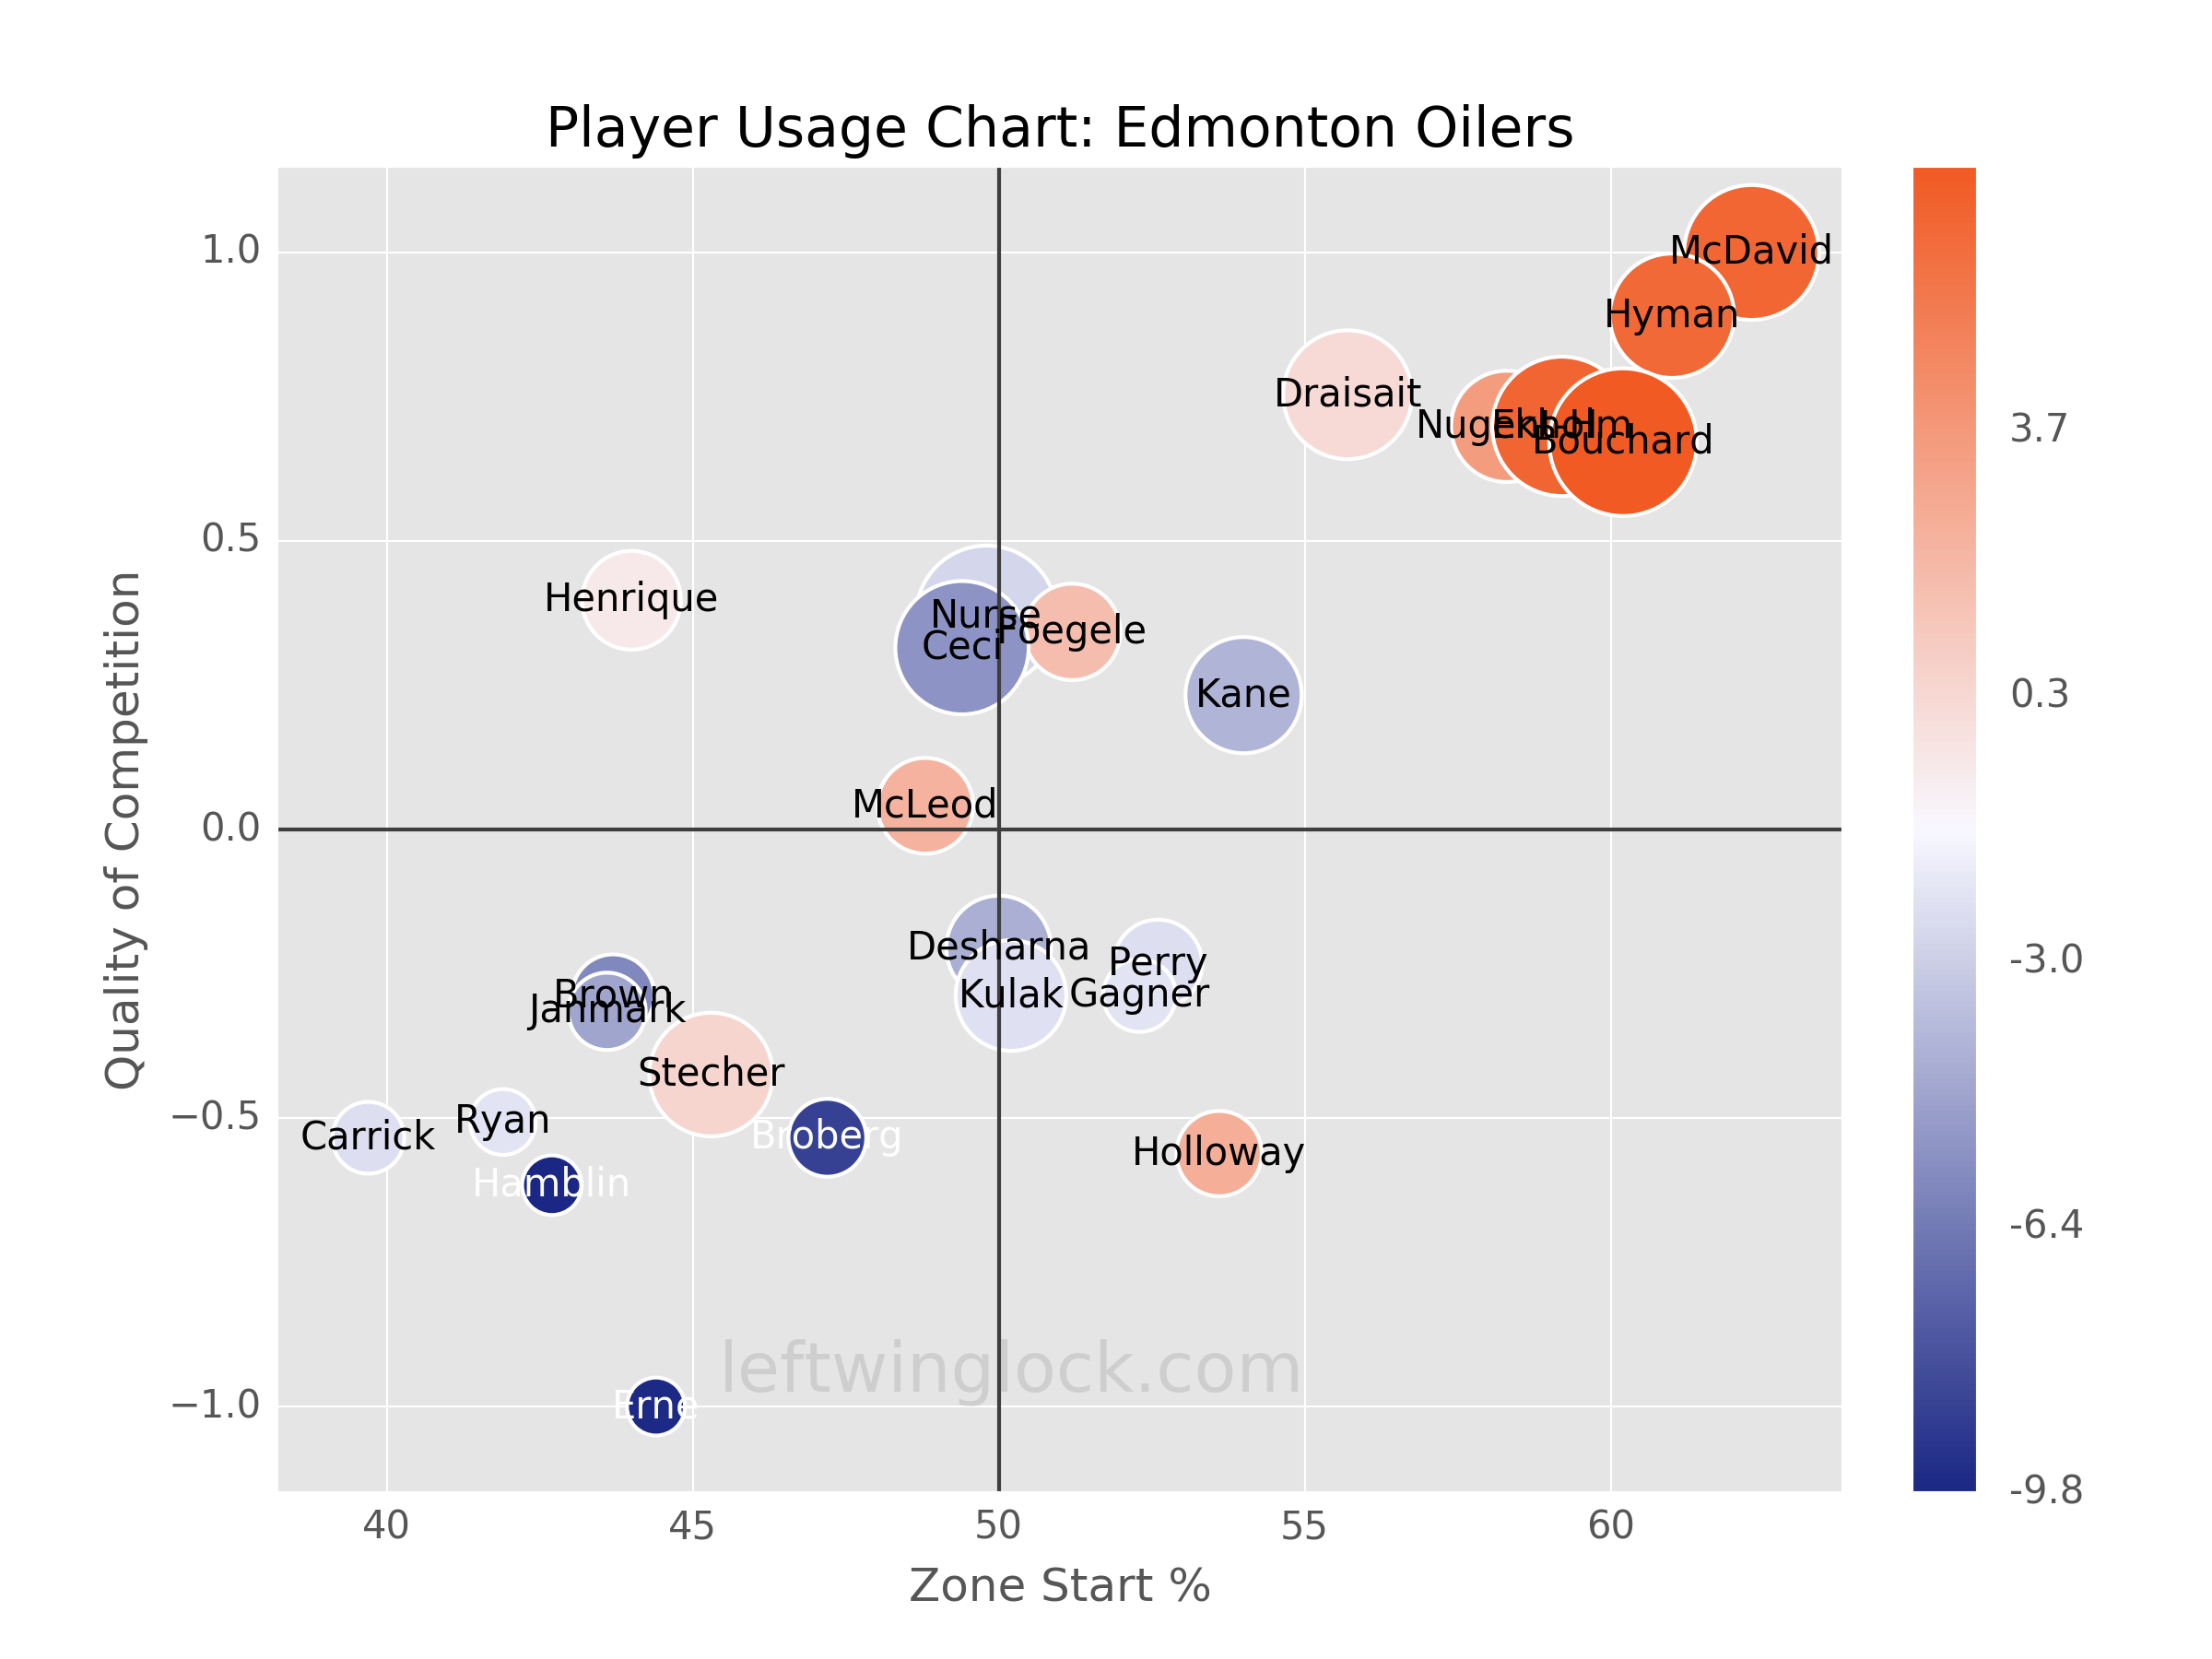
Edmonton Oilers Leaders
2023 - 2024
Name G A Pts Connor
McDavid32 100 132 Leon Draisaitl 41 65 106 Evan Bouchard 18 64 82 Zach Hyman 54 23 77 Ryan Nugent-Hopkins 18 49 67 Adam Henrique 24 27 51 Mattias Ekholm 11 34 45 Evander Kane 24 20 44 Warren Foegele 20 21 41 Darnell Nurse 10 22 32 Ryan McLeod 12 18 30 Cody Ceci 5 20 25

News
-
Brendan Perlini
Has cleared waivers.
Mar 1, 2022 - 2:02 pm -
Brendan Perlini
Has been placed on waivers.
Feb 28, 2022 - 2:03 pm -
Brendan Perlini
Is expected to be in the lineup for today's game.
Feb 19, 2022 - 2:06 pm -
Brendan Perlini
Is out of the COVID-related absence protocol.
Jan 14, 2022 - 1:12 pm
Feature
-
Trending
Buy-Low and Sell-High: Skaters
Replies 0
Basic Stats
| Season | Team | GP | G | A | P | +/- | PIM | S | S/GP | SH% | PPP | H | BS | FW | FO% | TOI | EVTOI | PPTOI | PKTOI |
|---|---|---|---|---|---|---|---|---|---|---|---|---|---|---|---|---|---|---|---|
| 21-22 | EDM | 23 | 4 | 1 | 5 | -2 | 6 | 24 | 1 | 16.7 | 0 | 29 | 3 | 0 | 0.0 | 8.37 | 8.25 | 0.11 | 0.01 |
| 19-20 | CHI,DET | 40 | 1 | 3 | 4 | -18 | 10 | 48 | 1.2 | 2.1 | 0 | 22 | 10 | 0 | 0.0 | 10.70 | 9.47 | 1.22 | 0.00 |
Enhanced Stats (5-on-5 unless denoted with *)
| Season | G/60 | A/60 | P/60 | IPP | ΔPEN/60 | 1A | 2A | EVS/60* | PPS/60* | SATF | SAT% | tEVSH% | tEVSV% | SHSV | ZS% |
|---|---|---|---|---|---|---|---|---|---|---|---|---|---|---|---|
| 21-22 | 1.28 | 0.32 | 1.60 | 83 | -0.93 | 1 | 0 | 7.4 | 0.0 | 148 | 45.5 | 7.7 | 0.920 | 997 | 41.9 |
| 19-20 | 0.16 | 0.49 | 0.66 | 80 | -0.14 | 2 | 1 | 6.4 | 6.2 | 257 | 41.5 | 3.4 | 0.900 | 934 | 46.1 |
Regression Meter
This meter measures whether or not a player's point production is being influenced by luck. Orange indicates the player has been lucky. Dark grey indicates the player has been unlucky.
2A/60
tEVSH%
SH%
IPP
PPSH%
Positional Data
| Season | Team | Left | Center | Right |
|---|---|---|---|---|
| 21-22 | EDM | 96 | 4 | 0 |
| 19-20 | DET | 58 | 0 | 43 |
Most Common Linemates and Line Production
See also: Edmonton Oilers Line Combo Tool | Line Production Tool
| Team | F1 | F2 | F3 | GF | GA | GF% | SATF | SATA | SAT% | USATF | USATA | USAT% | SH% | SV% | SHSV | ZS% |
|---|
Most Recent 10 Games
| OPP | G | A | P | +/- | PIM | SOG | SH% | H | BS | FW | FL | FO% | TOI | EVTOI | PPTOI | PKTOI | ID |
|---|
Player Usage Chart / Possession and Luck Chart