JOHN TAVARES
Explore projections, stats, news, player usage charts, and line combinations for members of the Toronto Maple Leafs
-
Center Leaders
2023 - 2024
Name G A Pts Nathan
MacKinnon51 89 140 Connor McDavid 32 100 132 Auston Matthews 69 38 107 Leon Draisaitl 41 65 106 J.T. Miller 37 66 103 Sam Reinhart 57 37 94 Sidney Crosby 42 52 94 Brayden Point 46 44 90 Sebastian Aho 36 53 89 Elias Pettersson 34 55 89 Robert Thomas 26 60 86 Steven Stamkos 40 41 81 -
Player Card

JOHN TAVARES
Toronto Maple Leafs2023 - 2024- G 29
- A 36
- PTS 65
- +/- 2
- PIM 30
- PPP 20
- SH% 10.4
- L 0%
- C 100%
- R 0%
-
Toronto Maple Leafs Leaders
2023 - 2024
Name G A Pts Auston
Matthews69 38 107 William Nylander 40 58 98 Mitchell Marner 26 59 85 John Tavares 29 36 65 Morgan Rielly 7 51 58 Max Domi 9 38 47 Tyler Bertuzzi 21 22 43 Matthew Knies 15 20 35 Jake McCabe 8 20 28 Nicholas Robertson 14 13 27 TJ Brodie 1 25 26 Bobby McMann 15 9 24
News
-
John Tavares
Is considered day-to-day with an undisclosed injury.
Feb 17, 2024 - 11:19 am -
John Tavares
Is not on the ice for the morning skate.
Feb 17, 2024 - 10:28 am -
John Tavares
Is expected to be in the lineup for today's game.
Feb 15, 2024 - 11:00 am -
John Tavares
Is not on the ice for practice.
Feb 14, 2024 - 12:15 pm
Feature
-
Trending
Evaluating Mid-season Trade Suggestions
Replies 0
Basic Stats
| Season | Team | GP | G | A | P | +/- | PIM | S | S/GP | SH% | PPP | H | BS | FW | FO% | TOI | EVTOI | PPTOI | PKTOI |
|---|---|---|---|---|---|---|---|---|---|---|---|---|---|---|---|---|---|---|---|
| 23-24 | TOR | 80 | 29 | 36 | 65 | 2 | 30 | 279 | 3.5 | 10.4 | 20 | 134 | 37 | 802 | 59.3 | 17.87 | 14.78 | 3.08 | 0.01 |
| 22-23 | TOR | 80 | 36 | 44 | 80 | -7 | 34 | 277 | 3.5 | 13.0 | 39 | 112 | 36 | 726 | 58.3 | 17.66 | 14.19 | 3.45 | 0.01 |
| 21-22 | TOR | 79 | 27 | 49 | 76 | -8 | 32 | 237 | 3 | 11.4 | 26 | 90 | 44 | 813 | 60.6 | 18.07 | 15.06 | 3.00 | 0.02 |
| 20-21 | TOR | 56 | 19 | 31 | 50 | 12 | 14 | 163 | 2.9 | 11.7 | 12 | 51 | 28 | 471 | 55.3 | 18.20 | 15.56 | 2.60 | 0.04 |
| 19-20 | TOR | 63 | 26 | 34 | 60 | -7 | 24 | 197 | 3.1 | 13.2 | 21 | 32 | 31 | 617 | 55.3 | 19.55 | 16.52 | 3.01 | 0.02 |
Enhanced Stats (5-on-5 unless denoted with *)
| Season | G/60 | A/60 | P/60 | IPP | ΔPEN/60 | 1A | 2A | EVS/60* | PPS/60* | SATF | SAT% | tEVSH% | tEVSV% | SHSV | ZS% |
|---|---|---|---|---|---|---|---|---|---|---|---|---|---|---|---|
| 23-24 | 0.81 | 1.08 | 1.90 | 70 | 0.29 | 12 | 8 | 9.0 | 21.2 | 1198 | 51.5 | 8.1 | 0.926 | 1007 | 53.0 |
| 22-23 | 0.90 | 1.19 | 2.09 | 74 | -0.38 | 11 | 10 | 9.0 | 22.4 | 1037 | 51.7 | 9.1 | 0.910 | 1001 | 55.9 |
| 21-22 | 0.81 | 1.29 | 2.10 | 72 | 0.08 | 11 | 13 | 8.3 | 17.7 | 1168 | 52.6 | 9.1 | 0.898 | 989 | 56.8 |
| 20-21 | 0.81 | 1.40 | 2.21 | 81 | 0.35 | 11 | 8 | 8.4 | 15.2 | 750 | 51.2 | 8.9 | 0.929 | 1018 | 54.8 |
| 19-20 | 0.79 | 1.03 | 1.81 | 66 | 0.19 | 12 | 5 | 8.7 | 10.1 | 1018 | 53.3 | 8.2 | 0.892 | 974 | 53.5 |
Regression Meter
This meter measures whether or not a player's point production is being influenced by luck. Orange indicates the player has been lucky. Dark grey indicates the player has been unlucky.
2A/60
tEVSH%
SH%
IPP
PPSH%
Positional Data
| Season | Team | Left | Center | Right |
|---|---|---|---|---|
| 23-24 | TOR | 0 | 100 | 0 |
| 22-23 | TOR | 10 | 90 | 0 |
| 21-22 | TOR | 0 | 100 | 0 |
| 20-21 | TOR | 2 | 98 | 0 |
| 19-20 | TOR | 0 | 100 | 0 |
Most Common Linemates and Line Production
See also: Toronto Maple Leafs Line Combo Tool | Line Production Tool
| Team | F1 | F2 | F3 | GF | GA | GF% | SATF | SATA | SAT% | USATF | USATA | USAT% | SH% | SV% | SHSV | ZS% |
|---|---|---|---|---|---|---|---|---|---|---|---|---|---|---|---|---|
| TOR | BERTUZZI | TAVARES | NYLANDER | 16 | 12 | 57.1 | 436 | 373 | 53.9 | 307 | 260 | 54.1 | 7.2 | 0.934 | 1006 | 56.4 |
| TOR | BERTUZZI | TAVARES | MARNER | 4 | 4 | 50.0 | 129 | 109 | 54.2 | 78 | 77 | 50.3 | 7.8 | 0.929 | 1007 | 57.8 |
| TOR | KNIES | TAVARES | NYLANDER | 4 | 5 | 44.4 | 107 | 140 | 43.3 | 75 | 100 | 42.9 | 6.8 | 0.921 | 988 | 46.5 |
Most Recent 10 Games
| OPP | G | A | P | +/- | PIM | SOG | SH% | H | BS | FW | FL | FO% | TOI | EVTOI | PPTOI | PKTOI | ID |
|---|---|---|---|---|---|---|---|---|---|---|---|---|---|---|---|---|---|
| BOS | 0 | 0 | 0 | -1 | 0 | 3 | 0 | 6 | 3 | 13 | 15 | 46 | 18:01 | 17:06 | 00:55 | 00:00 | 30127 |
| BOS | 0 | 0 | 0 | 0 | 0 | 1 | 0 | 7 | 1 | 15 | 8 | 65 | 20:10 | 16:45 | 03:25 | 00:00 | 30126 |
| BOS | 0 | 1 | 1 | 1 | 0 | 4 | 0 | 6 | 0 | 12 | 9 | 57 | 22:34 | 18:36 | 03:58 | 00:00 | 30125 |
| BOS | 0 | 0 | 0 | 0 | 0 | 3 | 0 | 7 | 0 | 9 | 11 | 45 | 19:12 | 15:50 | 03:22 | 00:00 | 30124 |
| BOS | 0 | 0 | 0 | 1 | 2 | 3 | 0 | 4 | 0 | 15 | 10 | 60 | 19:45 | 13:00 | 06:45 | 00:00 | 30123 |
| BOS | 1 | 0 | 1 | -1 | 0 | 2 | 50 | 2 | 1 | 9 | 9 | 50 | 18:03 | 13:42 | 04:21 | 00:00 | 30122 |
| BOS | 0 | 0 | 0 | 0 | 0 | 6 | 0 | 3 | 0 | 8 | 4 | 67 | 15:39 | 10:38 | 05:01 | 00:00 | 30121 |
| TBL | 1 | 0 | 1 | 1 | 0 | 2 | 50 | 5 | 0 | 8 | 9 | 47 | 17:13 | 12:39 | 04:34 | 00:00 | 21304 |
| FLA | 1 | 0 | 1 | -3 | 4 | 3 | 33.3 | 2 | 0 | 11 | 10 | 52 | 15:18 | 10:51 | 04:27 | 00:00 | 21297 |
| DET | 1 | 0 | 1 | 1 | 0 | 5 | 20 | 2 | 0 | 7 | 15 | 32 | 18:44 | 14:36 | 04:08 | 00:00 | 21277 |
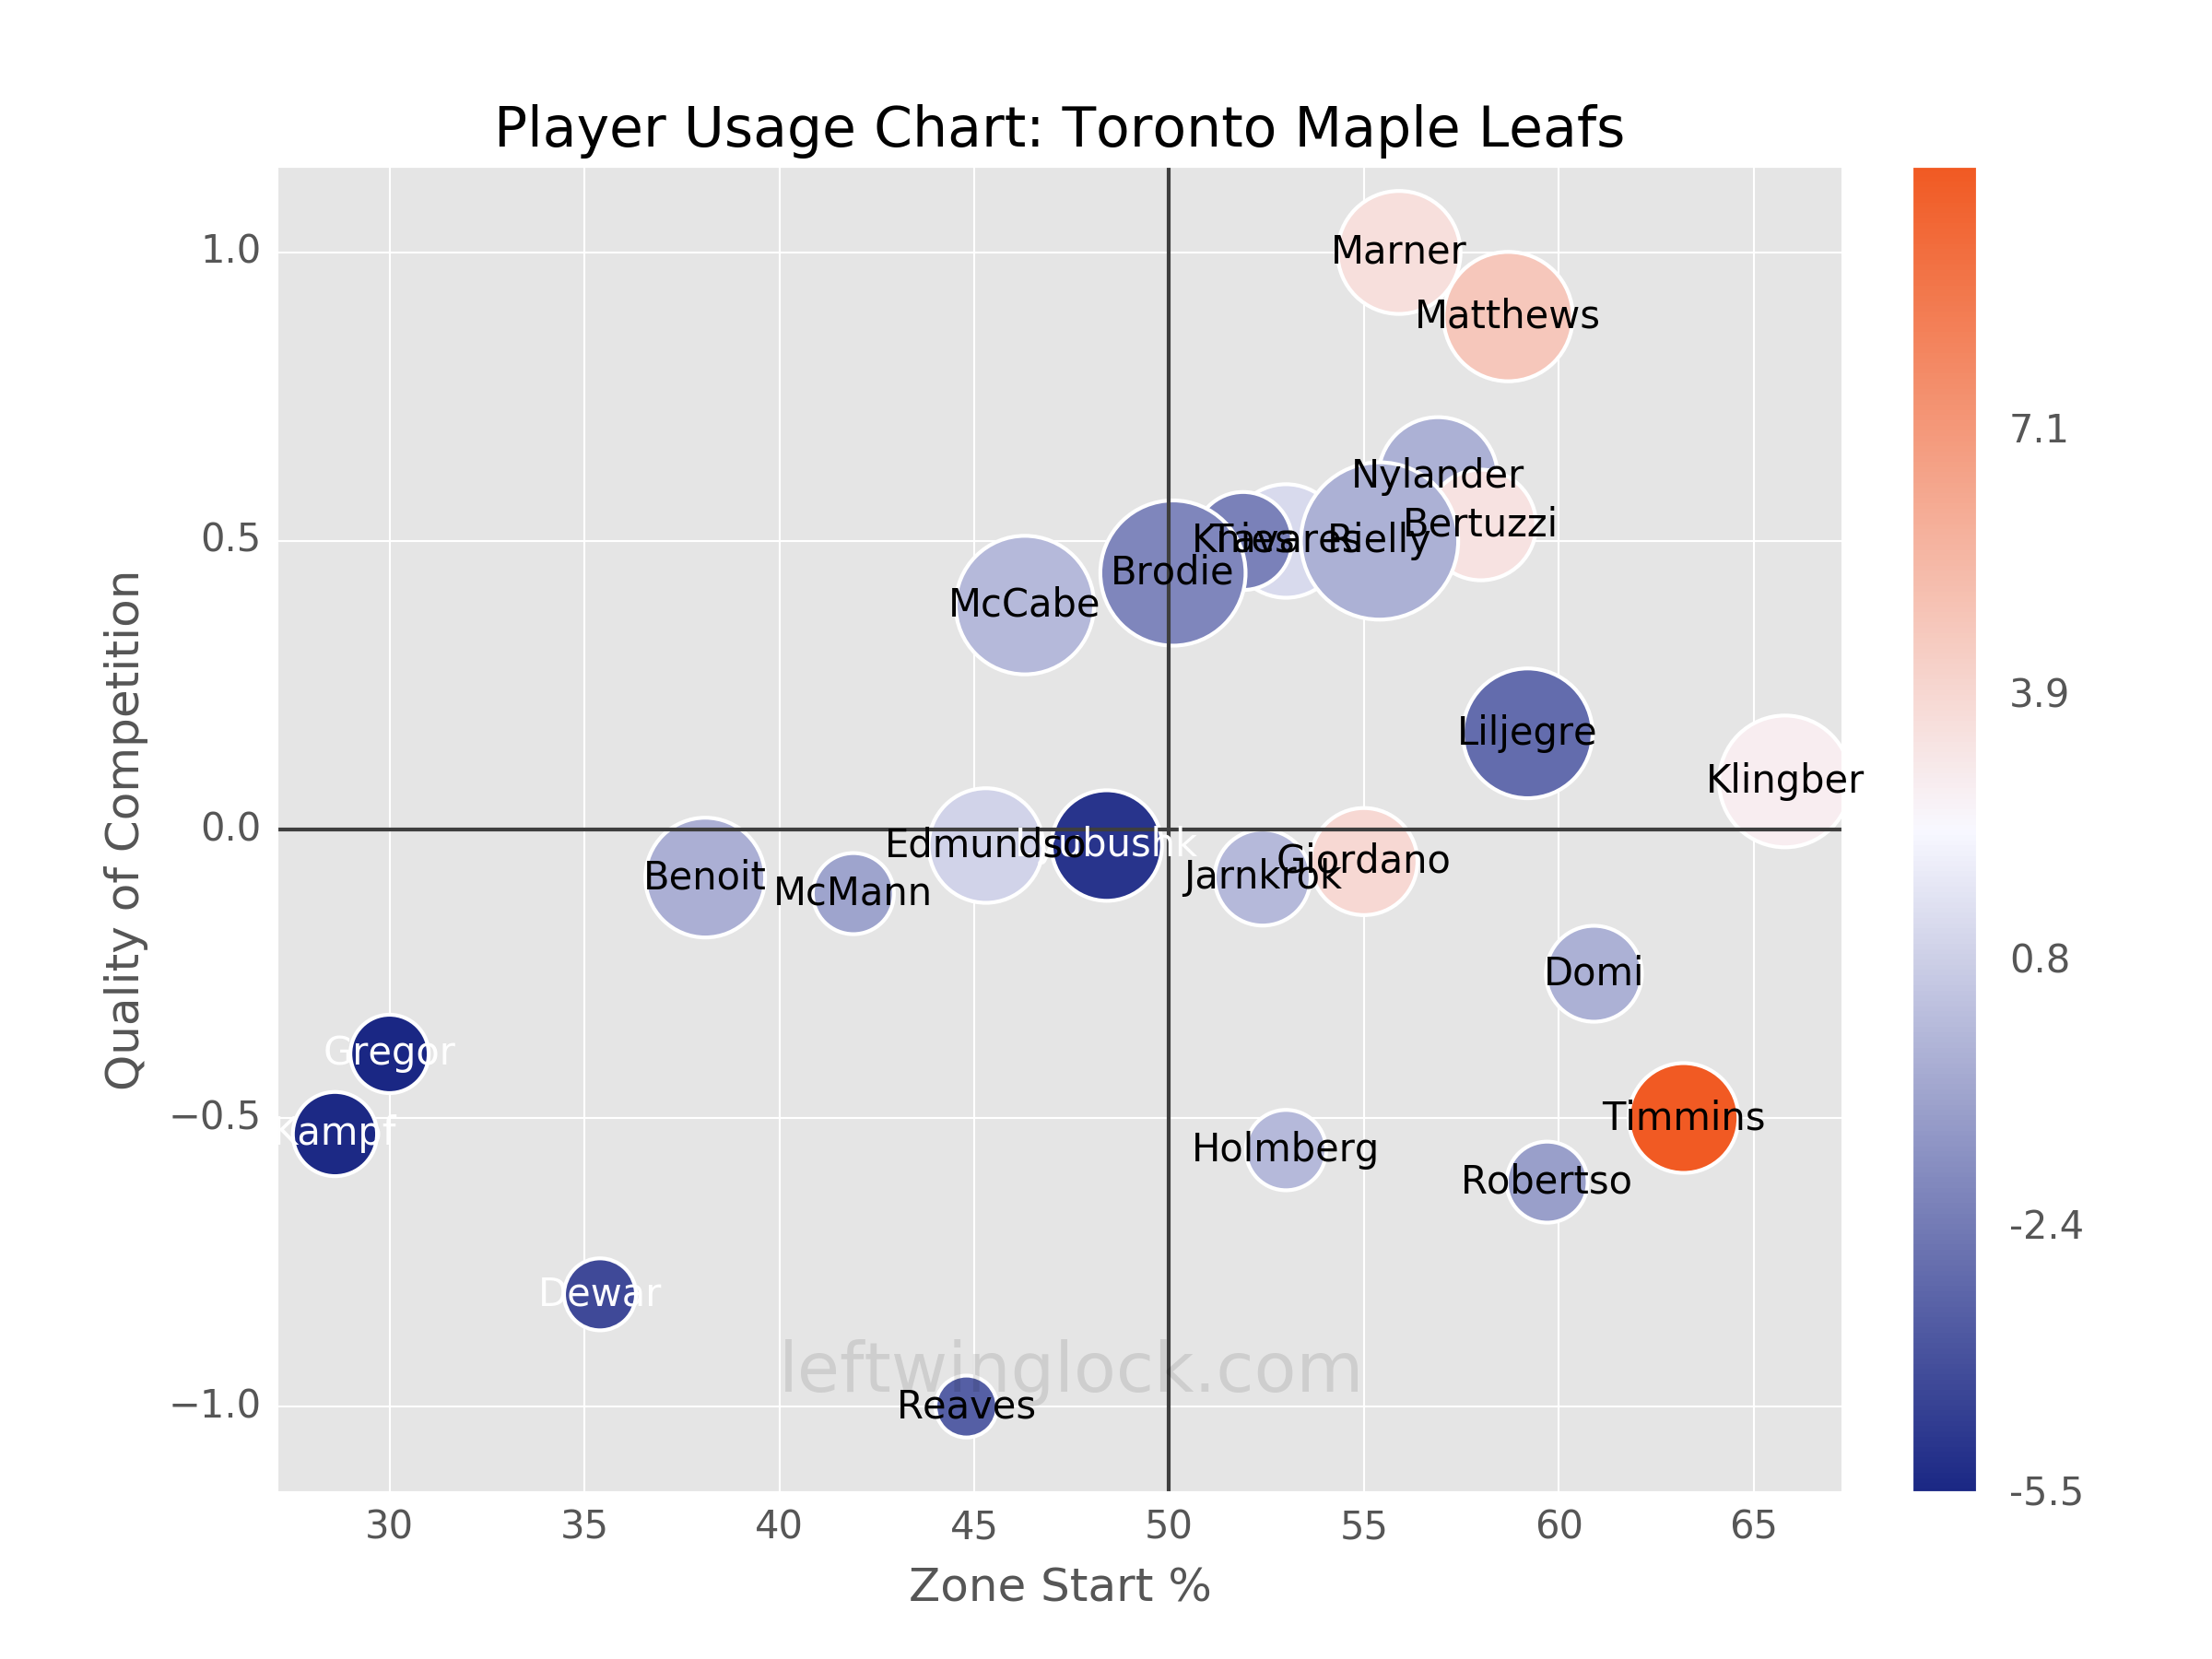
Player Usage Chart / Possession and Luck Chart