Jake Walman
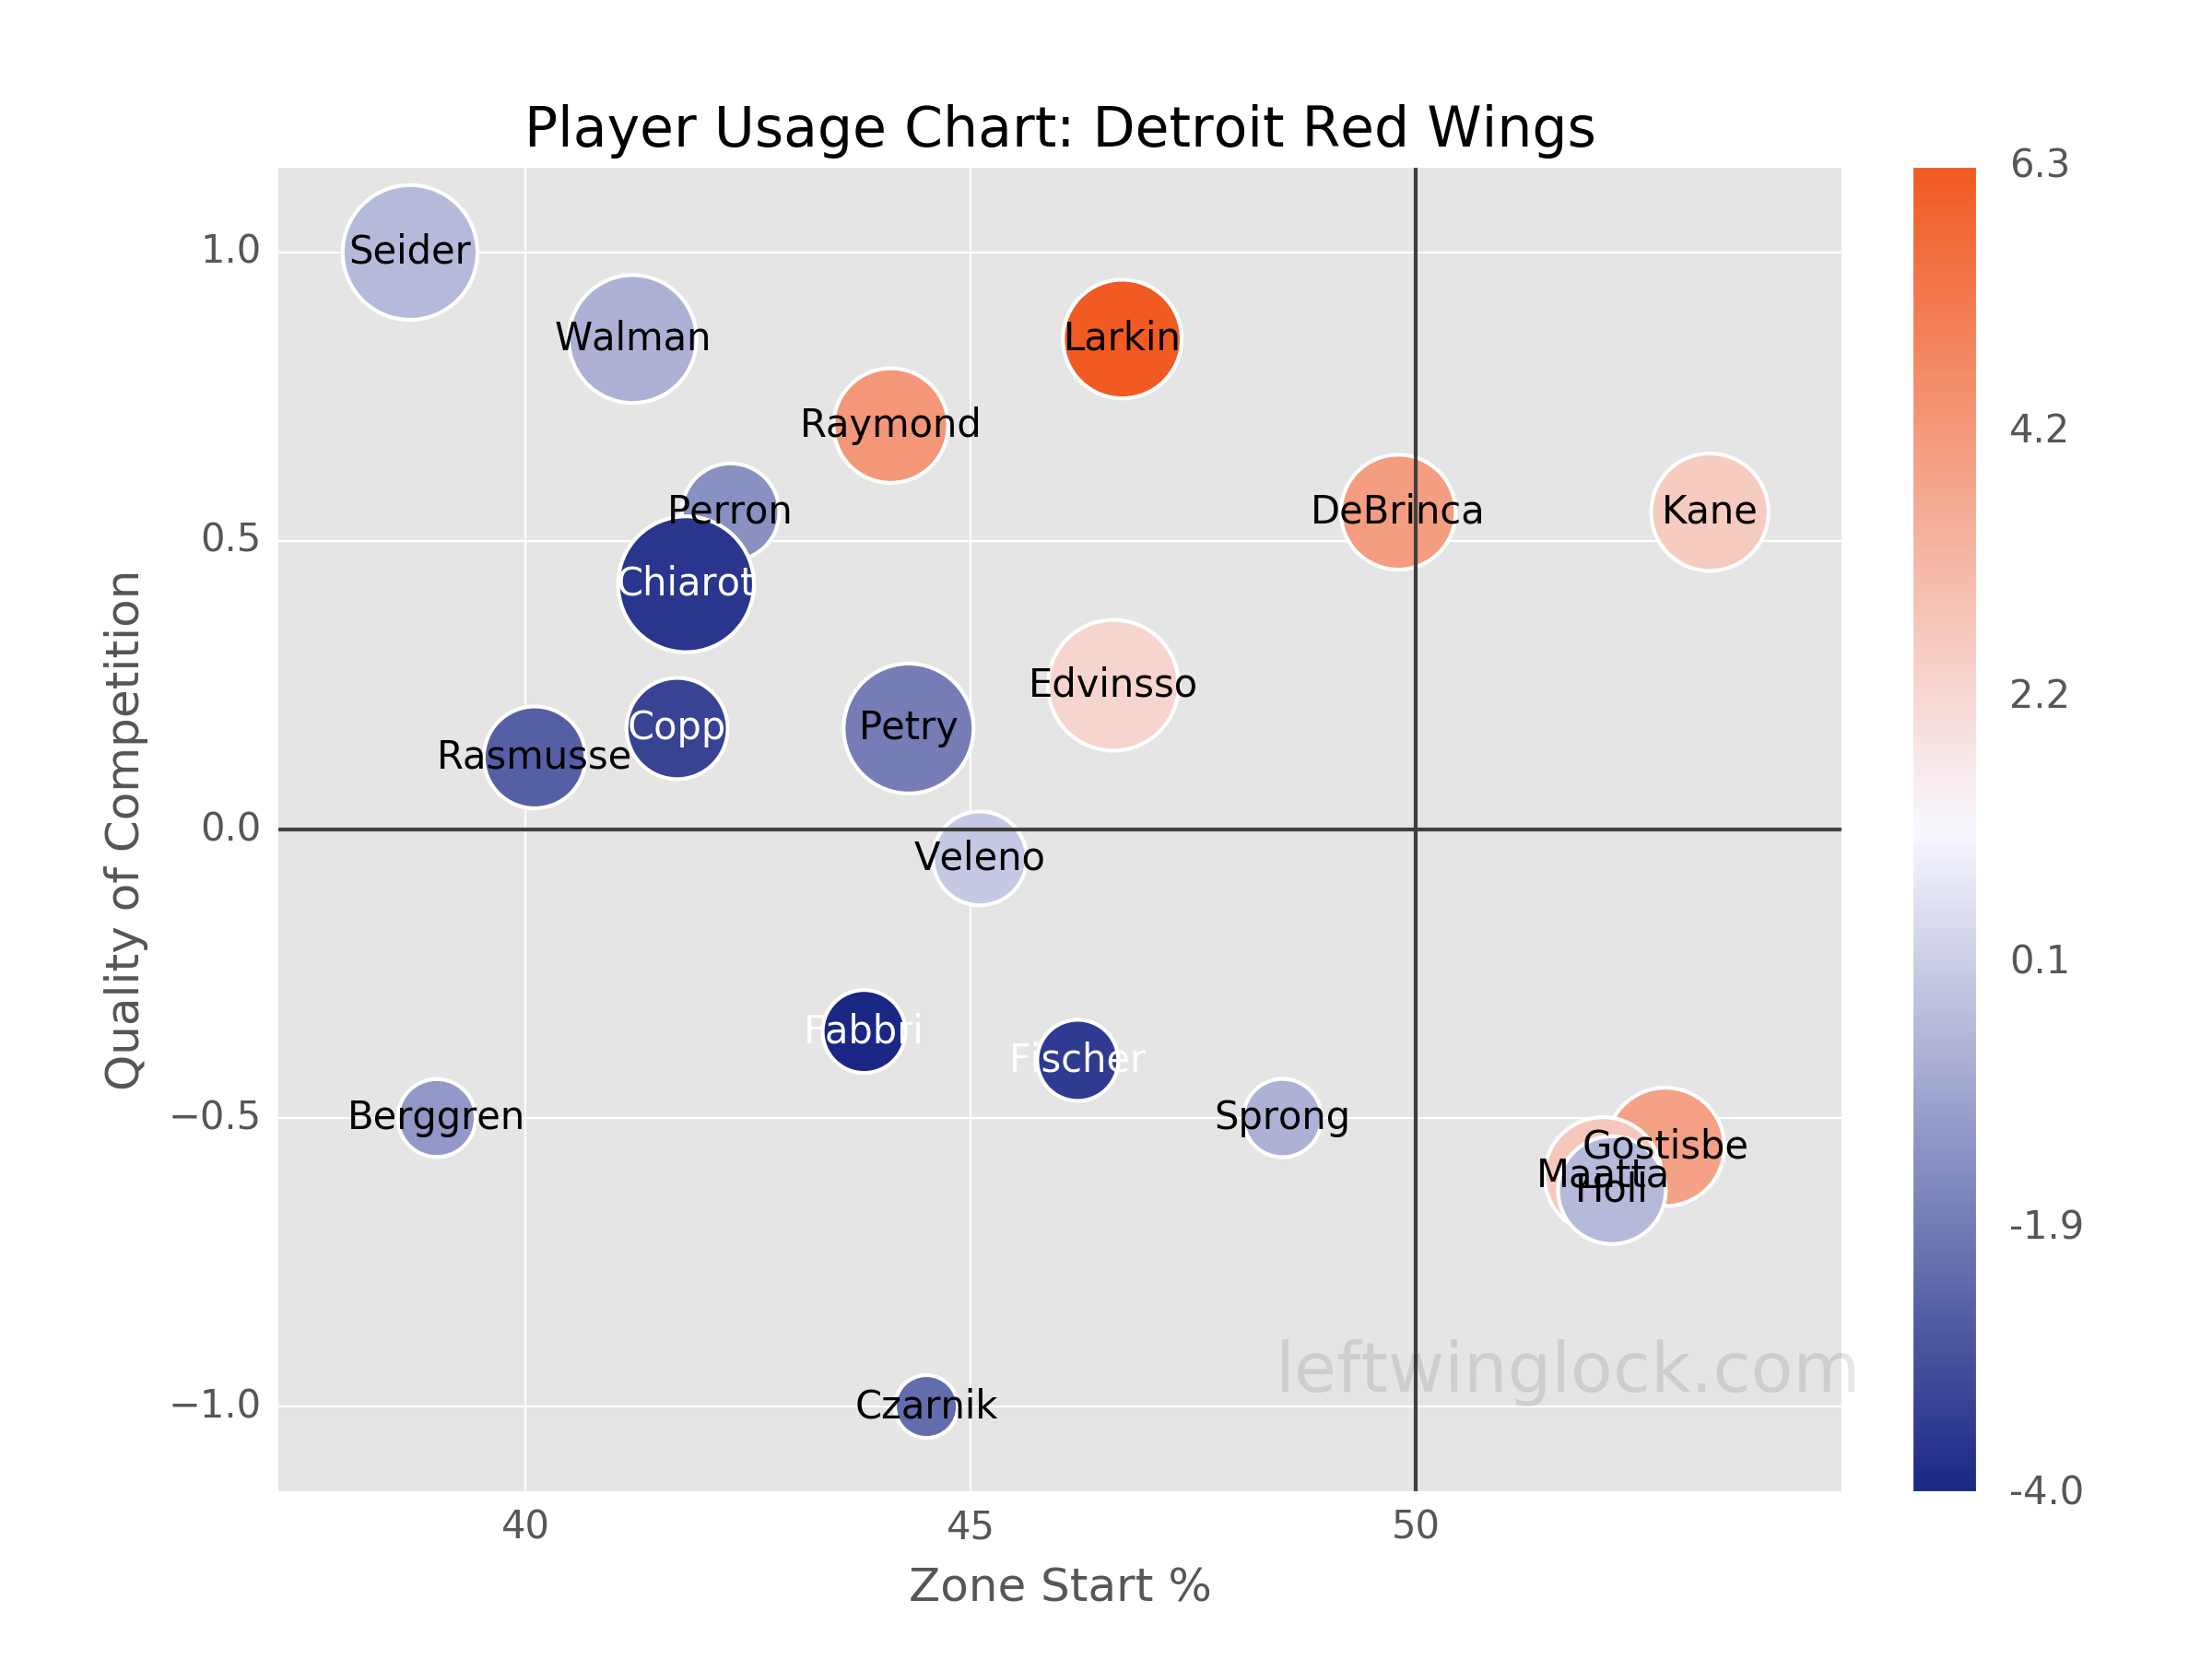
Explore projections, stats, news, player usage charts, and line combinations for members of the Detroit Red Wings
-
Defenseman Leaders
2023 - 2024
Name PPG PPA PPP Cale
Makar7 32 39 Quinn Hughes 5 33 38 Evan Bouchard 8 27 35 Roman Josi 9 24 33 Adam Fox 6 27 33 Victor Hedman 4 27 31 Shayne Gostisbehere 2 27 29 Mike Matheson 5 23 28 Luke Hughes 4 21 25 Noah Dobson 1 23 24 John Carlson 6 15 21 Miro Heiskanen 2 19 21 -
Player Card

Jake Walman
Detroit Red Wings2023 - 2024- G 12
- A 9
- PTS 21
- +/- -2
- PIM 44
- PPP 4
- SH% 11.1
- L 100%
- C 0%
- R 0%
-
Detroit Red Wings Leaders
2023 - 2024
Name G A Pts Lucas
Raymond31 41 72 Dylan Larkin 33 36 69 Alex DeBrincat 27 40 67 Shayne Gostisbehere 10 46 56 J.T. Compher 19 29 48 Patrick Kane 20 27 47 David Perron 17 30 47 Daniel Sprong 18 25 43 Moritz Seider 9 33 42 Andrew Copp 13 20 33 Michael Rasmussen 13 20 33 Robby Fabbri 18 14 32
News
-
Jake Walman
Is expected to be in the lineup for today's game.
Apr 1, 2024 - 11:55 am -
Jake Walman
Is on the ice for practice.
Mar 25, 2024 - 11:24 am -
Jake Walman
Will miss tonight's game against the Columbus Blue Jackets due to a nagging, lower-body injury.
Mar 19, 2024 - 11:16 am -
Jake Walman
Is expected to be in the lineup for today's game.
Mar 16, 2024 - 12:13 pm
Feature
-
Trending
Buy-Low and Sell-High: Skaters
Replies 0
Basic Stats
| Season | Team | GP | G | A | P | +/- | PIM | S | S/GP | SH% | PPP | H | BS | FW | FO% | TOI | EVTOI | PPTOI | PKTOI |
|---|---|---|---|---|---|---|---|---|---|---|---|---|---|---|---|---|---|---|---|
| 23-24 | DET | 63 | 12 | 9 | 21 | -2 | 44 | 108 | 1.7 | 11.1 | 4 | 42 | 151 | 0 | 0.0 | 19.77 | 16.65 | 0.67 | 2.45 |
| 22-23 | DET | 63 | 9 | 9 | 18 | 10 | 45 | 140 | 2.2 | 6.4 | 2 | 47 | 121 | 0 | 0.0 | 19.72 | 16.78 | 0.89 | 2.06 |
| 21-22 | DET | 51 | 3 | 7 | 10 | -3 | 10 | 87 | 1.7 | 3.5 | 1 | 47 | 58 | 0 | 0.0 | 14.02 | 13.01 | 0.42 | 0.60 |
| 20-21 | STL | 24 | 1 | 1 | 2 | -7 | 8 | 47 | 2 | 2.1 | 0 | 26 | 20 | 0 | 0.0 | 14.46 | 13.34 | 0.05 | 1.06 |
| 19-20 | STL | 1 | 0 | 0 | 0 | 1 | 0 | 1 | 1 | 0.0 | 0 | 0 | 0 | 0 | 0.0 | 11.07 | 11.07 | 0.00 | 0.00 |
Enhanced Stats (5-on-5 unless denoted with *)
| Season | G/60 | A/60 | P/60 | IPP | ΔPEN/60 | 1A | 2A | EVS/60* | PPS/60* | SATF | SAT% | tEVSH% | tEVSV% | SHSV | ZS% |
|---|---|---|---|---|---|---|---|---|---|---|---|---|---|---|---|
| 23-24 | 0.54 | 0.18 | 0.72 | 29 | 0.00 | 2 | 1 | 5.5 | 9.9 | 948 | 46.0 | 10.0 | 0.895 | 995 | 41.2 |
| 22-23 | 0.48 | 0.36 | 0.83 | 34 | -0.10 | 2 | 4 | 6.9 | 10.7 | 911 | 50.2 | 8.9 | 0.912 | 1001 | 44.0 |
| 21-22 | 0.09 | 0.56 | 0.65 | 38 | -0.25 | 2 | 4 | 7.3 | 11.3 | 596 | 50.6 | 5.6 | 0.913 | 969 | 53.1 |
| 20-21 | 0.19 | 0.19 | 0.38 | 29 | 0.35 | 1 | 0 | 8.6 | 0.0 | 280 | 49.8 | 4.4 | 0.896 | 940 | 59.0 |
| 19-20 | 0.00 | 0.00 | 0.00 | 0 | 0.00 | 0 | 0 | 5.4 | 0.0 | 0 |
Regression Meter
This meter measures whether or not a player's point production is being influenced by luck. Orange indicates the player has been lucky. Dark grey indicates the player has been unlucky.
2A/60
tEVSH%
SH%
IPP
PPSH%
Positional Data
| Season | Team | Left | Center | Right |
|---|---|---|---|---|
| 23-24 | DET | 100 | 0 | 0 |
| 22-23 | DET | 100 | 0 | 0 |
| 21-22 | DET | 100 | 0 | 0 |
| 20-21 | STL | 92 | 0 | 8 |
| 19-20 | STL | 100 | 0 | 0 |
Most Common Pairings and Pair Production
See also: Detroit Red Wings Line Combos | Line Production Tool
| Team | D1 | D2 | GF | GA | GF% | SATF | SATA | SAT% | USATF | USATA | USAT% | SH% | SV% | SHSV | ZS% |
|---|---|---|---|---|---|---|---|---|---|---|---|---|---|---|---|
| DET | MORITZ SEIDER | JAKE WALMAN | 39 | 44 | 47.0 | 776 | 946 | 45.1 | 543 | 661 | 45.1 | 10.2 | 0.900 | 1003 | 41.8 |
| DET | SHAYNE GOSTISBEHERE | JAKE WALMAN | 2 | 4 | 33.3 | 43 | 58 | 42.6 | 30 | 49 | 38.0 | 11.1 | 0.882 | 993 | 85.7 |
| DET | JEFF PETRY | JAKE WALMAN | 1 | 2 | 33.3 | 38 | 23 | 62.3 | 28 | 18 | 60.9 | 5.6 | 0.818 | 874 | 40.0 |
Most Recent 10 Games
| OPP | G | A | P | +/- | PIM | SOG | SH% | H | BS | FW | FL | FO% | TOI | EVTOI | PPTOI | PKTOI | ID |
|---|---|---|---|---|---|---|---|---|---|---|---|---|---|---|---|---|---|
| NYR | 0 | 0 | 0 | -2 | 0 | 0 | 0 | 0 | 0 | 0 | 0 | 0 | 16:18 | 15:52 | 00:00 | 00:26 | 21213 |
| TBL | 0 | 0 | 0 | 0 | 0 | 2 | 0 | 4 | 1 | 0 | 0 | 0 | 12:10 | 12:01 | 00:09 | 00:00 | 21184 |
| PIT | 0 | 0 | 0 | -3 | 0 | 1 | 0 | 0 | 2 | 0 | 0 | 0 | 22:07 | 17:40 | 00:21 | 04:06 | 21078 |
| BUF | 0 | 0 | 0 | 1 | 0 | 0 | 0 | 2 | 3 | 0 | 0 | 0 | 23:25 | 20:36 | 01:39 | 01:10 | 21059 |
| ARI | 0 | 0 | 0 | -2 | 0 | 3 | 0 | 0 | 3 | 0 | 0 | 0 | 20:19 | 18:27 | 00:00 | 01:52 | 21048 |
| BUF | 1 | 0 | 1 | -1 | 0 | 3 | 33.3 | 1 | 1 | 0 | 0 | 0 | 21:21 | 16:34 | 00:00 | 04:47 | 21031 |
| ARI | 0 | 0 | 0 | 0 | 0 | 3 | 0 | 1 | 1 | 0 | 0 | 0 | 18:30 | 16:47 | 00:00 | 01:43 | 21005 |
| COL | 0 | 0 | 0 | -2 | 2 | 1 | 0 | 2 | 2 | 0 | 0 | 0 | 18:42 | 14:43 | 00:00 | 03:59 | 20991 |
| FLA | 0 | 0 | 0 | 0 | 16 | 1 | 0 | 2 | 2 | 0 | 0 | 0 | 16:20 | 14:19 | 00:06 | 01:55 | 20961 |
| NYI | 0 | 0 | 0 | -3 | 0 | 3 | 0 | 0 | 0 | 0 | 0 | 0 | 21:07 | 18:14 | 00:00 | 02:53 | 20943 |
Player Usage Chart / Possession and Luck Chart