LUKE KUNIN
Explore projections, stats, news, player usage charts, and line combinations for members of the San Jose Sharks
-
Center Leaders
2023 - 2024
Name G A Pts Nathan
MacKinnon51 89 140 Connor McDavid 32 100 132 Auston Matthews 69 38 107 Leon Draisaitl 41 65 106 J.T. Miller 37 66 103 Sam Reinhart 57 37 94 Sidney Crosby 42 52 94 Brayden Point 46 44 90 Sebastian Aho 36 53 89 Elias Pettersson 34 55 89 Robert Thomas 26 60 86 Steven Stamkos 40 41 81 -
Player Card

LUKE KUNIN
San Jose Sharks2023 - 2024- G 11
- A 7
- PTS 18
- +/- -30
- PIM 83
- PPP 5
- SH% 11.2
- L 18%
- C 37%
- R 45%
-
San Jose Sharks Leaders
2023 - 2024
Name PPG PPA PPP Mikael
Granlund1 22 23 William Eklund 8 8 16 Fabian Zetterlund 6 10 16 Calen Addison 0 9 9 Thomas Bordeleau 4 3 7 Mike Hoffman 3 3 6 Luke Kunin 2 3 5 Jacob MacDonald 3 1 4 Filip Zadina 3 1 4 Henry Thrun 2 2 4 Kevin Labanc 0 3 3 Alexander Barabanov 0 2 2
News
-
Luke Kunin
Has agreed to a one-year contract extension.
Jun 30, 2024 - 12:17 pm -
Luke Kunin
Is a game time decision for today's game.
Feb 24, 2024 - 1:55 pm -
Luke Kunin
Has been placed on IR.
Dec 2, 2023 - 1:20 pm -
Luke Kunin
Will miss tonight's game against the New Jersey Devils due to an upper-body injury.
Dec 1, 2023 - 6:55 pm
Feature
-
Trending
Buy-Low and Sell-High: Skaters
Replies 0
Basic Stats
| Season | Team | GP | G | A | P | +/- | PIM | S | S/GP | SH% | PPP | H | BS | FW | FO% | TOI | EVTOI | PPTOI | PKTOI |
|---|---|---|---|---|---|---|---|---|---|---|---|---|---|---|---|---|---|---|---|
| 23-24 | SJS | 77 | 11 | 7 | 18 | -30 | 83 | 98 | 1.3 | 11.2 | 5 | 165 | 60 | 218 | 45.4 | 15.74 | 12.91 | 0.90 | 1.92 |
| 22-23 | SJS | 31 | 5 | 8 | 13 | -9 | 42 | 58 | 1.9 | 8.6 | 4 | 63 | 27 | 5 | 41.7 | 15.43 | 12.17 | 1.42 | 1.85 |
| 21-22 | NSH | 82 | 13 | 9 | 22 | -11 | 99 | 125 | 1.5 | 10.4 | 2 | 223 | 51 | 48 | 44.0 | 13.83 | 12.15 | 0.95 | 0.73 |
| 20-21 | NSH | 38 | 10 | 9 | 19 | 3 | 13 | 71 | 1.9 | 14.1 | 0 | 84 | 20 | 15 | 33.3 | 13.99 | 12.97 | 0.65 | 0.37 |
| 19-20 | MIN | 63 | 15 | 16 | 31 | -10 | 55 | 128 | 2 | 11.7 | 2 | 64 | 54 | 210 | 44.5 | 15.47 | 13.28 | 0.80 | 1.39 |
Enhanced Stats (5-on-5 unless denoted with *)
| Season | G/60 | A/60 | P/60 | IPP | ΔPEN/60 | 1A | 2A | EVS/60* | PPS/60* | SATF | SAT% | tEVSH% | tEVSV% | SHSV | ZS% |
|---|---|---|---|---|---|---|---|---|---|---|---|---|---|---|---|
| 23-24 | 0.50 | 0.19 | 0.68 | 55 | 0.05 | 3 | 0 | 5.0 | 6.9 | 803 | 40.7 | 5.5 | 0.922 | 977 | 42.3 |
| 22-23 | 0.50 | 0.67 | 1.18 | 58 | -0.63 | 3 | 1 | 7.7 | 9.6 | 283 | 41.5 | 7.7 | 0.903 | 980 | 44.9 |
| 21-22 | 0.82 | 0.44 | 1.26 | 60 | -0.69 | 5 | 2 | 6.8 | 11.6 | 809 | 45.4 | 7.9 | 0.915 | 994 | 51.1 |
| 20-21 | 1.26 | 1.13 | 2.39 | 79 | 0.11 | 6 | 3 | 8.4 | 2.4 | 412 | 46.9 | 10.7 | 0.942 | 1049 | 51.2 |
| 19-20 | 0.92 | 0.92 | 1.84 | 73 | -0.49 | 6 | 6 | 8.1 | 8.4 | 681 | 45.4 | 8.6 | 0.913 | 999 | 43.9 |
Regression Meter
This meter measures whether or not a player's point production is being influenced by luck. Orange indicates the player has been lucky. Dark grey indicates the player has been unlucky.
2A/60
tEVSH%
SH%
IPP
PPSH%
Positional Data
| Season | Team | Left | Center | Right |
|---|---|---|---|---|
| 23-24 | SJS | 18 | 37 | 45 |
| 22-23 | SJ | 0 | 0 | 100 |
| 21-22 | SJ | 0 | 0 | 0 |
| 20-21 | NSH | 0 | 10 | 90 |
| 19-20 | MIN | 0 | 34 | 66 |
Most Common Linemates and Line Production
See also: San Jose Sharks Line Combo Tool | Line Production Tool
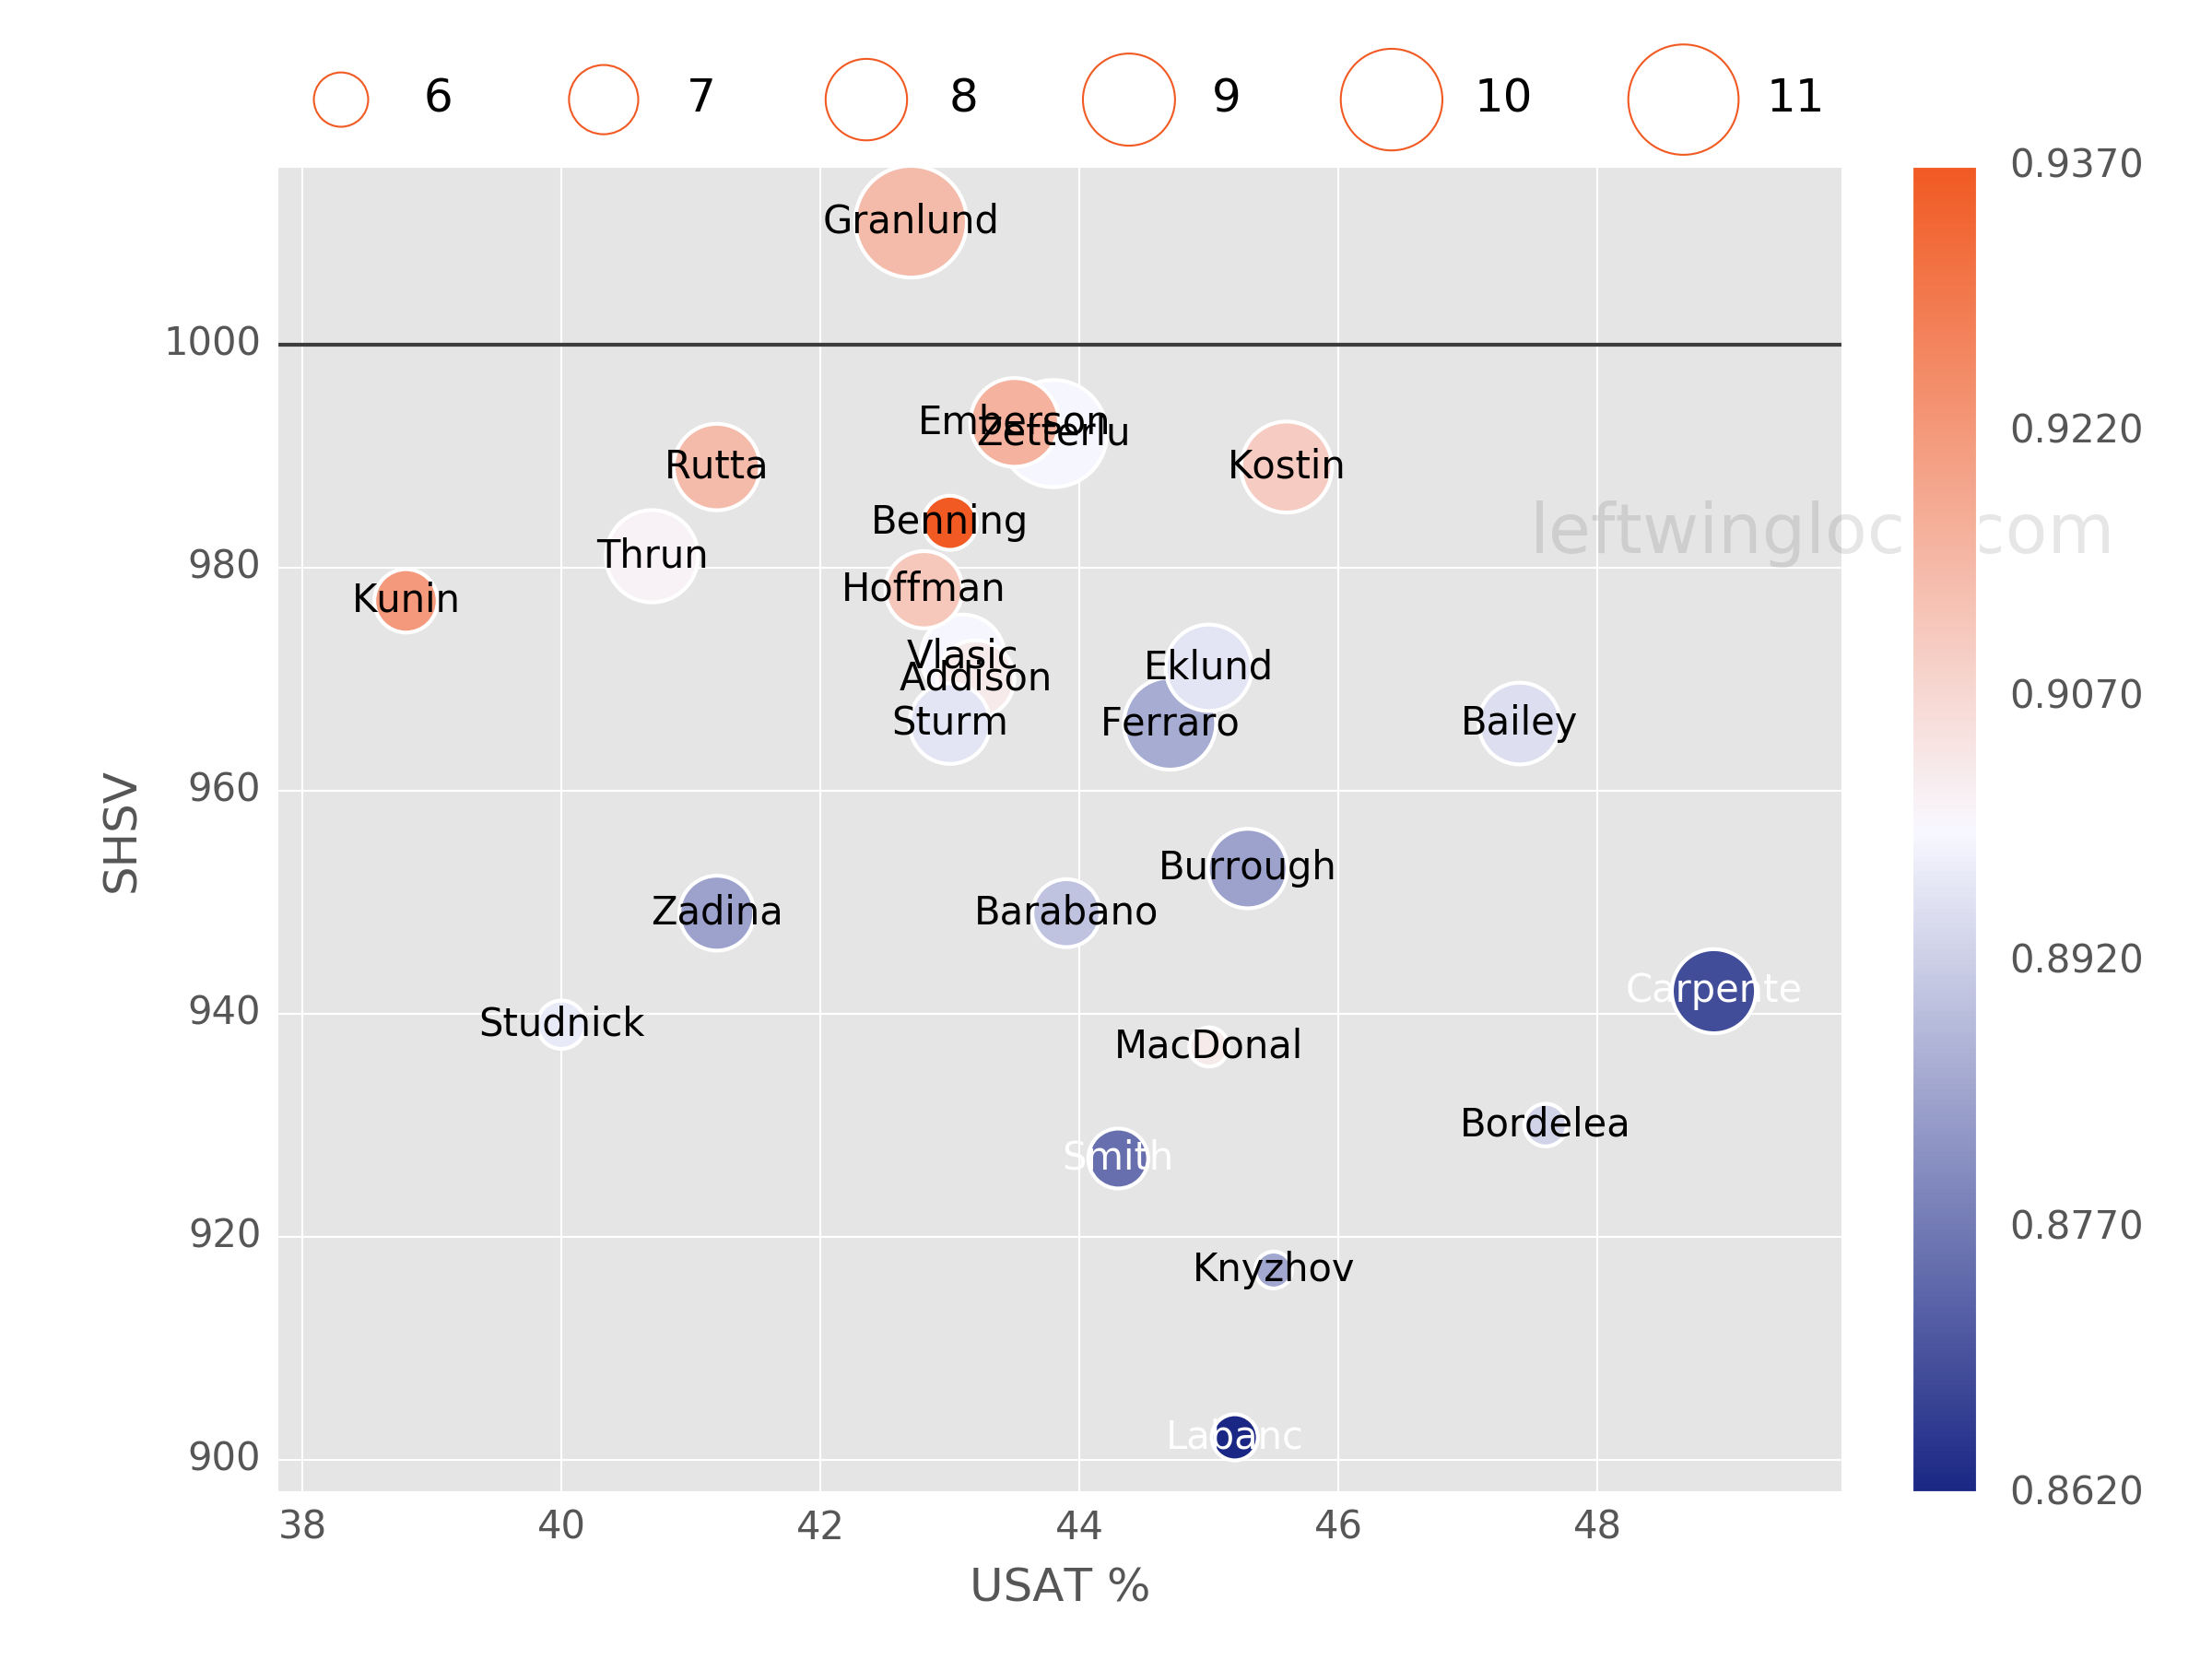
| Team | F1 | F2 | F3 | GF | GA | GF% | SATF | SATA | SAT% | USATF | USATA | USAT% | SH% | SV% | SHSV | ZS% |
|---|---|---|---|---|---|---|---|---|---|---|---|---|---|---|---|---|
| SJS | EKLUND | KUNIN | ZADINA | 3 | 9 | 25.0 | 115 | 150 | 43.4 | 78 | 115 | 40.4 | 6.0 | 0.885 | 945 | 81.3 |
| SJS | EKLUND | KUNIN | BAILEY | 0 | 3 | 0.0 | 48 | 45 | 51.6 | 29 | 34 | 46.0 | 0.0 | 0.864 | 864 | 50.0 |
| SJS | EKLUND | STURM | KUNIN | 5 | 1 | 83.3 | 47 | 63 | 42.7 | 28 | 46 | 37.8 | 31.3 | 0.963 | 1275 | 30.3 |
Most Recent 10 Games
| OPP | G | A | P | +/- | PIM | SOG | SH% | H | BS | FW | FL | FO% | TOI | EVTOI | PPTOI | PKTOI | ID |
|---|---|---|---|---|---|---|---|---|---|---|---|---|---|---|---|---|---|
| CGY | 0 | 0 | 0 | -1 | 2 | 0 | 0 | 0 | 2 | 5 | 4 | 56 | 14:41 | 12:48 | 00:44 | 01:09 | 21309 |
| EDM | 0 | 0 | 0 | -1 | 0 | 0 | 0 | 1 | 0 | 6 | 11 | 35 | 18:46 | 18:13 | 00:33 | 00:00 | 21293 |
| MIN | 0 | 0 | 0 | -2 | 0 | 2 | 0 | 3 | 0 | 9 | 5 | 64 | 17:52 | 15:50 | 01:06 | 00:56 | 21282 |
| SEA | 1 | 0 | 1 | 2 | 2 | 2 | 50 | 3 | 4 | 12 | 7 | 63 | 20:12 | 17:39 | 02:06 | 00:27 | 21263 |
| CGY | 0 | 0 | 0 | -1 | 0 | 0 | 0 | 2 | 0 | 4 | 8 | 33 | 17:45 | 14:00 | 01:16 | 02:29 | 21251 |
| ARI | 1 | 0 | 1 | 1 | 0 | 1 | 100 | 1 | 1 | 5 | 4 | 56 | 16:02 | 10:07 | 03:09 | 02:46 | 21231 |
| STL | 0 | 1 | 1 | 1 | 5 | 0 | 0 | 3 | 1 | 2 | 5 | 29 | 18:41 | 10:46 | 02:12 | 05:43 | 21221 |
| LAK | 0 | 0 | 0 | -1 | 7 | 1 | 0 | 3 | 3 | 8 | 2 | 80 | 14:00 | 11:29 | 00:52 | 01:39 | 21210 |
| SEA | 0 | 0 | 0 | -1 | 0 | 1 | 0 | 3 | 0 | 10 | 7 | 59 | 18:02 | 15:22 | 00:17 | 02:23 | 21188 |
| STL | 1 | 0 | 1 | 2 | 0 | 2 | 50 | 3 | 0 | 4 | 5 | 44 | 17:50 | 14:21 | 01:40 | 01:49 | 21177 |
Player Usage Chart / Possession and Luck Chart