MICHAEL RASMUSSEN
Explore projections, stats, news, player usage charts, and line combinations for members of the Detroit Red Wings
-
Center Leaders
2023 - 2024
Name G A Pts Nathan
MacKinnon51 89 140 Connor McDavid 32 100 132 Auston Matthews 69 38 107 Leon Draisaitl 41 65 106 J.T. Miller 37 66 103 Sam Reinhart 57 37 94 Sidney Crosby 42 52 94 Brayden Point 46 44 90 Sebastian Aho 36 53 89 Elias Pettersson 34 55 89 Robert Thomas 26 60 86 Steven Stamkos 40 41 81 -
Player Card

MICHAEL RASMUSSEN
Detroit Red Wings2023 - 2024- G 13
- A 20
- PTS 33
- +/- 8
- PIM 47
- PPP 0
- SH% 12.9
- L 83%
- C 7%
- R 10%
-
Detroit Red Wings Leaders
2023 - 2024
Name PPG PPA PPP Shayne
Gostisbehere2 27 29 Dylan Larkin 14 12 26 Alex DeBrincat 11 8 19 David Perron 7 10 17 Moritz Seider 3 14 17 Lucas Raymond 6 10 16 Patrick Kane 2 13 15 Robby Fabbri 5 7 12 Daniel Sprong 3 9 12 J.T. Compher 5 5 10 Joe Veleno 3 2 5 Jake Walman 1 3 4
News
-
Michael Rasmussen
Has been ruled out for Sunday's game.
Apr 6, 2024 - 1:13 pm -
Michael Rasmussen
Is considered day-to-day with an upper-body injury.
Apr 3, 2024 - 12:26 pm -
Michael Rasmussen
Is sick but not too sick. He is a game-time decision for tonight's game.
Mar 19, 2024 - 11:16 am -
Michael Rasmussen
Has agreed to a four-year contract extension.
Feb 20, 2024 - 12:04 pm
Feature
-
Trending
No articles available
Replies 0
Basic Stats
| Season | Team | GP | G | A | P | +/- | PIM | S | S/GP | SH% | PPP | H | BS | FW | FO% | TOI | EVTOI | PPTOI | PKTOI |
|---|---|---|---|---|---|---|---|---|---|---|---|---|---|---|---|---|---|---|---|
| 23-24 | DET | 75 | 13 | 20 | 33 | 8 | 47 | 101 | 1.3 | 12.9 | 0 | 124 | 76 | 58 | 48.3 | 15.19 | 13.26 | 0.16 | 1.78 |
| 22-23 | DET | 56 | 10 | 19 | 29 | 2 | 43 | 88 | 1.6 | 11.4 | 1 | 119 | 48 | 203 | 51.0 | 15.09 | 12.89 | 0.51 | 1.69 |
| 21-22 | DET | 80 | 15 | 12 | 27 | -25 | 66 | 128 | 1.6 | 11.7 | 2 | 142 | 65 | 410 | 50.1 | 14.52 | 12.40 | 0.88 | 1.24 |
| 20-21 | DET | 40 | 3 | 9 | 12 | -5 | 26 | 62 | 1.6 | 4.8 | 2 | 72 | 28 | 134 | 44.4 | 14.80 | 11.94 | 2.27 | 0.59 |
Enhanced Stats (5-on-5 unless denoted with *)
| Season | G/60 | A/60 | P/60 | IPP | ΔPEN/60 | 1A | 2A | EVS/60* | PPS/60* | SATF | SAT% | tEVSH% | tEVSV% | SHSV | ZS% |
|---|---|---|---|---|---|---|---|---|---|---|---|---|---|---|---|
| 23-24 | 0.68 | 0.93 | 1.62 | 65 | -0.11 | 10 | 5 | 5.4 | 15.4 | 812 | 43.8 | 10.1 | 0.918 | 1019 | 40.1 |
| 22-23 | 0.62 | 1.24 | 1.87 | 68 | 0.50 | 9 | 5 | 6.2 | 8.4 | 567 | 45.8 | 10.7 | 0.907 | 1014 | 49.2 |
| 21-22 | 0.82 | 0.51 | 1.33 | 65 | -0.10 | 5 | 3 | 7.0 | 9.3 | 712 | 43.4 | 8.0 | 0.894 | 974 | 40.8 |
| 20-21 | 0.26 | 0.79 | 1.06 | 47 | -0.20 | 6 | 0 | 5.3 | 10.6 | 289 | 38.8 | 10.1 | 0.901 | 1002 | 46.7 |
Regression Meter
This meter measures whether or not a player's point production is being influenced by luck. Orange indicates the player has been lucky. Dark grey indicates the player has been unlucky.
2A/60
tEVSH%
SH%
IPP
PPSH%
Positional Data
| Season | Team | Left | Center | Right |
|---|---|---|---|---|
| 23-24 | DET | 83 | 7 | 10 |
| 22-23 | DET | 45 | 55 | 0 |
| 21-22 | DET | 13 | 85 | 3 |
| 20-21 | DET | 5 | 92 | 3 |
Most Common Linemates and Line Production
See also: Detroit Red Wings Line Combo Tool | Line Production Tool
| Team | F1 | F2 | F3 | GF | GA | GF% | SATF | SATA | SAT% | USATF | USATA | USAT% | SH% | SV% | SHSV | ZS% |
|---|---|---|---|---|---|---|---|---|---|---|---|---|---|---|---|---|
| DET | FISCHER | COPP | RASMUSSEN | 11 | 10 | 52.4 | 204 | 251 | 44.8 | 145 | 182 | 44.3 | 10.1 | 0.917 | 1018 | 40.4 |
| DET | COMPHER | RASMUSSEN | RAYMOND | 3 | 2 | 60.0 | 66 | 71 | 48.2 | 42 | 46 | 47.7 | 11.1 | 0.931 | 1042 | 24.0 |
| DET | COMPHER | COPP | RASMUSSEN | 3 | 5 | 37.5 | 60 | 107 | 35.9 | 41 | 70 | 36.9 | 10.0 | 0.884 | 984 | 33.3 |
Most Recent 10 Games
| OPP | G | A | P | +/- | PIM | SOG | SH% | H | BS | FW | FL | FO% | TOI | EVTOI | PPTOI | PKTOI | ID |
|---|---|---|---|---|---|---|---|---|---|---|---|---|---|---|---|---|---|
| TBL | 0 | 0 | 0 | 0 | 0 | 1 | 0 | 1 | 0 | 0 | 0 | 0 | 14:11 | 11:57 | 00:05 | 02:09 | 21184 |
| FLA | 0 | 0 | 0 | 0 | 0 | 2 | 0 | 1 | 3 | 0 | 0 | 0 | 12:24 | 11:51 | 00:00 | 00:33 | 21165 |
| CAR | 0 | 0 | 0 | -3 | 0 | 2 | 0 | 1 | 1 | 0 | 0 | 0 | 17:49 | 16:28 | 00:00 | 01:21 | 21150 |
| WSH | 0 | 0 | 0 | -1 | 0 | 1 | 0 | 0 | 0 | 0 | 0 | 0 | 14:34 | 13:26 | 00:00 | 01:08 | 21140 |
| NSH | 0 | 0 | 0 | -1 | 0 | 0 | 0 | 0 | 1 | 0 | 0 | 0 | 12:58 | 11:56 | 00:00 | 01:02 | 21116 |
| NYI | 0 | 2 | 2 | 2 | 4 | 4 | 0 | 0 | 1 | 0 | 1 | 0 | 14:04 | 12:05 | 00:38 | 01:21 | 21100 |
| CBJ | 0 | 1 | 1 | 0 | 2 | 1 | 0 | 2 | 1 | 0 | 0 | 0 | 15:49 | 15:49 | 00:00 | 00:00 | 21083 |
| PIT | 0 | 1 | 1 | -1 | 2 | 1 | 0 | 0 | 0 | 0 | 1 | 0 | 11:40 | 08:44 | 00:00 | 02:56 | 21078 |
| BUF | 0 | 1 | 1 | 2 | 2 | 0 | 0 | 4 | 1 | 1 | 0 | 100 | 17:46 | 17:46 | 00:00 | 00:00 | 21059 |
| ARI | 0 | 0 | 0 | 0 | 2 | 0 | 0 | 2 | 2 | 0 | 0 | 0 | 16:01 | 14:36 | 00:11 | 01:14 | 21048 |
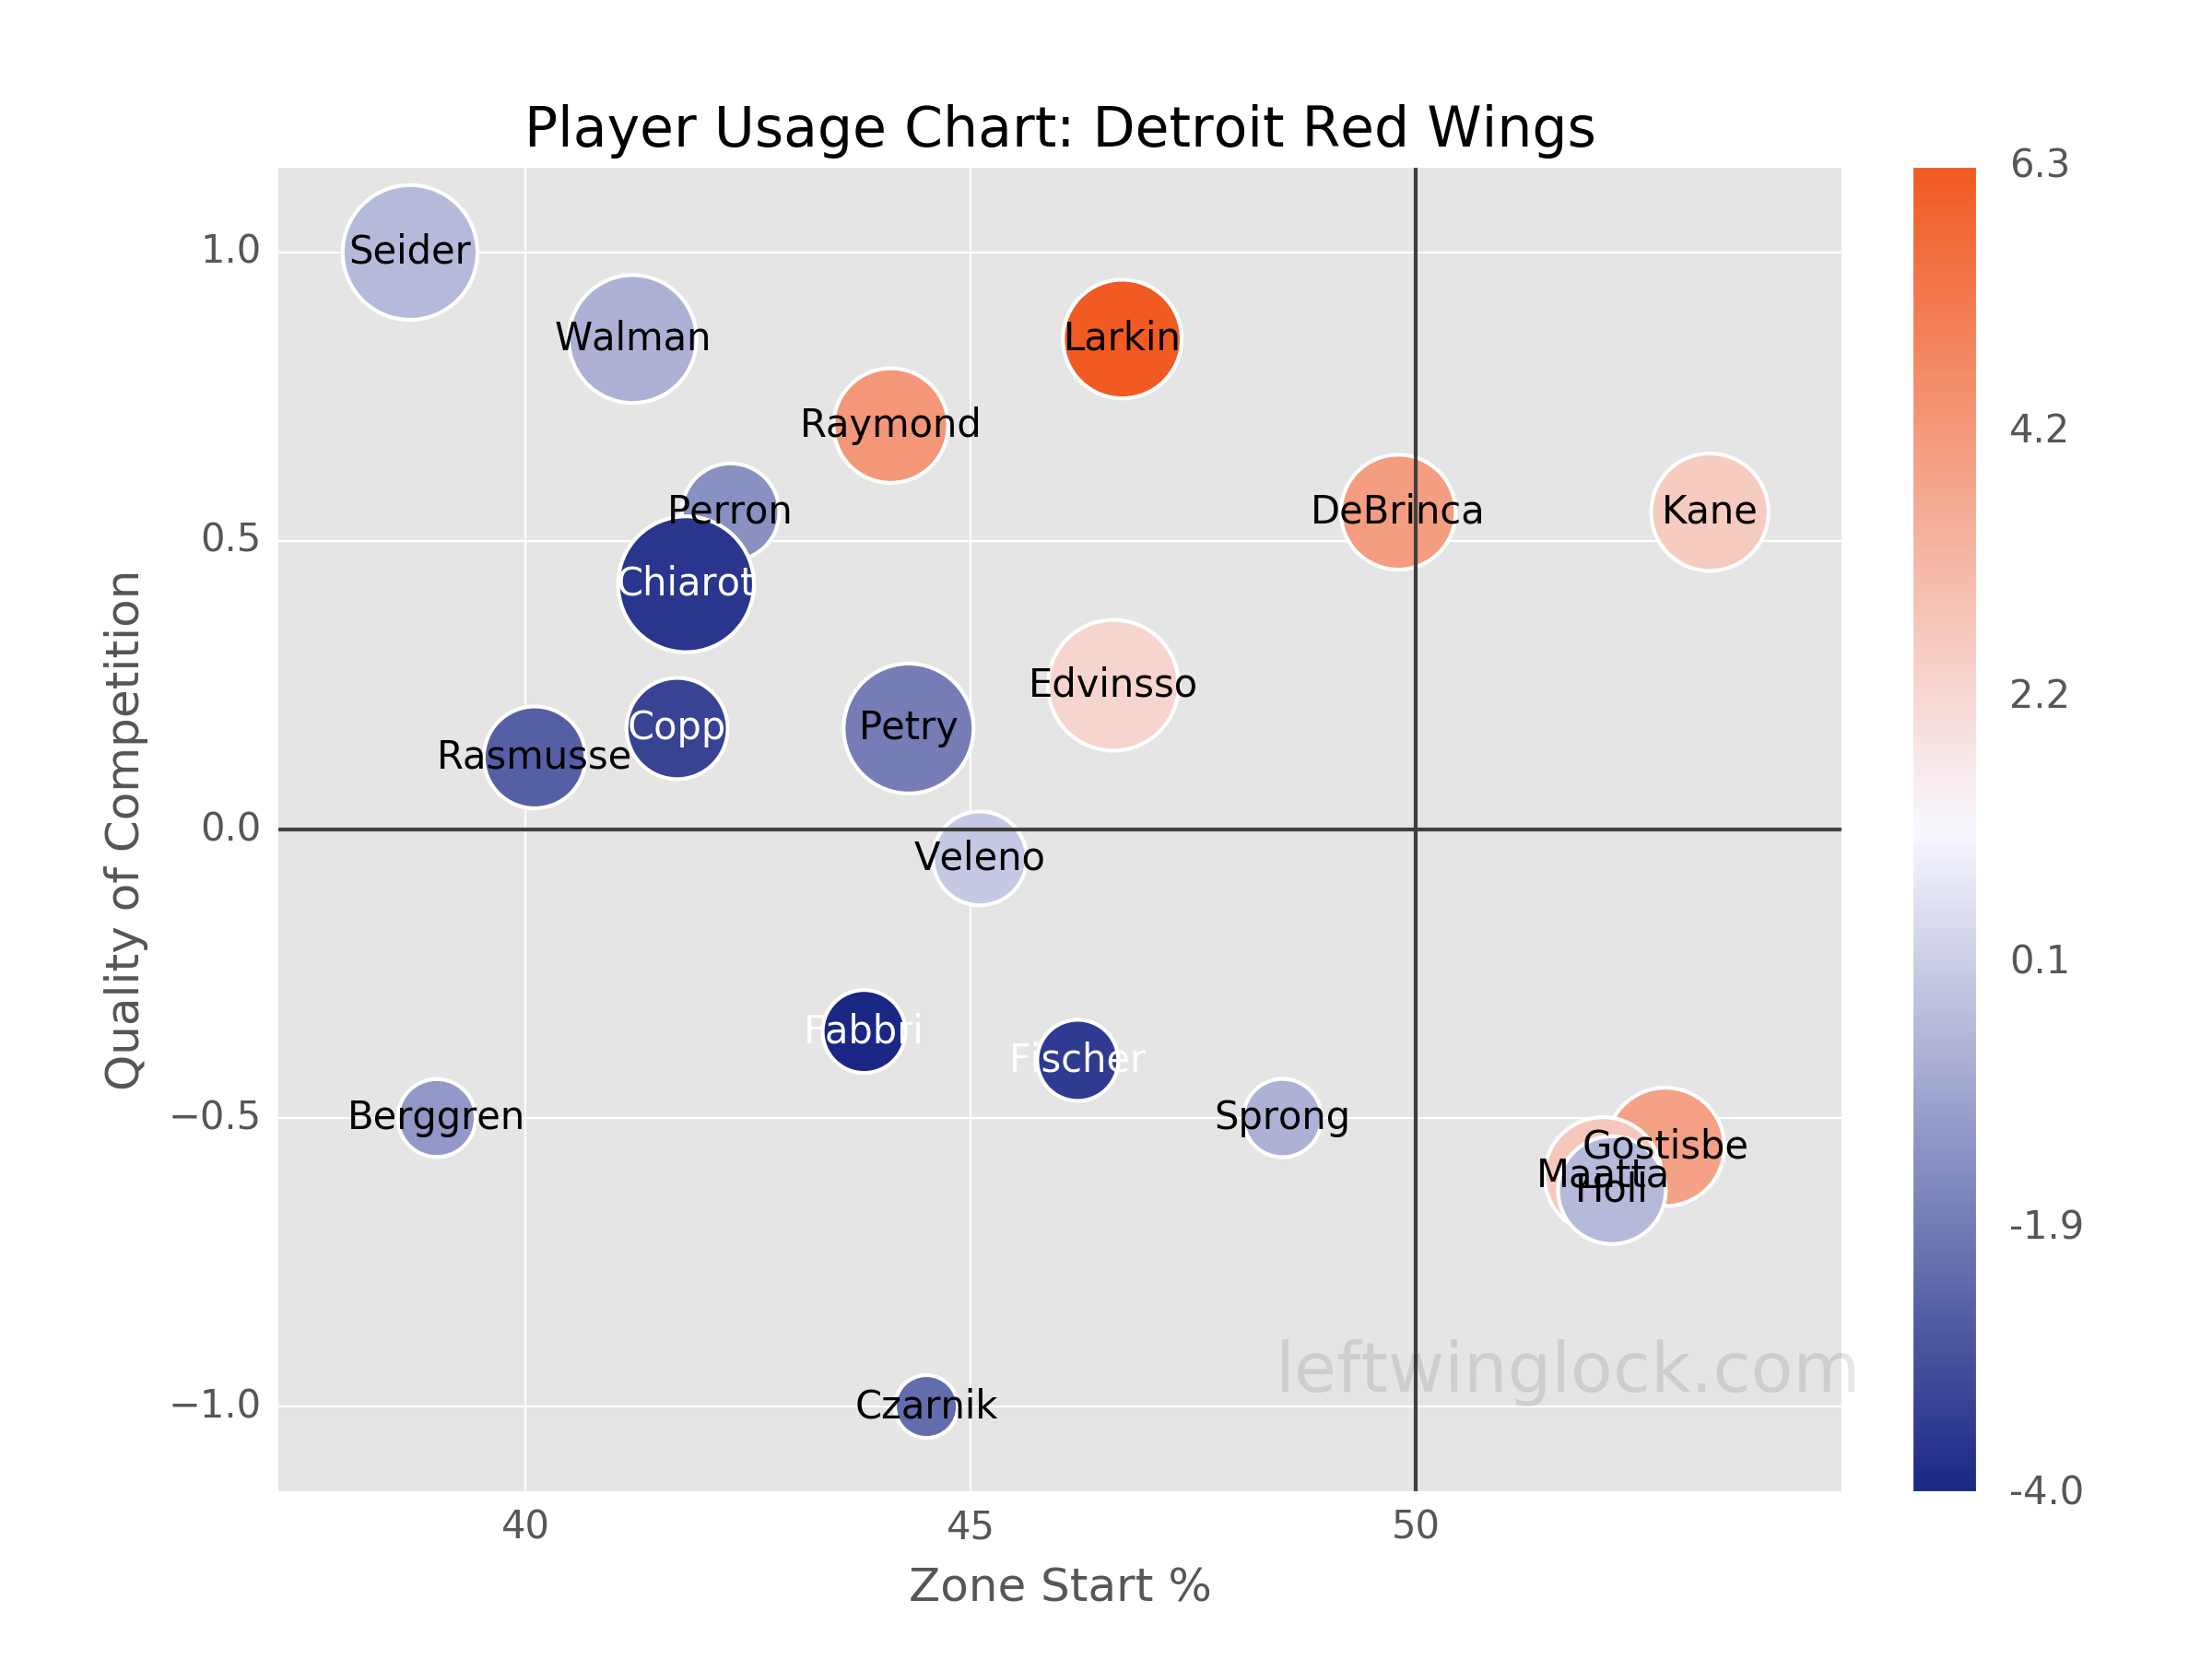
Player Usage Chart / Possession and Luck Chart