NICOLAS DESLAURIERS
Explore projections, stats, news, player usage charts, and line combinations for members of the Philadelphia Flyers
-
Left Wing Leaders
2023 - 2024
Name G A Pts Artemi
Panarin49 71 120 Kirill Kaprizov 46 50 96 Filip Forsberg 48 46 94 Matthew Tkachuk 26 62 88 Jesper Bratt 27 56 83 Jason Robertson 29 51 80 Zach Hyman 54 23 77 Chris Kreider 39 36 75 Brandon Hagel 26 49 75 Brady Tkachuk 37 37 74 Kevin Fiala 29 44 73 Lucas Raymond 31 41 72 -
Player Card

NICOLAS DESLAURIERS
Philadelphia Flyers2023 - 2024- G 1
- A 3
- PTS 4
- +/- -7
- PIM 89
- PPP 0
- SH% 2
- L 100%
- C 0%
- R 0%
-
Philadelphia Flyers Leaders
2023 - 2024
Name G A Pts Travis
Konecny33 35 68 Owen Tippett 28 25 53 Joel Farabee 22 28 50 Travis Sanheim 10 34 44 Morgan Frost 13 28 41 Scott Laughton 13 26 39 Sean Couturier 11 27 38 Tyson Foerster 20 13 33 Cam York 10 20 30 Cam Atkinson 13 15 28 Ryan Poehling 11 17 28 Ryan Johansen 13 10 23
News
-
Nicolas Deslauriers
Is not expected to be in the lineup for today's game.
Mar 23, 2024 - 12:01 pm -
Nicolas Deslauriers
Is not expected to be in the lineup for today's game.
Jan 18, 2024 - 5:22 pm -
Nicolas Deslauriers
Is expected to be in the lineup for today's game.
Jan 12, 2024 - 12:20 pm -
Nicolas Deslauriers
Is not expected to be in the lineup for today's game.
Jan 10, 2024 - 10:31 am
Feature
-
Trending
Buy-Low and Sell-High: Skaters
Replies 0
Basic Stats
| Season | Team | GP | G | A | P | +/- | PIM | S | S/GP | SH% | PPP | H | BS | FW | FO% | TOI | EVTOI | PPTOI | PKTOI |
|---|---|---|---|---|---|---|---|---|---|---|---|---|---|---|---|---|---|---|---|
| 23-24 | PHI | 60 | 1 | 3 | 4 | -7 | 89 | 49 | 0.8 | 2.0 | 0 | 188 | 21 | 5 | 38.5 | 8.15 | 8.07 | 0.08 | 0.00 |
| 22-23 | PHI | 80 | 6 | 6 | 12 | -11 | 136 | 70 | 0.9 | 8.6 | 0 | 306 | 26 | 3 | 27.3 | 10.09 | 9.22 | 0.04 | 0.83 |
| 21-22 | MIN | 81 | 8 | 5 | 13 | -11 | 113 | 90 | 1.1 | 8.9 | 0 | 263 | 49 | 1 | 25.0 | 11.37 | 10.12 | 0.03 | 1.22 |
| 20-21 | ANA | 49 | 5 | 5 | 10 | -7 | 53 | 65 | 1.3 | 7.7 | 0 | 136 | 20 | 1 | 25.0 | 11.32 | 11.13 | 0.03 | 0.15 |
| 19-20 | ANA | 59 | 7 | 6 | 13 | -1 | 92 | 64 | 1.1 | 10.9 | 0 | 137 | 32 | 0 | 0.0 | 9.78 | 9.70 | 0.05 | 0.03 |
Enhanced Stats (5-on-5 unless denoted with *)
| Season | G/60 | A/60 | P/60 | IPP | ΔPEN/60 | 1A | 2A | EVS/60* | PPS/60* | SATF | SAT% | tEVSH% | tEVSV% | SHSV | ZS% |
|---|---|---|---|---|---|---|---|---|---|---|---|---|---|---|---|
| 23-24 | 0.12 | 0.37 | 0.50 | 44 | -1.23 | 1 | 2 | 6.1 | 0.0 | 413 | 46.0 | 4.4 | 0.934 | 978 | 57.0 |
| 22-23 | 0.41 | 0.49 | 0.90 | 61 | -0.59 | 1 | 5 | 5.4 | 0.0 | 584 | 44.9 | 6.0 | 0.914 | 974 | 51.0 |
| 21-22 | 0.44 | 0.37 | 0.82 | 100 | -0.39 | 3 | 2 | 6.3 | 0.0 | 626 | 43.8 | 5.4 | 0.933 | 987 | 43.8 |
| 20-21 | 0.45 | 0.45 | 0.89 | 57 | -0.76 | 1 | 3 | 6.9 | 0.0 | 411 | 44.8 | 6.8 | 0.902 | 970 | 34.8 |
| 19-20 | 0.74 | 0.63 | 1.37 | 59 | -0.42 | 4 | 2 | 6.7 | 0.0 | 477 | 44.4 | 8.8 | 0.928 | 1016 | 36.2 |
Regression Meter
This meter measures whether or not a player's point production is being influenced by luck. Orange indicates the player has been lucky. Dark grey indicates the player has been unlucky.
2A/60
tEVSH%
SH%
IPP
PPSH%
Positional Data
| Season | Team | Left | Center | Right |
|---|---|---|---|---|
| 23-24 | PHI | 100 | 0 | 0 |
| 22-23 | PHI | 97 | 1 | 1 |
| 21-22 | PHI | 0 | 0 | 0 |
| 20-21 | ANA | 90 | 0 | 10 |
| 19-20 | ANA | 100 | 0 | 0 |
Most Common Linemates and Line Production
See also: Philadelphia Flyers Line Combo Tool | Line Production Tool
| Team | F1 | F2 | F3 | GF | GA | GF% | SATF | SATA | SAT% | USATF | USATA | USAT% | SH% | SV% | SHSV | ZS% |
|---|---|---|---|---|---|---|---|---|---|---|---|---|---|---|---|---|
| PHI | DESLAURIERS | POEHLING | HATHAWAY | 1 | 4 | 20.0 | 116 | 123 | 48.5 | 86 | 82 | 51.2 | 1.6 | 0.926 | 942 | 68.2 |
| PHI | DESLAURIERS | LAUGHTON | HATHAWAY | 2 | 7 | 22.2 | 80 | 121 | 39.8 | 59 | 89 | 39.9 | 4.8 | 0.887 | 935 | 33.3 |
| PHI | DESLAURIERS | HATHAWAY | CATES | 0 | 1 | 0.0 | 38 | 39 | 49.4 | 24 | 23 | 51.1 | 0.0 | 0.923 | 923 | 88.9 |
Most Recent 10 Games
| OPP | G | A | P | +/- | PIM | SOG | SH% | H | BS | FW | FL | FO% | TOI | EVTOI | PPTOI | PKTOI | ID |
|---|---|---|---|---|---|---|---|---|---|---|---|---|---|---|---|---|---|
| NYI | 0 | 0 | 0 | -1 | 0 | 0 | 0 | 2 | 0 | 0 | 0 | 0 | 05:30 | 05:21 | 00:09 | 00:00 | 21183 |
| CAR | 0 | 0 | 0 | 0 | 0 | 0 | 0 | 1 | 0 | 0 | 0 | 0 | 03:44 | 03:44 | 00:00 | 00:00 | 21099 |
| TOR | 0 | 0 | 0 | 0 | 5 | 0 | 0 | 5 | 0 | 0 | 0 | 0 | 05:21 | 05:21 | 00:00 | 00:00 | 21086 |
| BOS | 1 | 0 | 1 | 0 | 0 | 1 | 100 | 3 | 0 | 0 | 0 | 0 | 08:32 | 08:32 | 00:00 | 00:00 | 21064 |
| TBL | 0 | 0 | 0 | 0 | 5 | 1 | 0 | 2 | 1 | 0 | 0 | 0 | 09:02 | 09:02 | 00:00 | 00:00 | 21016 |
| FLA | 0 | 0 | 0 | 0 | 0 | 2 | 0 | 2 | 1 | 0 | 0 | 0 | 07:13 | 07:13 | 00:00 | 00:00 | 20996 |
| OTT | 0 | 0 | 0 | 0 | 0 | 1 | 0 | 3 | 0 | 0 | 0 | 0 | 07:25 | 07:23 | 00:02 | 00:00 | 20962 |
| WSH | 0 | 0 | 0 | 0 | 0 | 0 | 0 | 3 | 0 | 0 | 0 | 0 | 06:28 | 06:28 | 00:00 | 00:00 | 20954 |
| TBL | 0 | 0 | 0 | 0 | 0 | 1 | 0 | 5 | 0 | 0 | 0 | 0 | 10:10 | 08:56 | 01:14 | 00:00 | 20930 |
| PIT | 0 | 0 | 0 | 2 | 2 | 0 | 0 | 1 | 0 | 0 | 0 | 0 | 07:47 | 07:33 | 00:14 | 00:00 | 20917 |
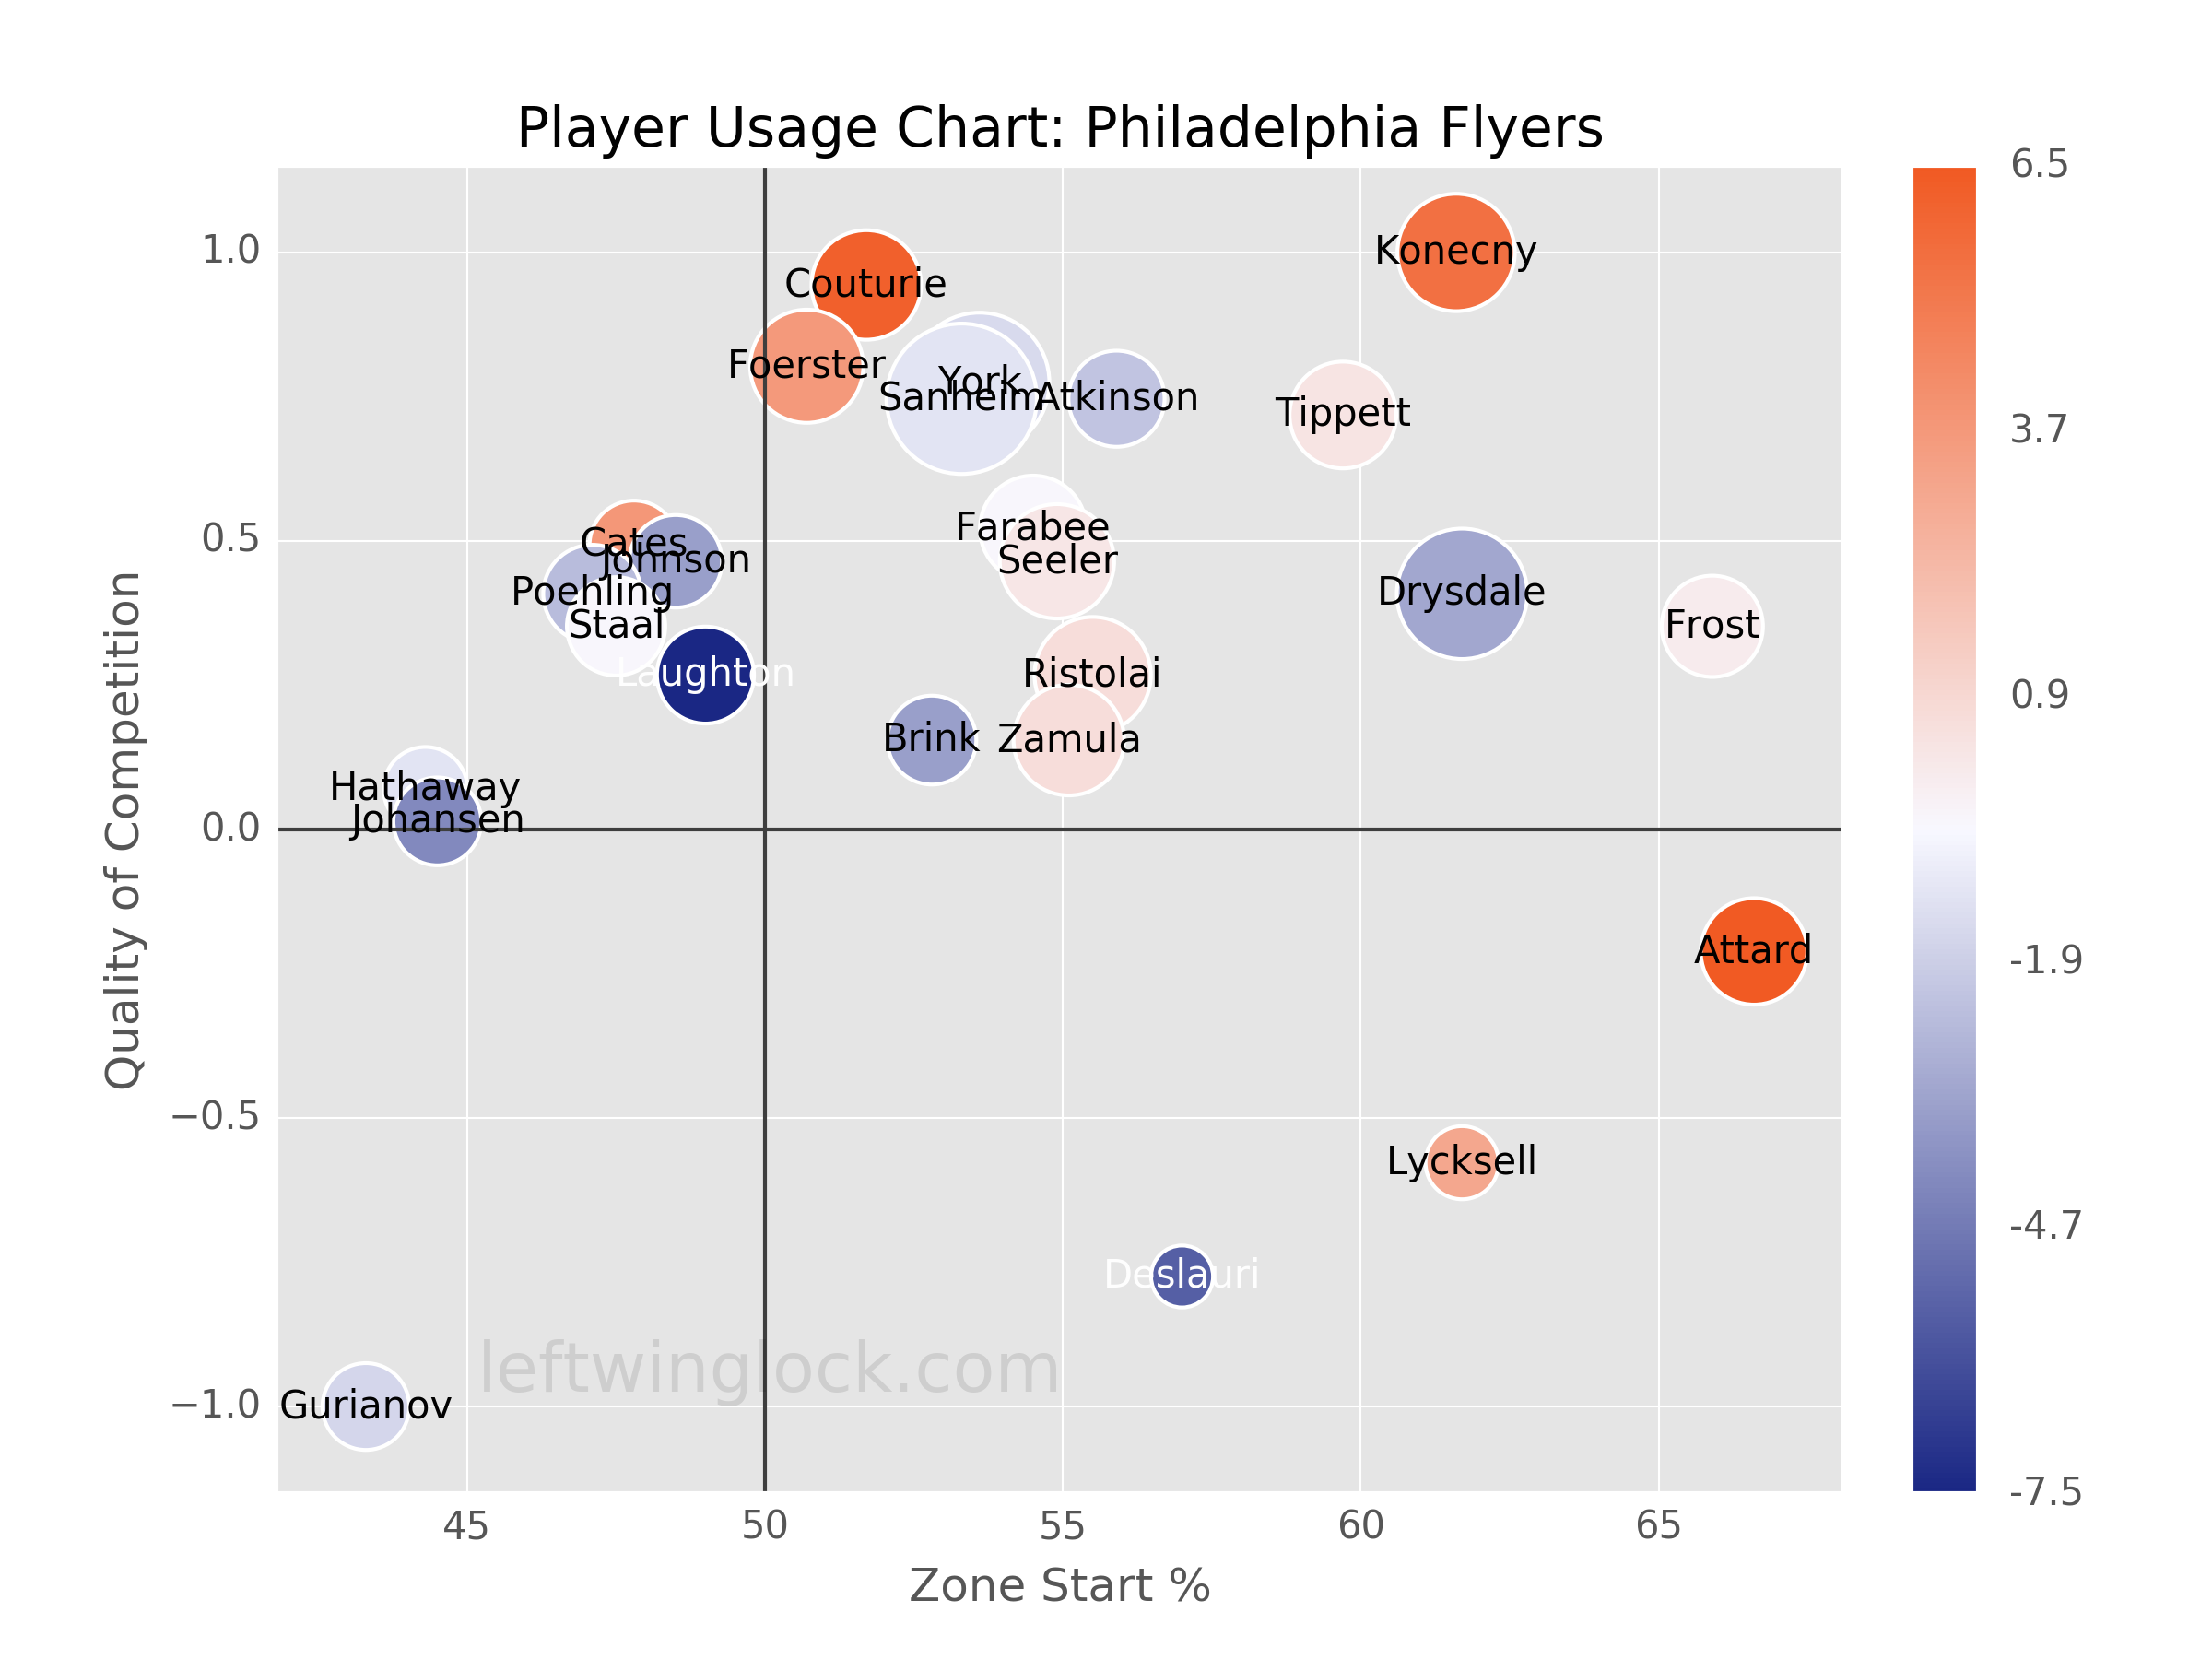
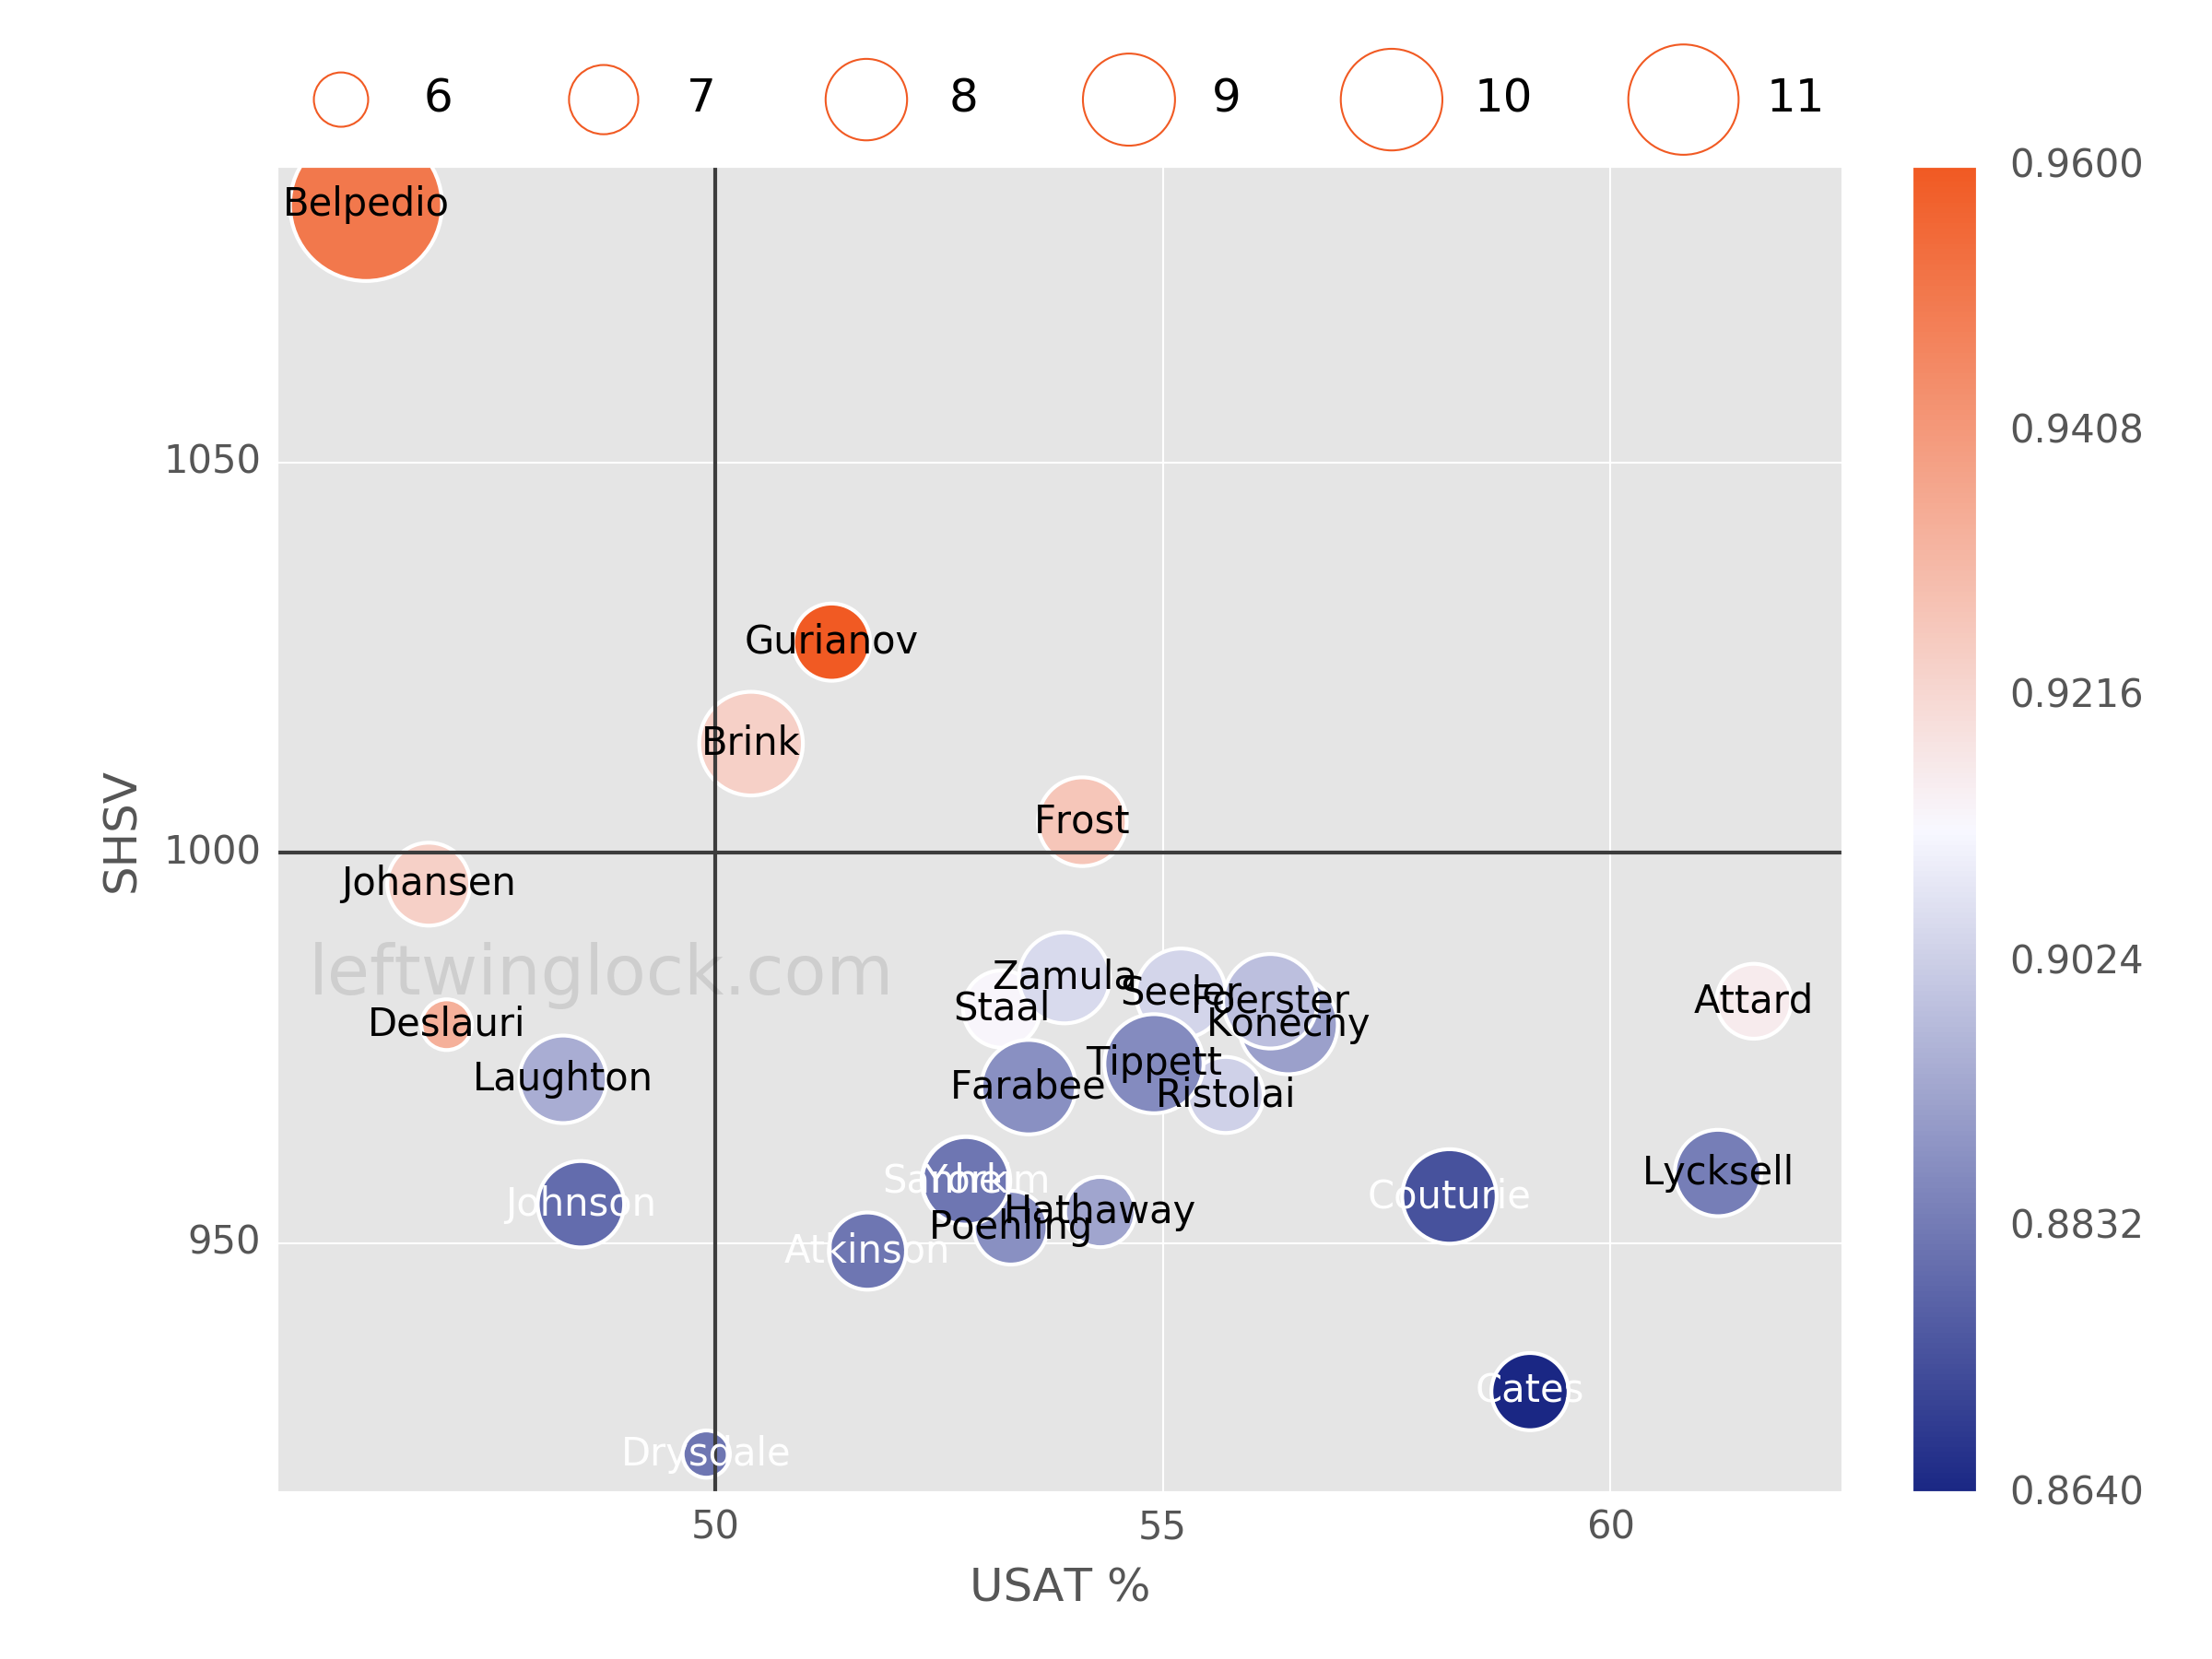
Player Usage Chart / Possession and Luck Chart