TOMAS HERTL
Explore projections, stats, news, player usage charts, and line combinations for members of the Vegas Golden Knights
-
Center Leaders
2023 - 2024
Name G A Pts Nathan
MacKinnon51 89 140 Connor McDavid 32 100 132 Auston Matthews 69 38 107 Leon Draisaitl 41 65 106 J.T. Miller 37 66 103 Sam Reinhart 57 37 94 Sidney Crosby 42 52 94 Brayden Point 46 44 90 Sebastian Aho 36 53 89 Elias Pettersson 34 55 89 Robert Thomas 26 60 86 Steven Stamkos 40 41 81 -
Player Card
TOMAS HERTL
Vegas Golden Knights2023 - 2024- G 17
- A 21
- PTS 38
- +/- -28
- PIM 22
- PPP 11
- SH% 13.7
- L 20%
- C 80%
- R 0%
-
Vegas Golden Knights Leaders
2023 - 2024
Name G A Pts Jonathan
Marchessault42 27 69 Jack Eichel 31 37 68 William Karlsson 30 30 60 Mark Stone 16 37 53 Chandler Stephenson 16 35 51 Noah Hanifin 13 34 47 Ivan Barbashev 19 26 45 Anthony Mantha 23 21 44 Shea Theodore 5 37 42 Nicolas Roy 13 28 41 Tomas Hertl 17 21 38 Alex Pietrangelo 4 29 33
News
-
Tomas Hertl
Is on the ice for warmups.
Apr 8, 2024 - 9:33 pm -
Tomas Hertl
Will travel with the team and is expected to play on the road trip.
Apr 7, 2024 - 3:26 pm -
Tomas Hertl
Is on the ice for practice in a no-contact jersey.
Apr 1, 2024 - 1:46 pm -
Tomas Hertl
Has been traded to the Vegas Golden Knights in exchange for David Edstrom, a 2025 1st round draft pick, a 2025 3rd round draft pick, and a 2027 3rd round draft pick.
Mar 8, 2024 - 3:20 pm
Feature
-
Trending
Buy-Low and Sell-High: Skaters
Replies 0
Basic Stats
| Season | Team | GP | G | A | P | +/- | PIM | S | S/GP | SH% | PPP | H | BS | FW | FO% | TOI | EVTOI | PPTOI | PKTOI |
|---|---|---|---|---|---|---|---|---|---|---|---|---|---|---|---|---|---|---|---|
| 23-24 | VGK | 54 | 17 | 21 | 38 | -28 | 22 | 124 | 2.3 | 13.7 | 11 | 59 | 49 | 565 | 57.5 | 20.49 | 15.87 | 2.88 | 1.75 |
| 22-23 | SJS | 79 | 22 | 41 | 63 | -36 | 42 | 183 | 2.3 | 12.0 | 22 | 91 | 57 | 792 | 54.8 | 19.28 | 16.01 | 3.05 | 0.22 |
| 21-22 | SJS | 82 | 30 | 34 | 64 | -9 | 30 | 205 | 2.5 | 14.6 | 16 | 105 | 57 | 769 | 52.5 | 19.94 | 15.91 | 2.49 | 1.53 |
| 20-21 | SJS | 50 | 19 | 24 | 43 | 1 | 27 | 112 | 2.2 | 17.0 | 10 | 39 | 39 | 485 | 55.1 | 19.14 | 14.80 | 2.64 | 1.70 |
| 19-20 | SJS | 48 | 16 | 20 | 36 | -18 | 16 | 117 | 2.4 | 13.7 | 7 | 29 | 25 | 433 | 54.8 | 18.45 | 14.41 | 2.58 | 1.45 |
Enhanced Stats (5-on-5 unless denoted with *)
| Season | G/60 | A/60 | P/60 | IPP | ΔPEN/60 | 1A | 2A | EVS/60* | PPS/60* | SATF | SAT% | tEVSH% | tEVSV% | SHSV | ZS% |
|---|---|---|---|---|---|---|---|---|---|---|---|---|---|---|---|
| 23-24 | 0.38 | 0.99 | 1.36 | 76 | 0.16 | 11 | 2 | 6.3 | 10.0 | 798 | 47.2 | 6.5 | 0.895 | 960 | 44.6 |
| 22-23 | 0.66 | 1.02 | 1.69 | 63 | -0.24 | 10 | 10 | 6.1 | 12.0 | 1234 | 52.4 | 8.7 | 0.888 | 975 | 56.6 |
| 21-22 | 0.90 | 1.05 | 1.95 | 67 | 0.07 | 14 | 7 | 7.0 | 10.0 | 1144 | 49.0 | 9.9 | 0.912 | 1011 | 44.1 |
| 20-21 | 0.97 | 1.50 | 2.47 | 85 | 0.00 | 9 | 8 | 6.3 | 9.6 | 663 | 51.7 | 8.7 | 0.909 | 996 | 45.5 |
| 19-20 | 0.94 | 1.03 | 1.97 | 70 | 0.14 | 8 | 3 | 7.8 | 9.7 | 645 | 53.3 | 9.0 | 0.875 | 965 | 48.1 |
Regression Meter
This meter measures whether or not a player's point production is being influenced by luck. Orange indicates the player has been lucky. Dark grey indicates the player has been unlucky.
Positional Data
| Season | Team | Left | Center | Right |
|---|---|---|---|---|
| 23-24 | VGK | 20 | 80 | 0 |
| 22-23 | SJ | 3 | 97 | 0 |
| 21-22 | SJ | 0 | 100 | 0 |
| 20-21 | SJ | 0 | 100 | 0 |
| 19-20 | SJ | 23 | 77 | 0 |
Most Common Linemates and Line Production
See also: Vegas Golden Knights Line Combo Tool | Line Production Tool
| Team | F1 | F2 | F3 | GF | GA | GF% | SATF | SATA | SAT% | USATF | USATA | USAT% | SH% | SV% | SHSV | ZS% |
|---|---|---|---|---|---|---|---|---|---|---|---|---|---|---|---|---|
| SJS | BARABANOV | HERTL | EKLUND | 1 | 6 | 14.3 | 100 | 94 | 51.5 | 71 | 66 | 51.8 | 2.4 | 0.867 | 890 | 48.6 |
| SJS | EKLUND | HERTL | ZETTERLUND | 4 | 2 | 66.7 | 99 | 124 | 44.4 | 72 | 74 | 49.3 | 8.3 | 0.961 | 1044 | 50.0 |
| SJS | EKLUND | HERTL | ZADINA | 4 | 4 | 50.0 | 83 | 86 | 49.1 | 63 | 56 | 52.9 | 9.1 | 0.889 | 980 | 52.2 |
Most Recent 10 Games
| OPP | G | A | P | +/- | PIM | SOG | SH% | H | BS | FW | FL | FO% | TOI | EVTOI | PPTOI | PKTOI | ID |
|---|---|---|---|---|---|---|---|---|---|---|---|---|---|---|---|---|---|
| DAL | 0 | 0 | 0 | -1 | 0 | 2 | 0 | 3 | 1 | 4 | 4 | 50 | 18:49 | 17:39 | 01:10 | 00:00 | 30157 |
| DAL | 0 | 0 | 0 | 0 | 0 | 2 | 0 | 2 | 0 | 8 | 4 | 67 | 17:52 | 15:29 | 02:23 | 00:00 | 30156 |
| DAL | 0 | 0 | 0 | -1 | 0 | 2 | 0 | 3 | 1 | 7 | 4 | 64 | 20:04 | 17:15 | 02:49 | 00:00 | 30155 |
| DAL | 0 | 0 | 0 | -2 | 0 | 2 | 0 | 6 | 1 | 5 | 4 | 56 | 18:41 | 16:33 | 01:50 | 00:18 | 30154 |
| DAL | 0 | 0 | 0 | -1 | 2 | 2 | 0 | 2 | 1 | 12 | 8 | 60 | 19:35 | 18:03 | 01:04 | 00:28 | 30153 |
| DAL | 0 | 0 | 0 | 0 | 0 | 2 | 0 | 5 | 0 | 9 | 9 | 50 | 19:15 | 17:51 | 01:24 | 00:00 | 30152 |
| DAL | 1 | 0 | 1 | -1 | 0 | 2 | 50 | 3 | 0 | 8 | 6 | 57 | 15:36 | 13:47 | 01:00 | 00:49 | 30151 |
| ANA | 0 | 0 | 0 | -2 | 0 | 2 | 0 | 1 | 1 | 10 | 3 | 77 | 17:51 | 14:49 | 03:02 | 00:00 | 21311 |
| CHI | 0 | 1 | 1 | 1 | 0 | 1 | 0 | 0 | 0 | 6 | 5 | 55 | 13:49 | 12:18 | 00:58 | 00:33 | 21301 |
| COL | 1 | 0 | 1 | 0 | 0 | 5 | 20 | 0 | 0 | 19 | 6 | 76 | 17:44 | 13:50 | 03:54 | 00:00 | 21284 |
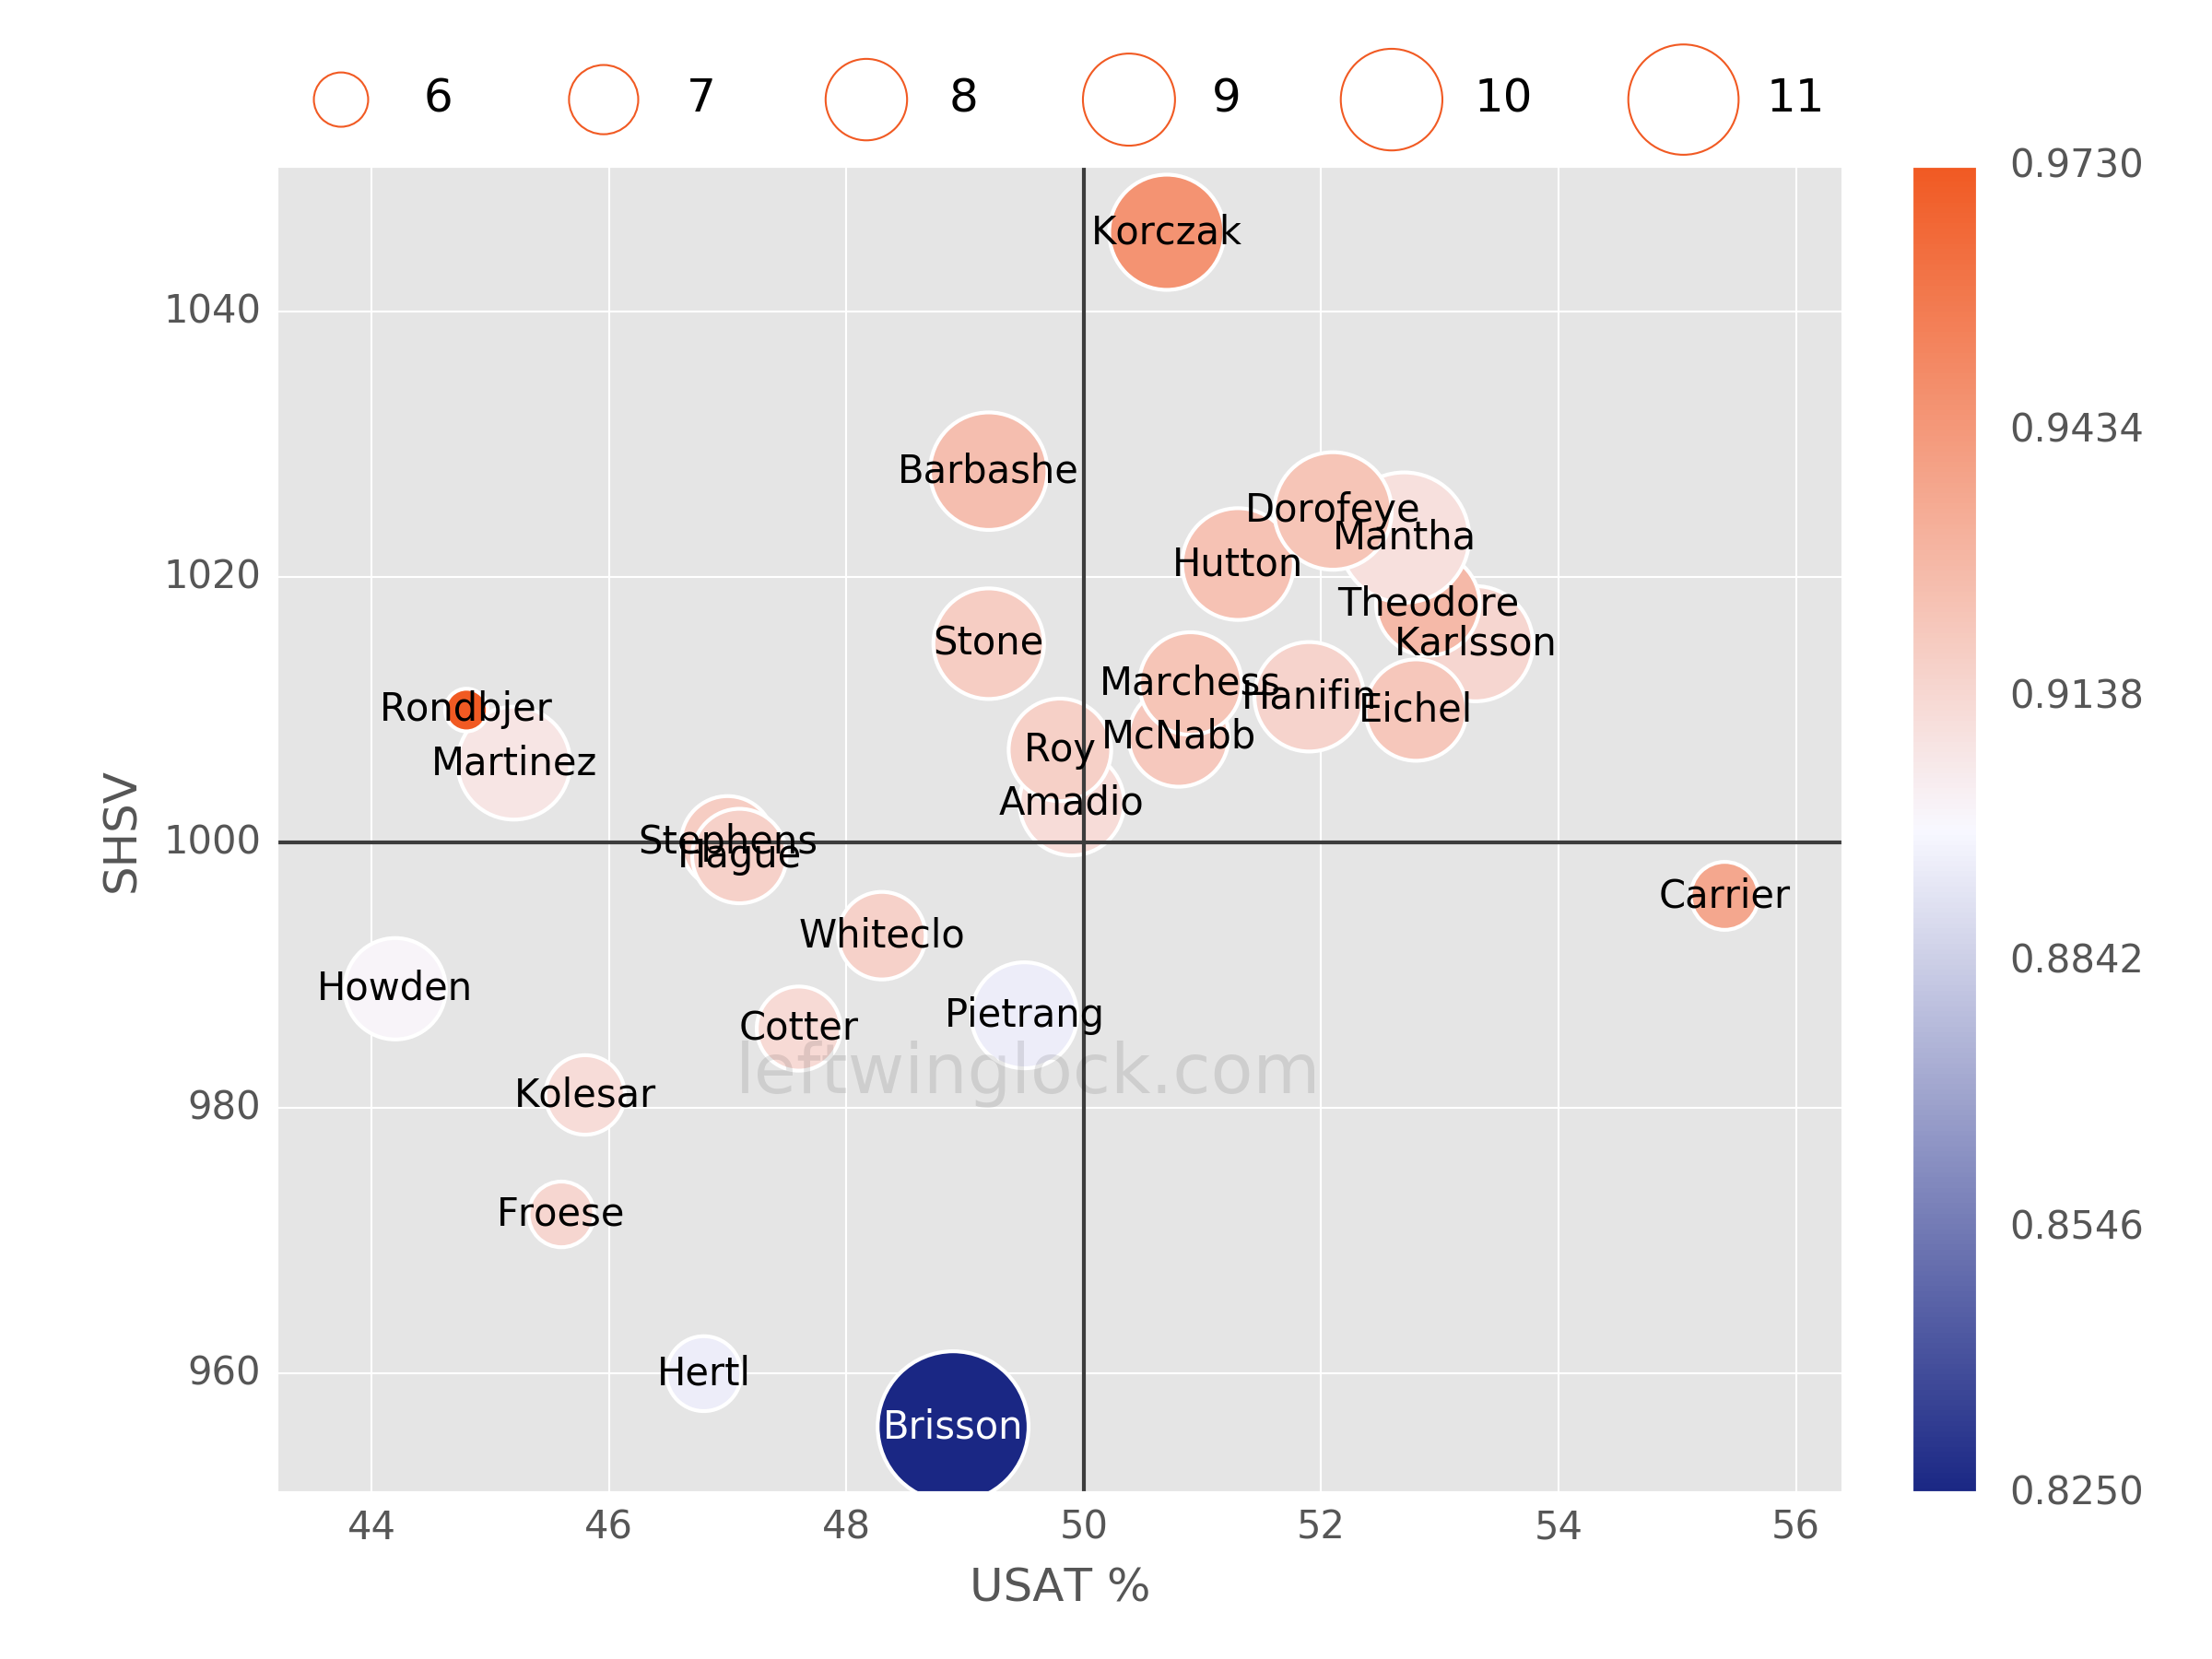
Player Usage Chart / Possession and Luck Chart